
On August 5, Axon Enterprise (AXON) reported second-quarter revenue of $904 million, up 35% and its tenth straight quarter above 30% growth, then raised full-year guidance to 32% to 34%. Future contracted bookings reached $15.1 billion, up more than 40%.
The stock closed Friday at $447.76, about 43% below its 52-week high.
Our Growth IRA model portfolio holds a 1.25% starter with a 4% target weight, and the easy move from here is to average down.
I am not going to.
So what has to happen on the chart before the other 2.75 points go in?
The short version is a session that ends back above the Ichimoku cloud, which sits roughly between $530 and $575 today and narrows toward $550 by mid-October. Below that, Axon is a falling price I see no reason to chase, however much I like the business. That rule can look timid for a stock we say we believe in over two to five years. I would argue it is the opposite, and the rest of this piece explains why, starting with the long-term case and ending with the exact levels.
Why the model owns Axon at all
Let me start with the mechanism, because the moat lives there and not in the product catalog. (AXON) sells police departments a stun-gun line, body cameras and a cloud platform where the footage and case files eventually live. Hardware gets the company through the door, and the subscription underneath it is what compounds.
Once a department’s evidence chain, custody logs and court exports run through one system, switching means migrating years of legal records and retraining every officer. Almost nobody does that voluntarily.
You can watch that lock-in convert into revenue right now. Through mid-2026, more than fifty US municipalities cancelled or rejected contracts with the incumbent plate-reader vendor after a backlash over data sharing. Several of them, Denver and Antioch among them, moved the work to Axon. Council records keep citing the same reason, which is that Axon was already inside the department.
Annual recurring revenue reached $1.6 billion in the second quarter, up 39%. Net revenue retention came in at 126%, meaning the average existing customer spent 26% more than a year earlier before Axon signed anyone new. Over the same quarter, Motorola Solutions (MSI) grew a similar-sized backlog 11% while Axon grew contracted bookings by more than 40%. Share gain against the largest incumbent looks exactly like that.
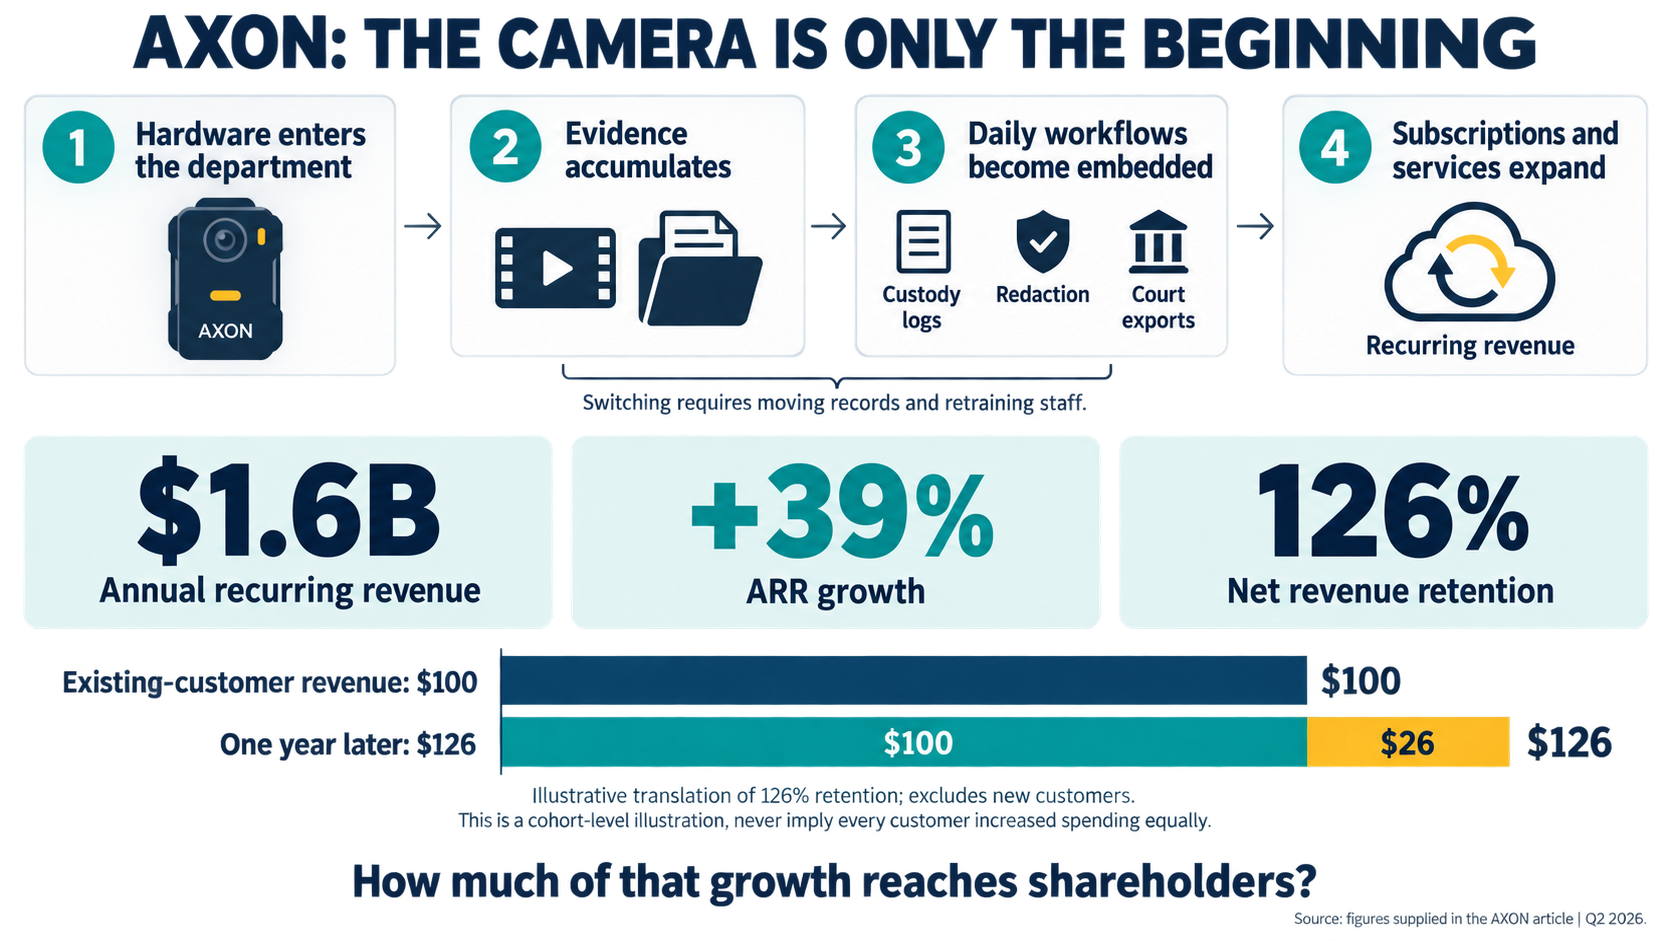
Then there is the plan management put on paper in February and reiterated with the second-quarter results. By 2028 the company targets roughly $6 billion of annual revenue against $2.8 billion in 2025, an adjusted EBITDA margin near 28%, adjusted free cash flow of 60% of that EBITDA, and dilution from stock compensation held under 2.5% a year.
Analyst forecasts lean the same way. Consensus estimates sit at $7.62 of adjusted earnings per share for 2026, $10.51 for 2027 and $14.18 for 2028, and the five-year crowd-sourced estimate set in GNG Research, built from sixteen analysts, projects earnings compounding near 30% a year. Both forward-looking tools we use draw the same upward path. At Friday’s close Axon trades at about 32 times that 2028 consensus estimate, which is the real reason a 1.25% starter already sits in the portfolio.
What the adjusted numbers leave out
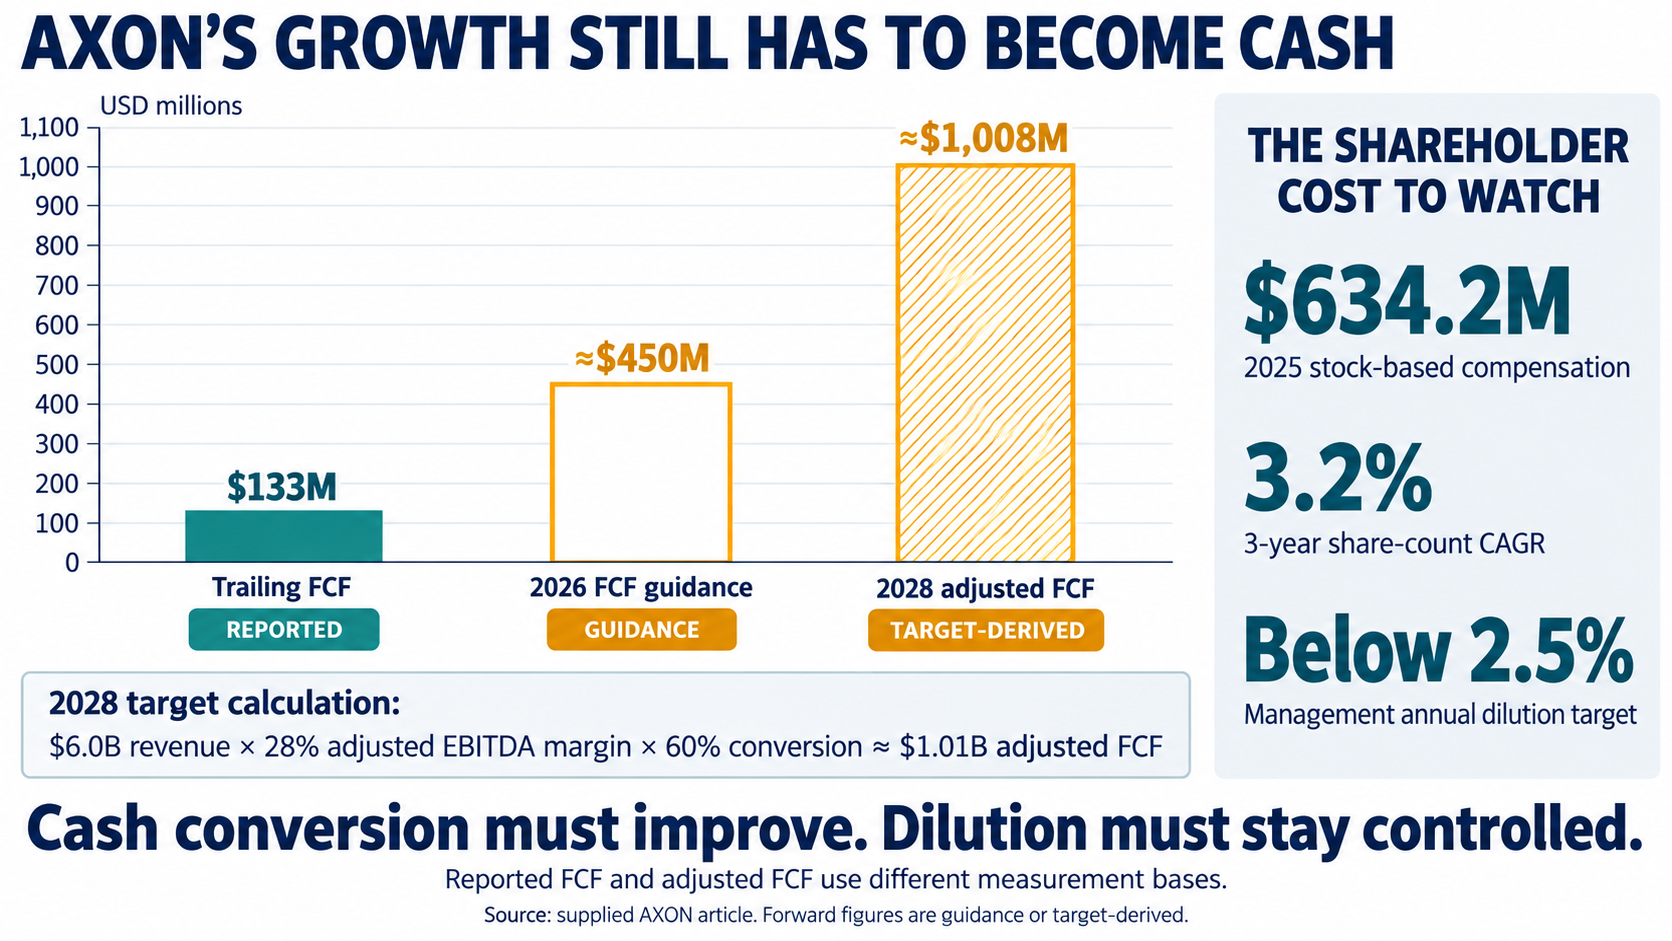
None of that makes the stock cheap on today’s cash. In fiscal 2025 Axon reported GAAP net income of $124.7 million against $634.2 million of stock-based compensation, and every adjusted figure above adds that compensation back.
When you pay employees in stock and report earnings as though the stock were free, reported profit stops describing what an owner receives.
Trailing free cash flow is $133 million against a $36.1 billion market value, a 0.35% yield, and return on invested capital sits at 4.4%. Motorola Solutions converts 21.9% of sales into free cash flow and earns 20.9% on capital at about 24 times forward earnings. Even Heico (HEI) earns 13.6% at roughly 41 times.
(AXON) wins on growth by a mile. It trails both on what that growth hands back to owners today, and that gap will not close in a single year even if every 2026 target lands on schedule.
Management guides 2026 free cash flow to roughly $450 million, more than triple the trailing figure. The trailing number has been crushed by a first-half working capital build of $256.9 million. Run the 2028 targets through and adjusted free cash flow lands near $1.0 billion, about 2.8% of today’s market value, still before charging for stock compensation. That dilution cap of 2.5% is the promise I care about most, because share count has been compounding at 3.2%.
Our Greenwald no-growth test fails, and not narrowly.
Earnings power value lands near $95 a share, so nearly everything above that is a claim on the future. A position built on the future has to respect the tape, because nothing underneath the price stops a fall.
Why a strong quarter still broke the chart
Before we go further, two things hit the stock in September, and only one of them deserved the reaction.
On September 15 Axon announced $1.0 billion of 0% convertible notes due 2031, and shares fell 9.8% to $442.08. The terms read far better than the headline. The notes convert near $652.06, and Axon spent $99.9 million on capped calls that push the effective dilution ceiling to $1,049.94. Convertible buyers typically short the stock to hedge, so some of September’s selling was mechanical, and that pressure fades once the hedge books are built.
The bigger problem sits in the bond market. On Friday the 10-year Treasury closed at 5.00%, and the Federal Reserve raised its target range to 3.75% to 4.00% that same week while signalling another increase. Long-duration equities reset first when the discount rate jumps like that, and Street research through August and September has been cutting Axon targets on discount rates while leaving earnings estimates broadly intact.
Our own valuation has the same exposure. The Vulcan run used a 10.5% cost of capital, and our cached diagnostic for Axon now reads 13.0%, so the blended fair value of $492 likely compresses toward the mid-$400s. Call that approximate, since the full model has not been rebuilt at the new rate. Either way, valuation offers no margin of safety big enough to justify buying into a falling chart.
What trend repair looks like on this chart
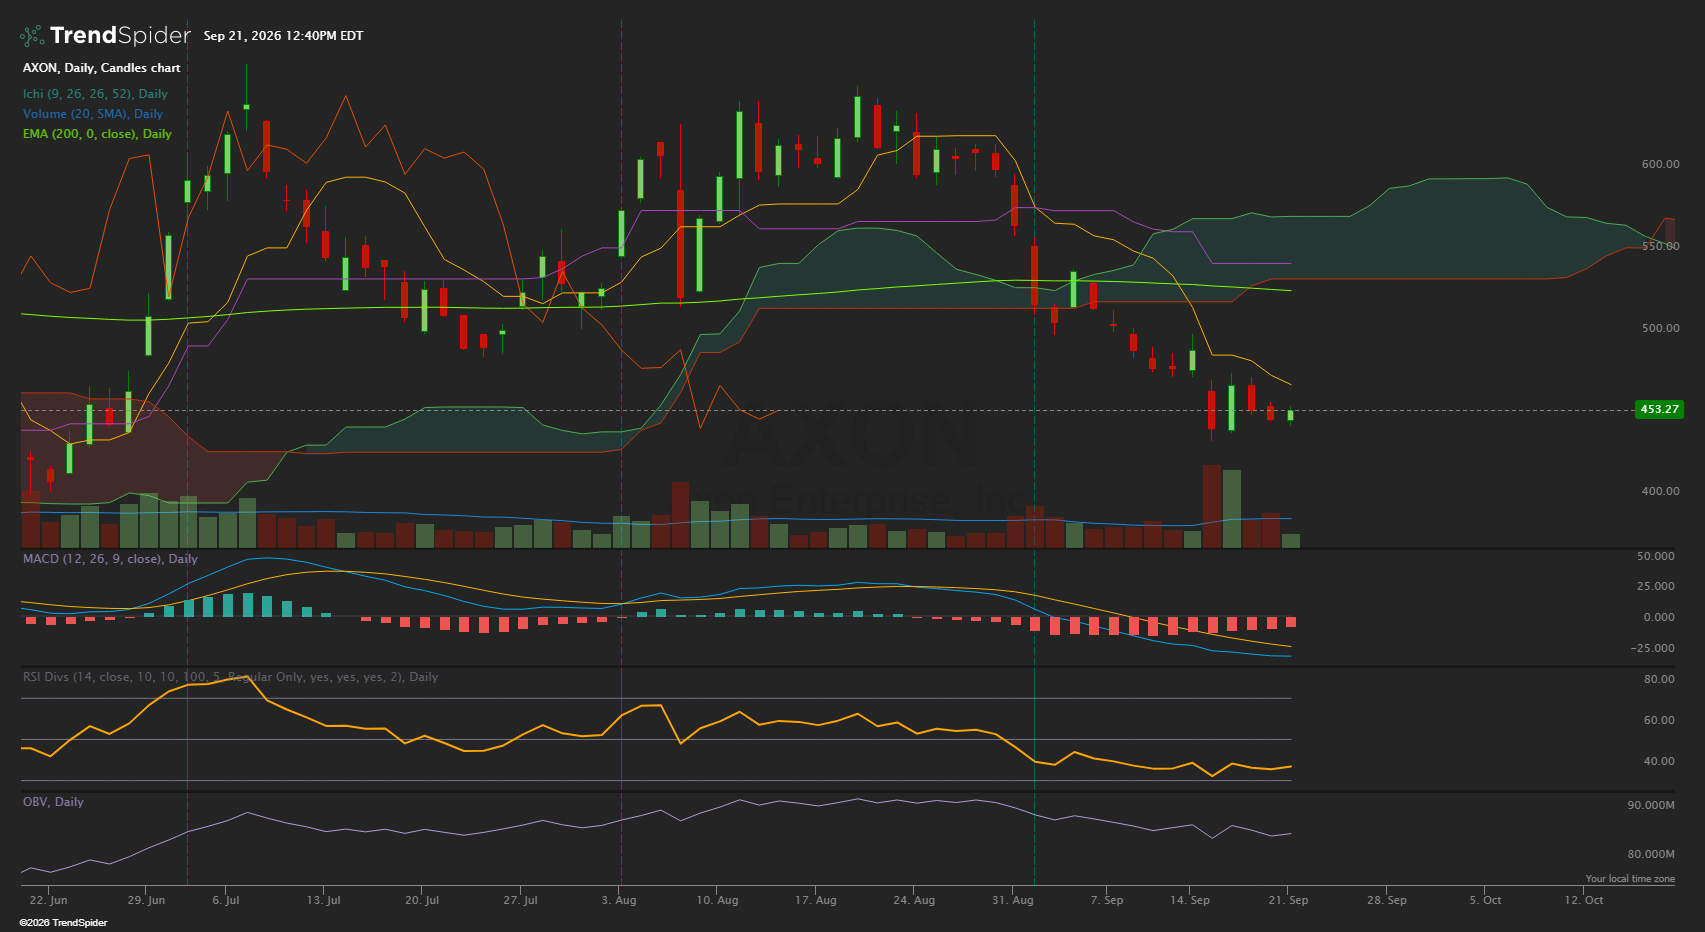
If you have not used Ichimoku, let’s take one minute on it. The cloud is a band built from past price midpoints and projected 26 sessions forward. Price above it marks an uptrend, and price below it marks a downtrend. The conversion line tracks the nine-day midpoint, the base line tracks the 26-day midpoint, and the lagging line plots today’s close 26 sessions back.
Right now every one of those signals points the same way.
Price trails the conversion line near $470, sits under the base line near $535, and hangs beneath a cloud spanning $530 to $575. It also lags the 200-day exponential average near $530 and the 200-day simple average at $503.87, while the lagging line runs far beneath where price traded in August.
The momentum gauges agree. MACD is below zero and below its signal line, RSI has flattened around 38, and on-balance volume keeps sliding. The two heaviest volume bars on the chart landed on September 15 and 16, the convertible selloff and a one-day 6% rebound that the stock gave back within two sessions.
One detail in the cloud matters for timing. Its two boundaries converge near $550 around mid-October, just ahead of the early-November earnings report, and a thin cloud is far easier for price to break through than a thick one.
So trend repair comes in two stages, and each one unlocks a tranche. Stage one arrives when the conversion line crosses back above the base line and Axon closes above its 200-day simple average on two consecutive days. Stage two needs a finish above the top of the cloud with the lagging line clear of price.
Those dollar figures will drift as the averages roll forward. The rule does not.
The long-term math, and what waiting costs
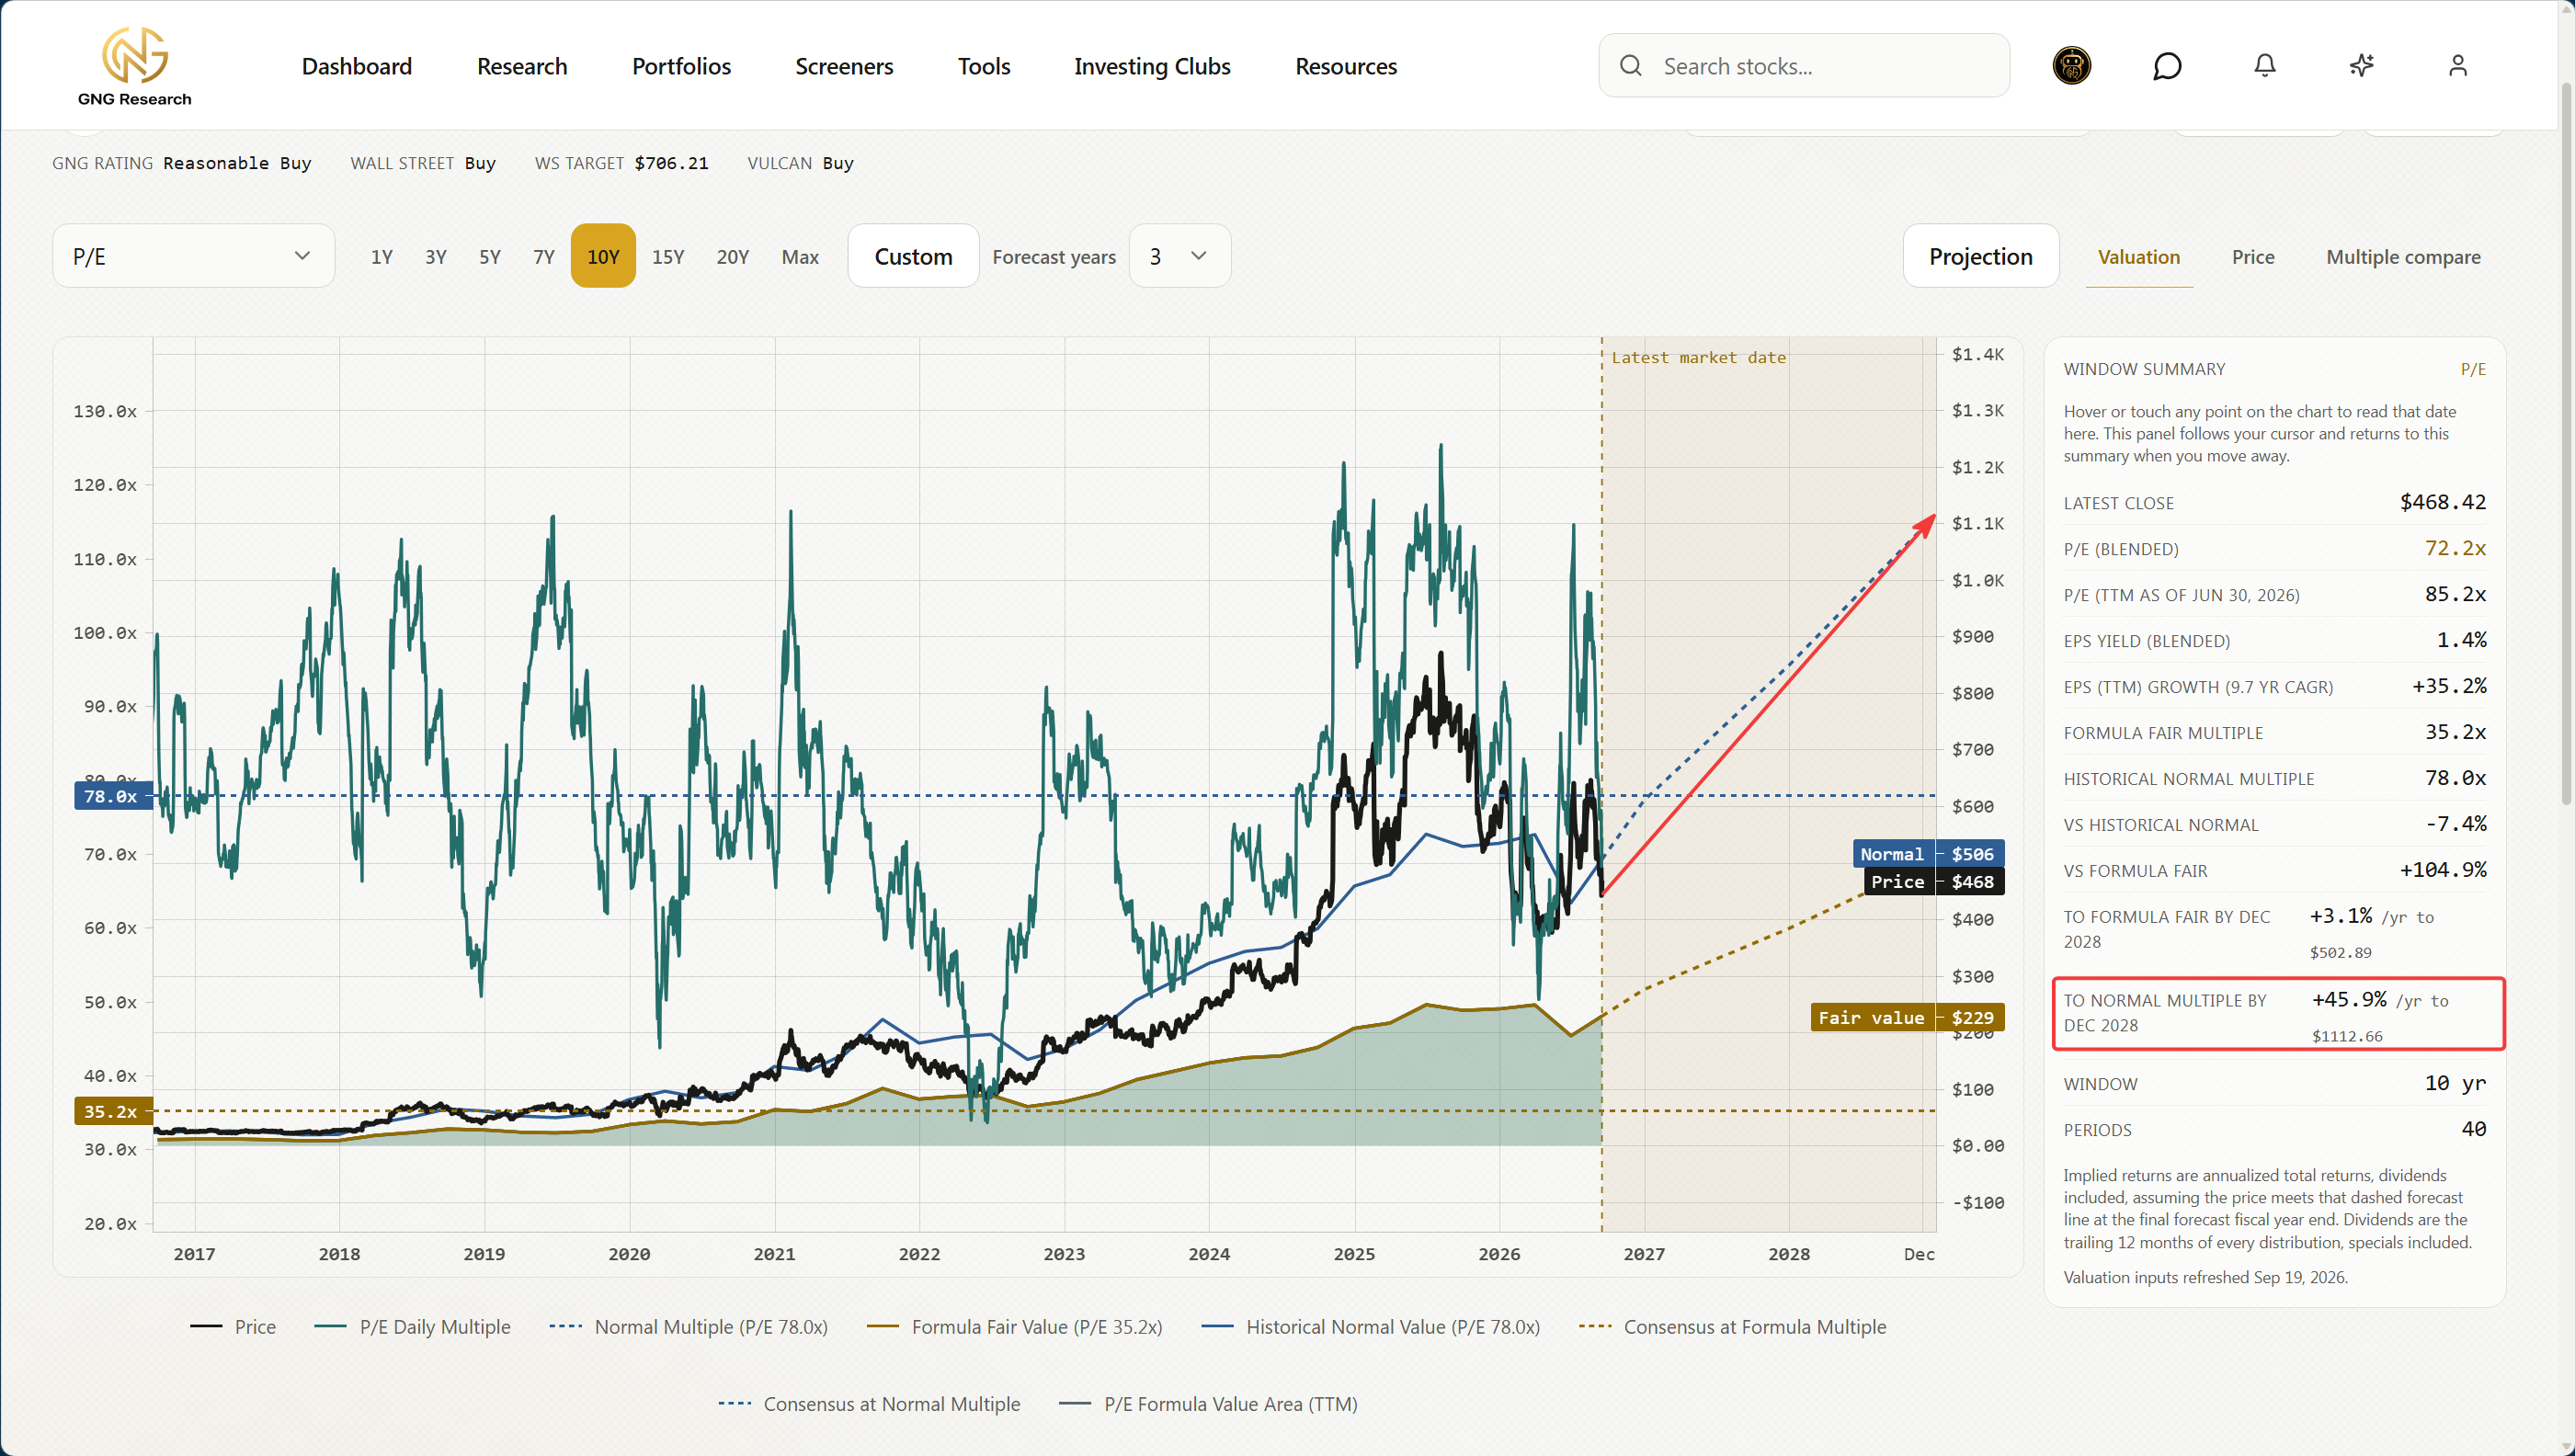
The GNG Research chart runs the same consensus earnings estimates through two multiples. At the 35.2 times formula multiple the path to December 2028 returns about 3.1% a year, and at the 78.0 times historical normal it returns about 45.9% a year. I do not lean on the 78 times case, because that multiple was set when the 10-year yield mostly sat between 1.5% and 4.5%.
Our thesis lives further out than 2028. Take the $14.18 consensus estimate for 2028 and assume growth slows to 20% for two more years, which is my assumption and not an estimate, and 2030 earnings land near $20.40. At 35 times that supports roughly $715, and at 45 times roughly $920.
From Friday’s $447.76, those outcomes are gains of about 60% and 105%. From a cloud breakout near $550, they shrink to about 30% and 67%. Waiting has a real price. I would sooner name it than pretend it away, and what it buys is the freedom from averaging into a trend that has already taken 43% off the stock.
Position size handles what timing cannot. Another 25% slide toward the $339.01 low would cost the current 1.25% starter about 0.3 points of portfolio value, while a full 4% position would give up a full point for the same move.
Five risks we are watching, with triggers
Multiple compression with no fundamental miss. At roughly 190 times trailing GAAP earnings, a move toward the 35 times formula multiple costs 30% to 40% with every estimate intact. Trigger: the 10-year Treasury sustaining above 5.25%.
Stock compensation and dilution. Compensation ran $634.2 million in 2025 and share count has compounded 3.2% a year against a target below 2.5%. Trigger: 2027 dilution running above 3%.
Free cash flow conversion. Management guides roughly $450 million for 2026 against $133 million trailing. Trigger: full-year free cash flow below $350 million, which would make the working capital drag structural.
Cloud growth deceleration. The software mix shift carries the whole margin story. Trigger: software and services growth below 20%, or net revenue retention below 115% from 126%.
Budget and appropriation exposure. Customers carry non-appropriation clauses, and federal award obligations of $111.5 million are 53.7% concentrated in one department. Trigger: contracted bookings growing below 20% year over year, down from 40%.
The plan for the model portfolio
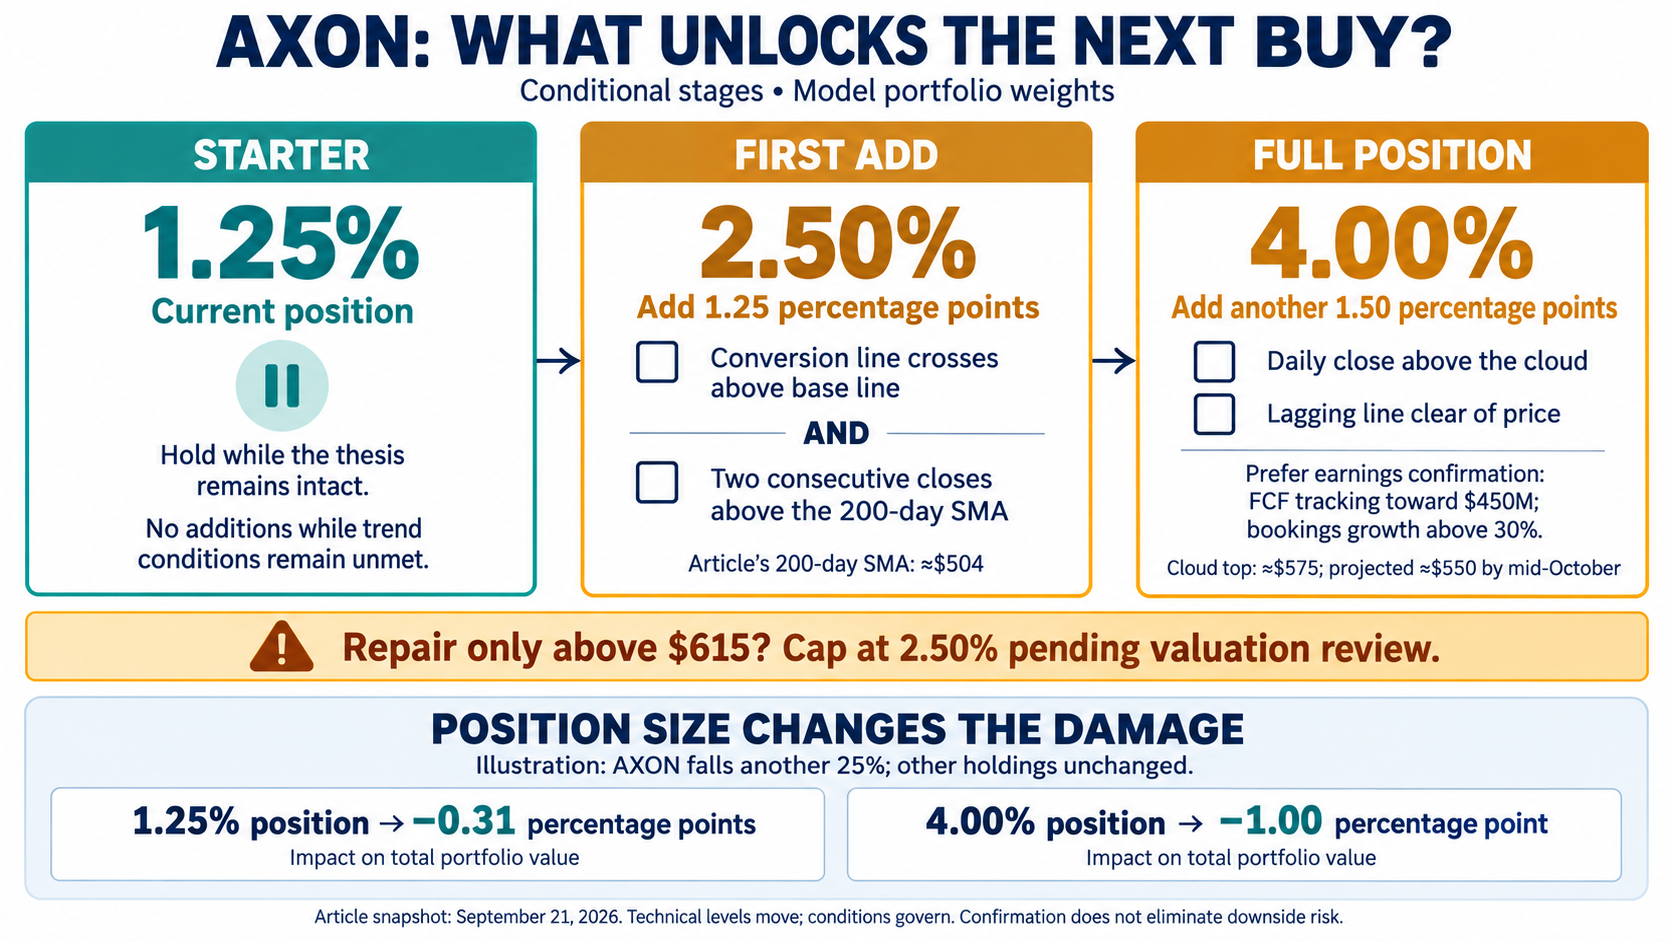
The 1.25% starter stays. No shares get added below trend, including at the Vulcan Strong Buy level of $394, because a cheaper price inside a downtrend is still a downtrend. Stage one repair takes the position to 2.5%. On today’s chart that means the faster line crossing over the slower one and two closes above the 200-day simple average near $504, about 12.5% over Friday’s close.
Stage two takes it to the full 4% once Axon settles above that band, currently near $575 and projected near $550 by mid-October. I would like the early-November report in hand first, showing free cash flow tracking toward $450 million and bookings still growing above 30%. If a strong report gaps the stock straight through the cloud, both tranches can go in that week.
There is a tension here worth stating plainly. The 12-month Vulcan ladder marks $541 as a trim level, so the final tranche may land above it. That ladder values twelve months of cash flow while this position underwrites 2028 and beyond, and the fair value will be re-run after the November report with 2027 as the forward year. If the repair only arrives above $615, our too-expensive line, the position stops at 2.5% until that re-run.
What ends the thesis is narrower than a bad quarter. Software and services growth under 20%, retention below 115%, or 2027 earnings guided below roughly $9.00 would each mean the compounding has broken, and I would sell the starter instead of adding.
GNG Research Pro subscribers can follow the position in the Growth IRA model portfolio at https://www.gngresearch.com/portfolio/model/9da32c39-969c-4b61-bab0-96ab4d9649dd/. In your notifications section of your profile you can also get notified on all buy/sell transactions.
We own the business we want, at a size the chart has earned. The chart decides when it earns more.
Master metrics table
| Metric | Value | Metric | Value |
|---|---|---|---|
| Close (Fri Sep 18, 2026) | $447.76 | Market cap | $36.1B |
| Model position (Growth IRA) | 1.25% | Target weight | 4% |
| Revenue TTM | $3,219M (+34.6%) | Q2-26 revenue | $904M (+35%) |
| FY26 revenue guidance | 32% to 34% growth | Future contracted bookings | $15.1B (+40%) |
| Annual recurring revenue | $1.6B (+39%) | Net revenue retention | 126% |
| 2028 revenue target | ~$6B | 2028 adj. EBITDA margin target | ~28% |
| 2028 adj. FCF conversion target | 60% of adj. EBITDA | Annual SBC dilution target | Below 2.5% |
| Consensus adj. EPS 26E/27E/28E | $7.62 / $10.51 / $14.18 | 5-year consensus EPS growth | ~30% a year |
| Trailing GAAP P/E | ~190x | Price / 2028 consensus EPS | ~32x |
| FCF TTM | $133M (0.35% yield) | FY26 FCF guidance | ~$450M |
| Stock compensation FY25 | $634.2M | Share count CAGR 3Y | +3.2% |
| ROIC | 4.4% | Greenwald EPV | ~$95 |
| Convert conversion price | $652.06 | Capped call ceiling | $1,049.94 |
| Ichimoku conversion / base line | ~$470 / ~$535 | Cloud (Sep 21) | ~$530 to $575 |
| 200-day SMA / EMA | $503.87 / ~$530 | RSI (14) | ~38 |
| Stage 1 add (to 2.5%) | TK cross plus 2 closes above 200-day SMA | Stage 2 add (to 4%) | Daily close above cloud |
| BFV blended (12-month) | $492 | Vulcan rating | HOLD |
| Strong Buy / Trim / Too expensive | $394 / $541 / $615 | Next earnings | Early November 2026 |
References
Company sources: Axon Enterprise fourth-quarter 2025 results and 2028 target model (February 24, 2026), second-quarter 2026 results and presentation (August 5, 2026), fiscal 2025 annual report, second-quarter 2026 quarterly report, and current reports covering the September 2026 convertible note announcement and pricing. All retrieved from SEC EDGAR.
Market and macro data: Federal Reserve H.15 selected interest rates and Federal Reserve Bank of St. Louis series DGS10, as of September 18, 2026.
Ichimoku daily chart: TrendSpider, AXON daily candles with Ichimoku cloud, September 21, 2026.
Valuation window and consensus projection chart: GNG Research charting tool, AXON, ten-year window, inputs refreshed September 19, 2026, at gngresearch.com/charting?symbol=AXON&metric=eps&window=10y. Forward estimates are crowd-sourced consensus data from Finnhub.
Supplementary forward earnings chart: FAST Graphs, AXON adjusted operating earnings, September 18, 2026.
Fundamental data, pillar scores, valuation ladder and model portfolio: GNG Research database, the Vulcan MK5 model and the GNG Research Growth IRA model portfolio.
Competitive reporting: company disclosures from Motorola Solutions for the second quarter of 2026, plus national, local and municipal council records on plate-reader contract transitions during August and September 2026.
Treat everything here as research and analysis, not as personalized investment advice. Do your own work before buying anything.

 Vulcan Stock Research
Leave a comment