
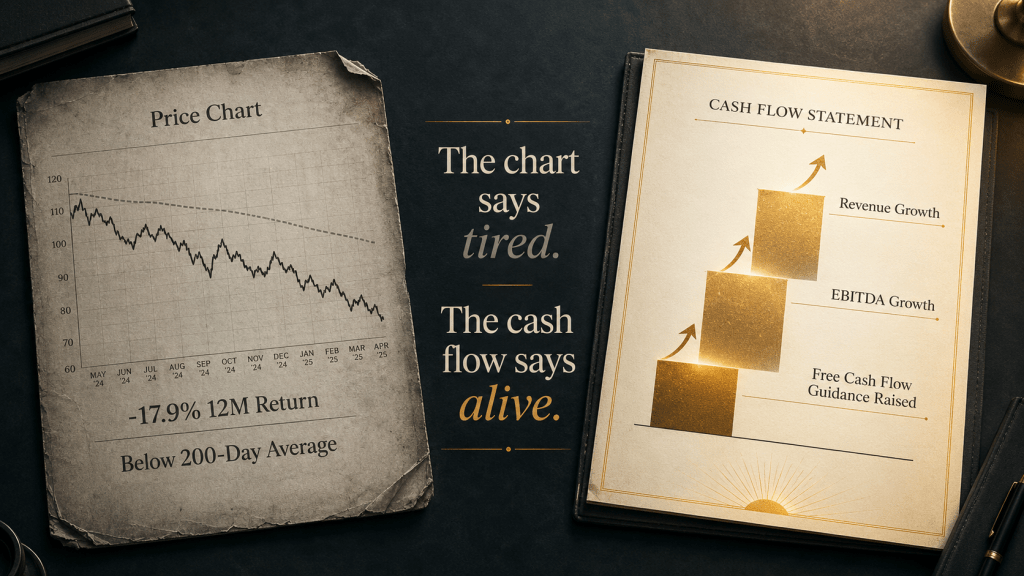
If I handed you only the price chart, you would close the book on this one. T-Mobile (TMUS) is down roughly 19% over the past year, it trades about 10% under its 200-day moving average, and the tape has given it no sponsorship since late winter. The cover looks worn. Buyers have walked past it on the shelf for months.
Then you open it, and the pages read like a different book. The late-April quarter strengthened the case rather than weakening it, and management raised its own 2026 outlook on the strength of what it saw. That gap between the cover and the pages is the entire setup here. Most of the market is reading the chart and grading the stock on it. The Vulcan work starts somewhere else, with the cash-flow statement. When the chart and the cash disagree this sharply, I put my money on the cash.
What the worn cover actually shows
I won’t pretend the cover is fine, because it isn’t. The stock changed hands above $258 inside the past year and now sits near $191, a drawdown deep enough to wear out both the momentum crowd and a good number of patient holders. The 200-day average sits at $213, the 50-day at $199, and price trades below both. The 14-day RSI near 47 reads neutral rather than oversold, so there is no obvious technical spring loaded under this thing.
A worn cover scares off most buyers. The momentum crowd needs a trend, and there isn’t one here worth riding. Income buyers want a payout that clears a 10-year Treasury, and a 2.0% dividend falls short of that. What’s left is a smaller group, the buyers willing to look past the cover and underwrite the contents, and that is the seat Vulcan tends to take.
None of this means the cover is lying. It is reporting real things: a broken trend, a year of underperformance, and a market that has decided wireless is boring. It simply isn’t reporting the part that matters most to anyone who plans to own the business for longer than a quarter.
The pages the market skipped
Here is what that late-April quarter actually printed on the page. Postpaid net account additions came in at 217,000, up 6% from a year earlier, and postpaid average revenue per account reached $151.93, up 3.9%. Service revenue grew 11% to $18.8 billion, postpaid service revenue grew 15% to $15.6 billion, and broadband net additions topped 500,000, which keeps the company among the fastest-growing internet providers in the country. That last figure matters because the growth here is not only about phones.
The cash engine is the real headline. Core adjusted EBITDA rose 12% to $9.2 billion, operating cash flow rose 5% to $7.2 billion, and adjusted free cash flow rose 5% to $4.6 billion. The company returned $6.0 billion to shareholders in the quarter, $4.9 billion of it through buybacks and $1.1 billion through dividends. Reported earnings per share did fall 12% to $2.27, but the release is explicit that the figure absorbed $476 million of accelerated depreciation and other costs tied to the UScellular merger. Strip out that one-time noise and the cash lines are the cleaner read on what the business is doing.
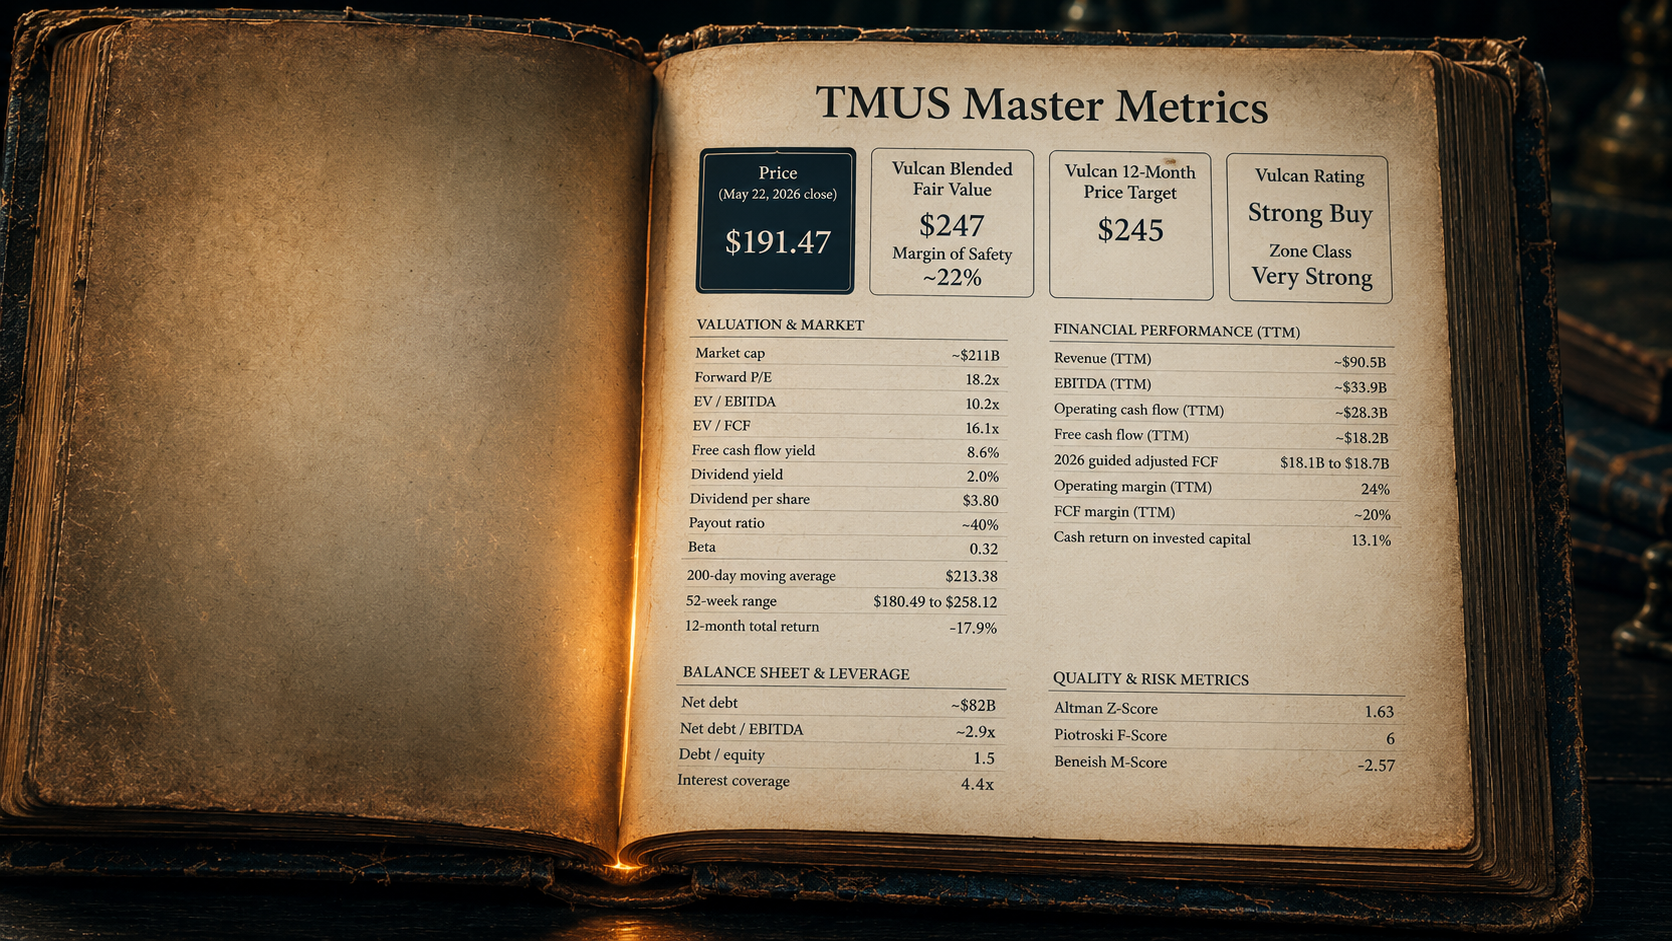
Then management did the thing a genuinely tired telecom does not do. It raised guidance. The 2026 outlook now calls for 950,000 to 1.05 million postpaid net account additions, core adjusted EBITDA of $37.1 billion to $37.5 billion, capital spending held near $10 billion, and adjusted free cash flow of $18.1 billion to $18.7 billion. On a trailing basis, the GNG Research terminal already shows about $90.5 billion in revenue, $33.9 billion of EBITDA, $28.3 billion of operating cash flow, and $18.2 billion of free cash flow, with an FCF margin near 20% and cash return on invested capital around 13%.
There is also a layer sitting above the reported numbers worth naming, even though I won’t underwrite it inside the fair value. The company has been signing fiber partnerships, scaling broadband, leaning into its own app ecosystem for customer engagement and advertising, and positioning its 5G network for edge computing and enterprise work. None of that belongs in a conservative cash-flow model yet, and I have left it out of mine. It is genuine optionality all the same, and optionality is worth more when you are buying the base business near a utility multiple.
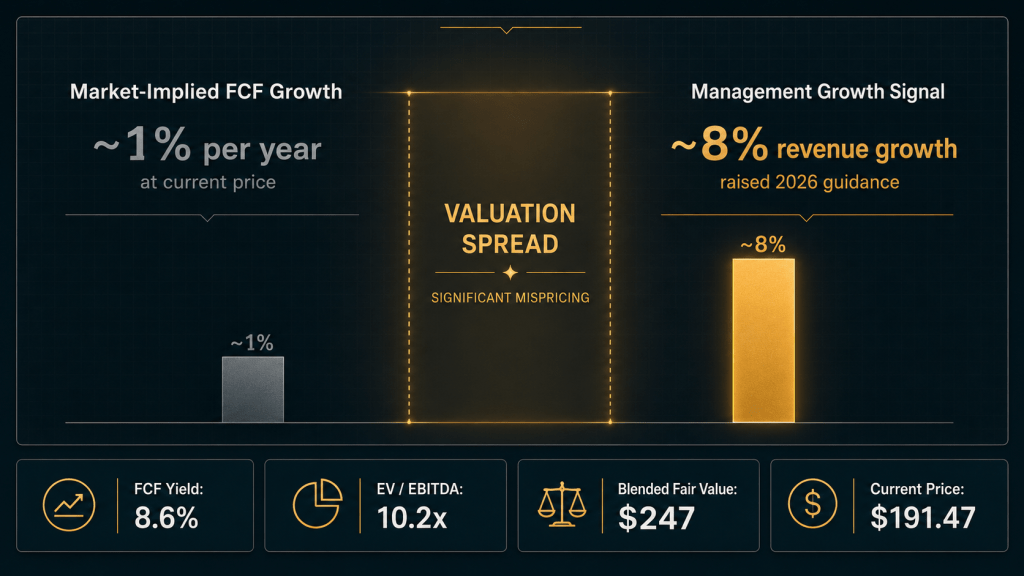
Now put a price on those pages. At $191, the stock trades for roughly 11 to 12 times this year’s guided free cash flow, the whole enterprise carries an EV near 10 times EBITDA, and the shares throw off an 8.6% free cash flow yield. That is utility pricing on a business still adding accounts, growing revenue, and converting both into cash. The reverse discounted cash flow makes the gap concrete. At an 8.5% cost of capital, today’s price only needs the company to grow free cash flow about 1% a year over the next five years. Management is guiding to service revenue growth near 8% in 2026 alone. So you are paying a near-zero-growth price for a company that just told the market it expects to keep growing.
Why I read this as a Strong Buy
Vulcan’s official rating here is Strong Buy, and the reasoning carries as much weight as the label. This is a valuation-driven Strong Buy rather than a pristine-quality one. The blended fair value lands at $247, which puts margin of safety near 22% and a twelve-month price target around $245. Independent fair value estimates cluster in the $235 to $240 range, and the average analyst target sits near $261, so the upside case is not a lonely one.
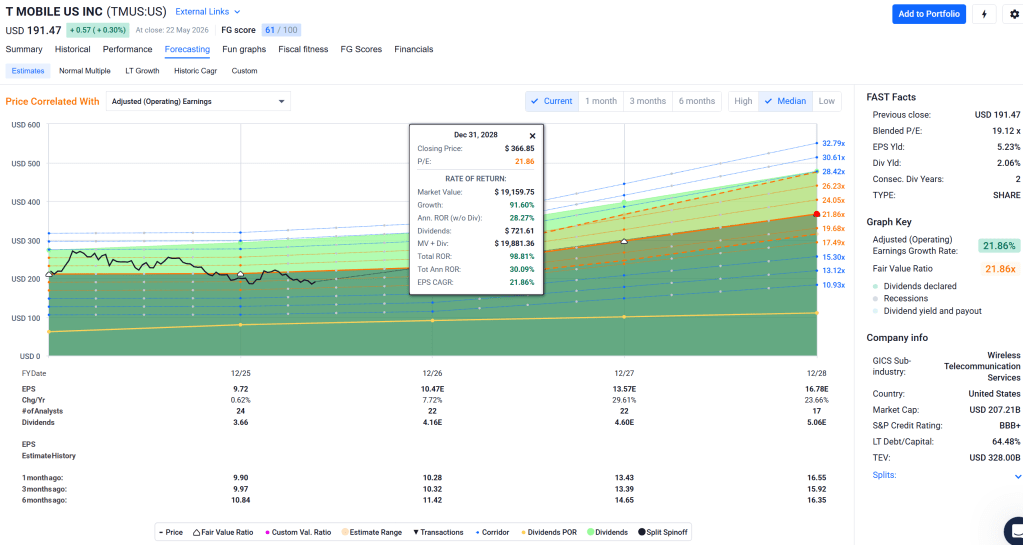
I want to be precise about what the rating is not. T-Mobile does not clear Vulcan’s quality-compounder shortcut, the pathway reserved for stocks with top-decile quality and safety scores trading above their 200-day trend. Quality and safety here sit in the high 70s and low 80s, and the trend is broken, so that door stays shut. The Strong Buy comes through the value door instead, built on durable free cash flow, returns sitting comfortably above the cost of capital, and a margin of safety above 20%. One housekeeping note for transparency. The terminal’s own headline fair value of $337.64 runs far above Vulcan’s $247, and its quant score reads only Hold. Vulcan treats those terminal labels as context and excludes them from the official math, so the $247 fair value and the Strong Buy rating both come out of the conservative cash-flow work rather than that higher screen reading.
The peer screen sharpens the point rather than blurring it. On simple multiples and headline yield, Verizon (VZ) and AT&T (T) screen cheaper, and Comcast (CMCSA) screens statistically cheap on free cash flow. Cheap and improving are not the same thing, though. T-Mobile carries the better organic wireless growth profile of that group, stronger account and ARPA momentum, and a notably low beta near 0.3, which has kept its swings milder than the broad market even through this drawdown. Charter (CHTR) screens cheaper still, and it pairs that discount with materially heavier leverage and uglier recent drawdowns. T-Mobile is not the cheapest telecom on every metric. Within wireless specifically it offers the strongest growth alongside solid cash conversion and a steady capital-return program, and that combination is what the valuation work is really paying for.
The chapter that genuinely runs heavy
Every honest book has a hard chapter. For T-Mobile it is the balance sheet, and I won’t soften it.
The leverage is the core of that chapter. Net debt sits near $82 billion, which the terminal measures at roughly 2.9 times EBITDA, debt to equity runs about 1.5, and the Altman Z-Score reads 1.63. On the original Altman scale, any reading under 1.81 falls in the band the model tags as distress, so 1.63 sits inside that band. That scale was built for manufacturers and routinely penalizes capital-heavy carriers, so I treat the number as a yellow flag rather than a red one. Even discounted that way, the debt is real, and it is the single biggest reason the quality rating cannot climb higher.
The broken trend is its own risk, not merely a cosmetic flaw on the cover. A stock trading 10% under its 200-day average can keep drifting, and a retest of the $180 area, the floor of the past year, is plausible if the broad tape weakens. Integration risk stacks on top of that, since the UScellular deal keeps feeding accelerated depreciation and merger costs through the income statement, and acquisitions of that size slip more often than spreadsheets assume.
Competition does not rest either. Verizon (VZ) and AT&T (T) keep fighting for the same postpaid customers, cable operators rent wireless capacity to undercut on price, and aggressive promotions could squeeze the ARPA growth line that makes the whole model work. The case for per-share growth also leans on repurchases. The company spent $4.9 billion on buybacks in the first quarter alone, and a real part of free cash flow per share growth depends on that program continuing at scale. If leverage targets force it to slow the buyback, the per-share math gets softer, and the multiple re-rating this thesis hopes for may not arrive at all.
How I’d actually buy it
The contents justify owning T-Mobile, and the beaten-up cover is the reason I would build the position in stages rather than in a single purchase.
The stock already sits inside Vulcan’s Very Strong zone, which runs at or below $198. I would put the first tranche to work near the current $191, hold a second tranche for roughly $185, and keep a third in reserve for the $175 to $180 area if the market hands it over. I would not chase above the Strong Buy line of $223, and the Trim flag does not appear until $296. Position sizing stays disciplined. This is a 1% to 2% name, not a core anchor, because the leverage earns it a smaller seat than a fortress balance sheet would.
My invalidation triggers are specific. I would step back if management cuts the free cash flow or EBITDA guide, if net leverage climbs back toward 3.2 times EBITDA, or if another quarter passes with the stock still below its 200-day average while ARPA or account growth rolls over at the same time. Any one of those rewrites the thesis. Until one of them triggers, this is the kind of setup I want to be accumulating into: a depressed price sitting on top of genuinely strong cash generation.
For disclosure, I do not own T-Mobile (TMUS) as I write this. My read is straightforward. The market re-reads a company once the cash keeps showing up quarter after quarter, and while that re-read plays out the buyer here collects a 2% dividend and an ongoing buyback. Everyone has already seen the chart. Far fewer people have sat down with the cash-flow statement, and that statement is the real reason to own this one.
Sources and notes
- Q1 2026 operating results and the raised 2026 guidance are drawn from the T-Mobile US first quarter 2026 earnings release and earnings call, reported in late April 2026.
- Fundamental metrics, the fair value framework, scoring, and action zones come from the GNG Research terminal and the Vulcan-mk5 model.
- Price reflects the May 22, 2026 close. Blended fair value $247, margin of safety about 22%, official rating Strong Buy, zone class Very Strong.
- Image concepts: Vulcan Stock Research.

 Vulcan Stock Research
Leave a comment