
Published: March 2, 2026 | Mode: AI Infrastructure Compounder | Rating: Accumulate on Pullbacks
Walk into any AI data center today and you will find row upon row of GPU clusters, each chip worth tens of thousands of dollars, each rack consuming as much electricity as a suburban home. The headlines celebrate the silicon designers. The investors pile into the chipmakers. But here is the part nobody talks about at the dinner table: those GPUs are worthless if they cannot talk to each other fast enough. And the thread that connects them, literally and figuratively, runs straight through a precision manufacturing campus in Chonburi, Thailand, operated by a company most retail investors have never heard of.
Fabrinet (FN) does not design chips. It does not build data centers. It does something harder: it manufactures the optical transceivers, cables, and components that let those GPU clusters communicate at the speed of light. Without Fabrinet’s products, the AI arms race stalls. That is the thesis in one sentence.
But here is the contradiction that makes this stock genuinely difficult to own: Fabrinet is growing faster than almost any name in my coverage universe, yet its free cash flow looks like a company treading water. That gap between explosive revenue growth and thin near-term cash generation is the entire story. Get comfortable with it and you have a conviction position. Flinch at the wrong moment and the market will take it from you at a discount.
What Fabrinet Actually Does (And Why It Is So Hard to Copy)

Think of Fabrinet (FN) as the master glassblower of the digital age. While a standard electronics assembler can solder circuit boards by the millions, optical packaging requires aligning hair-thin laser arrays and fiber strands to tolerances measured in fractions of a human hair. One micron off and the signal dies. This process takes place in cleanroom environments, demands years of process refinement, and cannot be replicated by importing a generic production line from a commodity manufacturer.
Fabrinet has spent more than two decades building this capability. Its customers, who include the largest hyperscalers and networking companies on earth, cannot simply pick up and move production. The re-qualification process alone takes 12 to 18 months. In a race where being six months late to a new optical standard means losing a major contract, switching away from Fabrinet carries a cost that far exceeds any margin savings a competitor might offer.
This is what I call a “sticky moat” backed by process, not patents. Process moats are harder to see on a balance sheet, but they are also harder to break. And in the AI infrastructure buildout, where every thread of optical bandwidth matters, that stickiness is worth more than it has ever been.
The Numbers Behind the Story
Fabrinet’s financial health is an anomaly for a contract manufacturer. The company operates with zero long-term debt (Debt/Equity: 0.0x), self-funding aggressive capacity expansions entirely from operating cash flow. While peers in the electronics manufacturing services space carry significant leverage, Fabrinet’s balance sheet reads like a software company’s.
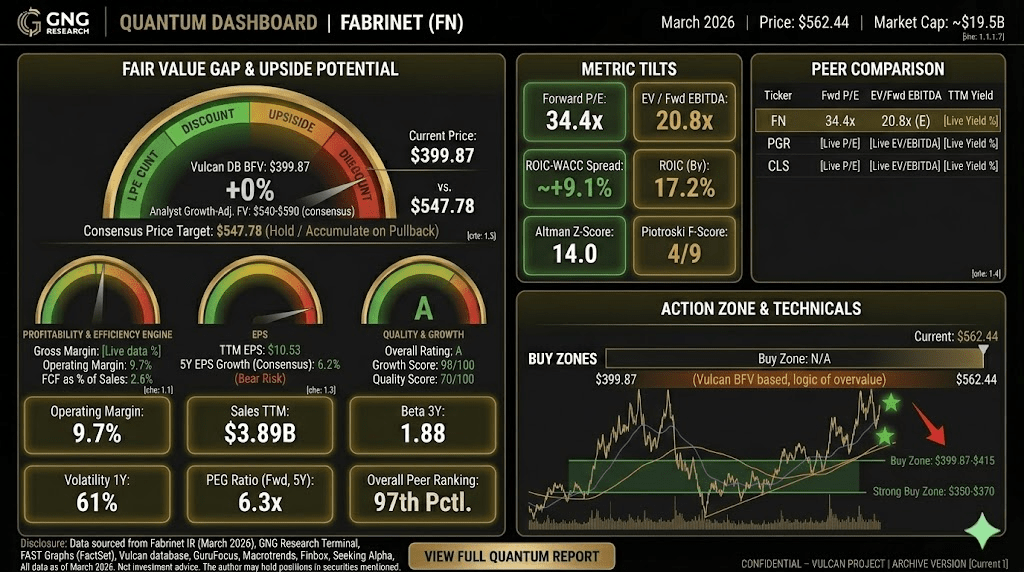
Return on Invested Capital sits at 17.2%, exceptional for a business with sub-13% gross margins. That ROIC number is the signature of a company with genuine pricing power and operational discipline, not one chasing volume at the expense of returns. The Altman Z-Score of 14.0 places it in the near-zero bankruptcy risk category.
The Vulcan database rates Fabrinet at the 97th percentile overall vs. peers, with a Growth Score of 98 reflecting the explosive revenue acceleration underway. TTM revenue stands at approximately $3.89 billion, and management’s forward guidance puts the company on track for a $4.6 to $4.8 billion annualized run rate, driven almost entirely by the surge in AI data center optical demand.
Now here is the tension I flagged at the top: despite all that growth, free cash flow as a percentage of sales is just 2.6% ($2.81 per share TTM). Fabrinet (FN) is plowing capital into capacity builds at a pace that temporarily suppresses reported free cash flow. You are not buying a cash machine today. You are buying the machine that will become a cash machine once AI infrastructure capex stabilizes. I am comfortable with that tradeoff because the balance sheet gives them the runway to make it work without issuing a single share of debt. But if that distinction makes you uneasy, this is not your stock, and that is a perfectly reasonable conclusion.
The 800G Supercycle and Why the Timing Matters Now
The transition from 400G to 800G optical transceivers is not a gradual upgrade cycle. It is a step-function demand event. When AI clusters scale from thousands of GPUs to hundreds of thousands, the interconnect bandwidth requirements do not scale linearly; they scale exponentially. Every new cluster needs more threads, thicker threads, faster threads. The move toward co-packaged optics, where optical components are integrated directly onto the network switch, requires the kind of precision manufacturing that Fabrinet’s glassblowers have refined for decades.
Fabrinet’s major customers are not diversifying away from this dependency. They are deepening it. The company is in the middle of a multi-year capacity expansion that positions it as the primary beneficiary of every dollar spent on next-generation AI networking infrastructure. The bull case is not speculative. The purchase orders exist. The question is execution velocity.
The Valuation Reality: Two Numbers Pulling in Opposite Directions
Here is where discipline separates investors from speculators.
The Vulcan unified database carries a mechanical fair value of $399.87. At a last recorded close of $562.44, that implies the stock is trading at a 27% premium to the model’s baseline estimate. The forward P/E stands at 34.4x with a PEG ratio of 6.3x based on the five-year consensus EPS growth estimate of just 6.2%. On these metrics alone, the stock is not cheap by any conventional measure.
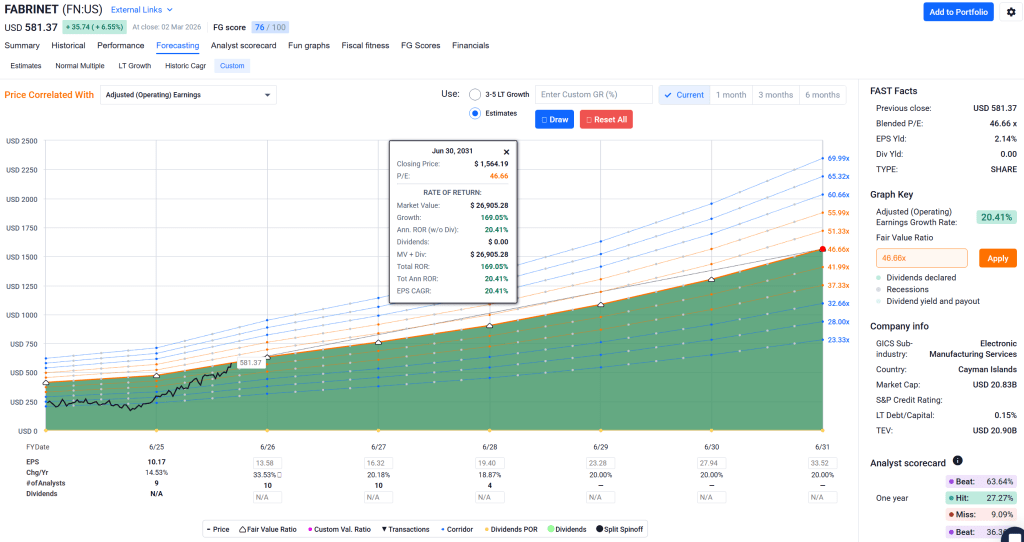
The growth investor’s rebuttal: consensus is systematically underestimating Fabrinet’s earnings trajectory. Management’s Q3 fiscal 2026 guidance implied earnings per share well above the consensus model, continuing a pattern of analyst underestimation that has characterized the stock for multiple years. Applying a forward multiple consistent with the actual growth rate being realized (rather than the long-run consensus estimate) generates a blended analyst-adjusted fair value in the $540 to $590 range, near where the stock currently trades.
This is a genuinely difficult valuation. The stock is priced for flawless execution of an AI infrastructure supercycle thesis. There is no margin of safety buffer if that thesis slows. I still want to own it, but I want to own it at the right price, which means patience and staged entries rather than chasing.
Five Risks You Need to Quantify Before Buying
1. Customer concentration. Fabrinet’s top three customers represent an estimated 60%+ of revenue. A single sourcing decision by one hyperscaler, or a lull in their capex cycle, creates an immediate revenue air pocket. At a 34x forward multiple, even a 10% revenue miss would likely produce a 25 to 35% stock correction. This is the risk that could snap the thread overnight.
2. Consensus EPS growth of only 6.2% over five years. The Vulcan database consensus estimate for five-year EPS growth is 6.2%, dramatically below the near-term acceleration narrative. If AI infrastructure spending normalizes sooner than expected, earnings growth could mean-revert toward that long-run estimate quickly.
3. Thin free cash flow during the build phase. FCF is 2.6% of sales right now. Capacity expansion costs are real. If a demand plateau arrives before Building 9 fills up, Fabrinet will be carrying a large fixed-cost base against flattening revenue. Operating margins sit at 9.7%; there is limited cushion. This is the core bet: you are underwriting that the cash conversion improves as capex normalizes. If it does not, the stock re-rates lower.
4. High beta and volatility. Beta of 1.88 against a 1Y realized volatility of 61% means this stock routinely moves 15 to 20% on earnings reactions. Position sizing must account for that. A 3% portfolio position in FN carries the behavioral risk of a 6 to 8% position in a lower-beta stock during volatile markets.
5. Earnings quality watch. The Beneish M-Score of -1.97 is above the -2.22 theoretical safe threshold, flagging a mild earnings quality signal worth monitoring. This does not indicate manipulation; it reflects the pressure of rapid revenue scaling on accruals. Watch the working capital trends in coming quarters.
The Action Plan: Three Zones, One Discipline
The stock closed recently at $562.44 with an RSI of 56 and a price approximately 40% above its 200-day moving average. It is not technically extended, but it is priced for continued delivery.
Zone 1 (Hold / Trim): $555 to $620. If you own it, hold it and let the AI networking thesis play out. Trim 10 to 15% into strength above $610 to harvest gains and right-size the position. Do not add at these levels unless you are underweight.
Zone 2 (Accumulate): $480 to $520. A 10 to 15% pullback brings the stock back toward near-term moving average support. This is the buy zone for staged entry, 50% of a full position. Invalidation: if a major customer announces dual-sourcing or a capex slowdown, do not buy the dip.
Zone 3 (Strong Buy): Below $430. A reset toward the 200-day moving average would represent a generational entry point if the AI optical networking thesis remains intact. Full position. Add aggressively.
Position sizing guidance: Given the 1.88 beta and 61% volatility, a maximum of 2 to 3% of portfolio at full position is appropriate for most risk profiles. This is not a conservative holding; size it accordingly.
The Final Word
Every data center being built right now depends on optical threads that Fabrinet manufactures better than anyone else on earth. The precision is irreplaceable. The balance sheet is pristine. The demand curve has years of runway. What you have to accept in exchange is a company spending aggressively into that demand, which means thin free cash flow today for the promise of significant cash generation tomorrow.
I am watching this one closely and building a position on weakness. The thread connecting AI’s ambitions to physical reality runs through Chonburi, and I want to own the company that spins it.
Set alerts at $510. Let the market bring you the entry.
Verdict: Active Accumulate on Weakness. Core AI Infrastructure Position.
Master Metrics Table (March 2026)
| Metric | Value | Signal |
|---|---|---|
| Price (Recent Close) | $562.44 | Hold / Accumulate on Pullback |
| Market Cap | ~$19.5B | Mid-to-Large Cap |
| Forward P/E | 34.4x | Elevated; growth-justified |
| PEG Ratio (Fwd, 5Y) | 6.3x | Expensive on consensus |
| TTM EPS | $10.53 | Accelerating |
| ROIC | 17.2% | Elite for EMS sector |
| Debt / Equity | 0.0x | Fortress balance sheet |
| Operating Margin | 9.7% | Stable; volume-dependent |
| FCF as % of Sales | 2.6% | Thin; capex build phase |
| Altman Z-Score | 14.0 | Near-zero bankruptcy risk |
| Piotroski F-Score | 4/9 | Moderate; monitor |
| Beta 3Y | 1.88 | High; size accordingly |
| Volatility 1Y | 61% | Significant drawdown risk |
| Consensus Price Target | $547.78 | Near current price |
| Vulcan DB Fair Value | $399.87 | -27% MoS at current price |
| Analyst Growth-Adj. FV | $540-$590 | Near fair value |
| Overall Peer Ranking | 97th Pctl. | Top tier vs. peers |
| Growth Score | 98/100 | Exceptional |
| Quality Score | 70/100 | Above average |
| 5Y EPS Growth (Consensus) | 6.2% | Key bear risk |
| TTM Revenue | $3.89B | Accelerating |
Sources: Vulcan Unified Database, GNG Research Platform. All data as of March 2026. Not investment advice. The author may hold positions in securities mentioned.


Leave a comment