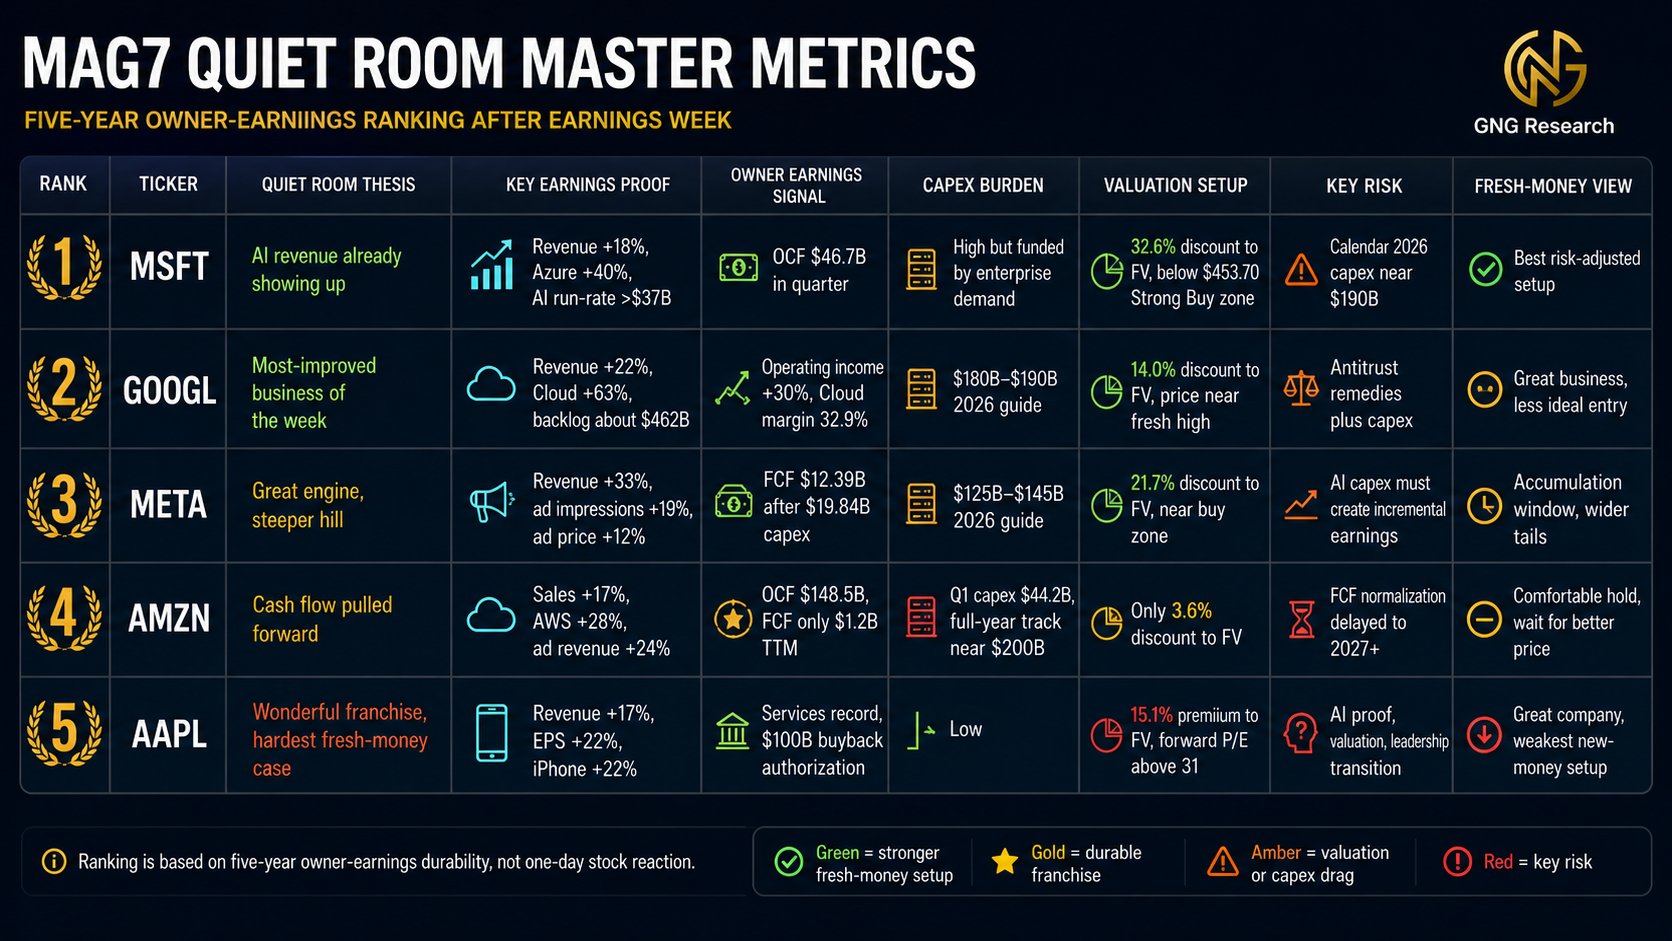
- Microsoft ranked #1, Q3 revenue $82.9B (+18%), operating income $38.4B, Cloud $54.5B (+29%), AI run-rate $37B (+123%), 2026 capex ~$190B, stock $414.40, Vulcan flags ~32.6% discount to fair value
- Alphabet ranked #2, Q1 revenue $109.9B (+22%), operating income $39.7B, EPS $5.11, Cloud $20B (+63%) with ~$462B backlog, 2026 capex $180-190B, stock near 52-week high, ~14% discount, antitrust overhang persists
- Meta ranked #3, Q1 revenue $56.31B (+33%), operating income $22.87B, ad impressions +19% and price +12%, OCF $32.23B, FCF $12.39B after $19.84B capex, 2026 capex guide $125-145B, funded with $25B bond sale
- Amazon ranked #4, high-quality franchise but still pulling owner cash forward via heavy reinvestment, business merits long-term hold but expect deferred owner returns and limited appeal for fresh capital today
- Apple ranked #5, posted a strong report and popped, but valuation makes fresh-money allocation difficult for a five-year buy-and-hold, prefer to wait for a better entry rather than add at current levels
Why I’m Reading This Earnings Week Differently
Five Magnificent Seven names reported earnings inside seven trading days. (MSFT), (GOOGL), (META), and (AMZN) reported on April 29. (AAPL) capped the week on April 30. The combined market cap reaction was all over the map: Alphabet ripped to a fresh high, Meta got punished, Microsoft drifted, Amazon held its ground, and Apple popped on a strong report.
That kind of noise is exactly when I find Warren Buffett useful. Buffett’s owner manual at Berkshire Hathaway has always argued that quotes are a service, not a verdict. He’s said it a hundred ways. “Our favorite holding period is forever,” he wrote in his 1988 shareholder letter. “It’s far better to buy a wonderful company at a fair price than a fair company at a wonderful price,” he added the next year.
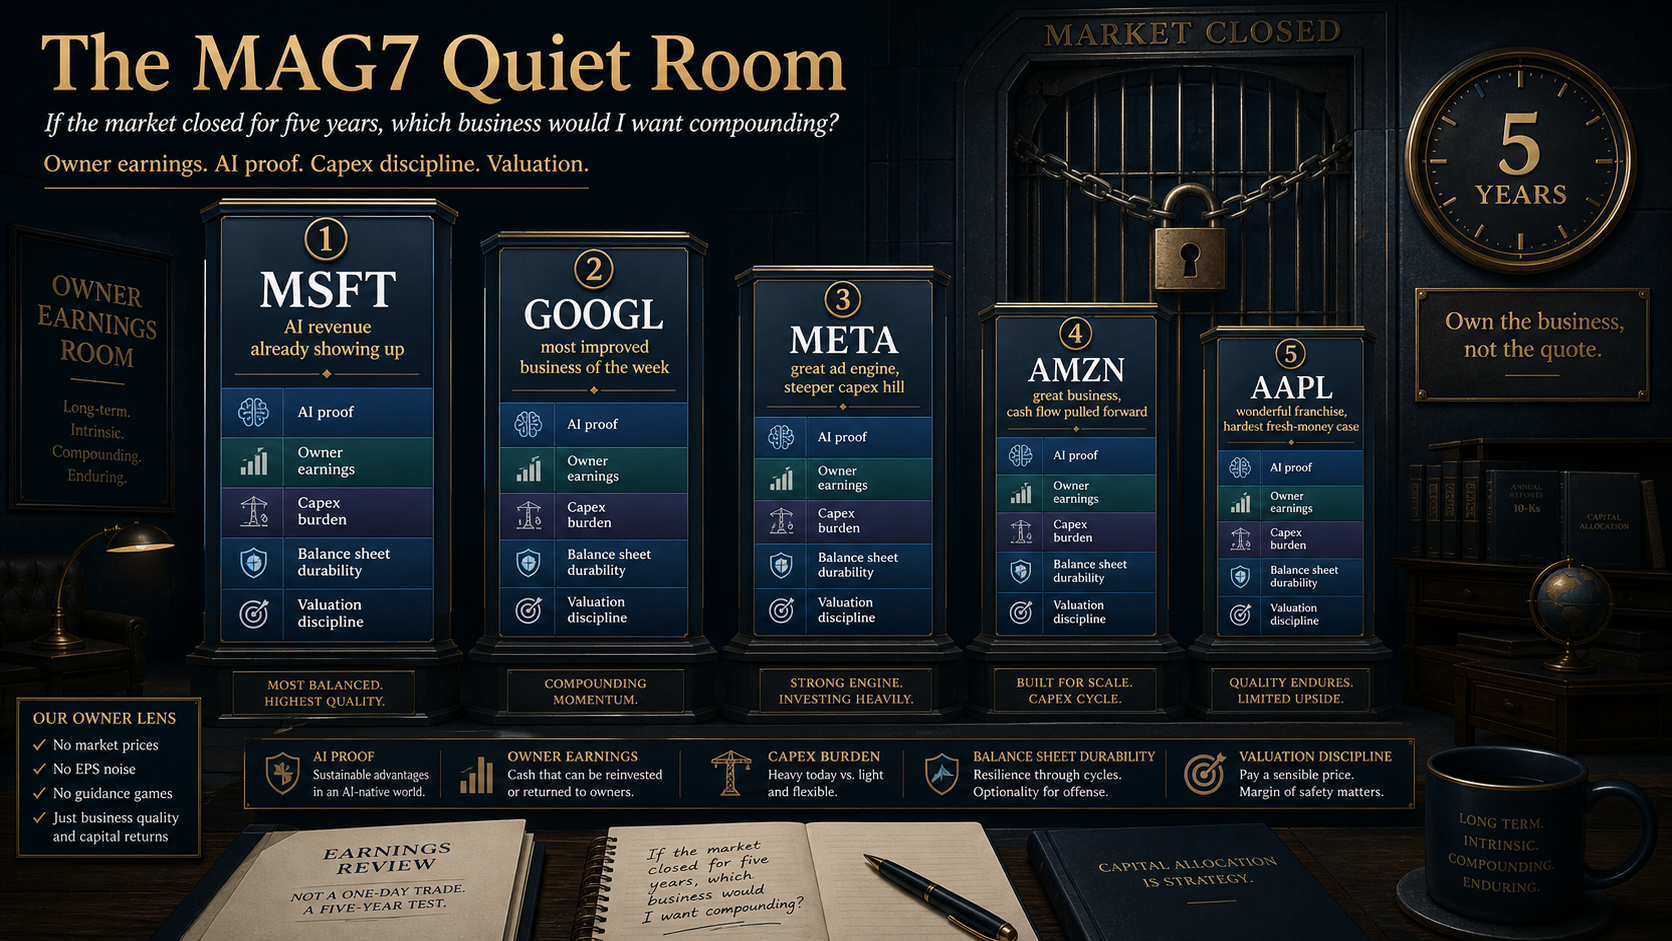
His takeaway is simple: own great businesses and stop checking the price. So I’m running a thought experiment with this report. Imagine the market shuts for five years.
No tickers. No earnings drama. No Wall Street commentary. Just the businesses themselves, doing what they do, in what I’ll call the quiet room.
Which of these five do I most want compounding while I’m not watching? That’s the question that matters for capital I’m not going to touch. This is my position-aware ranking.
The Ranking
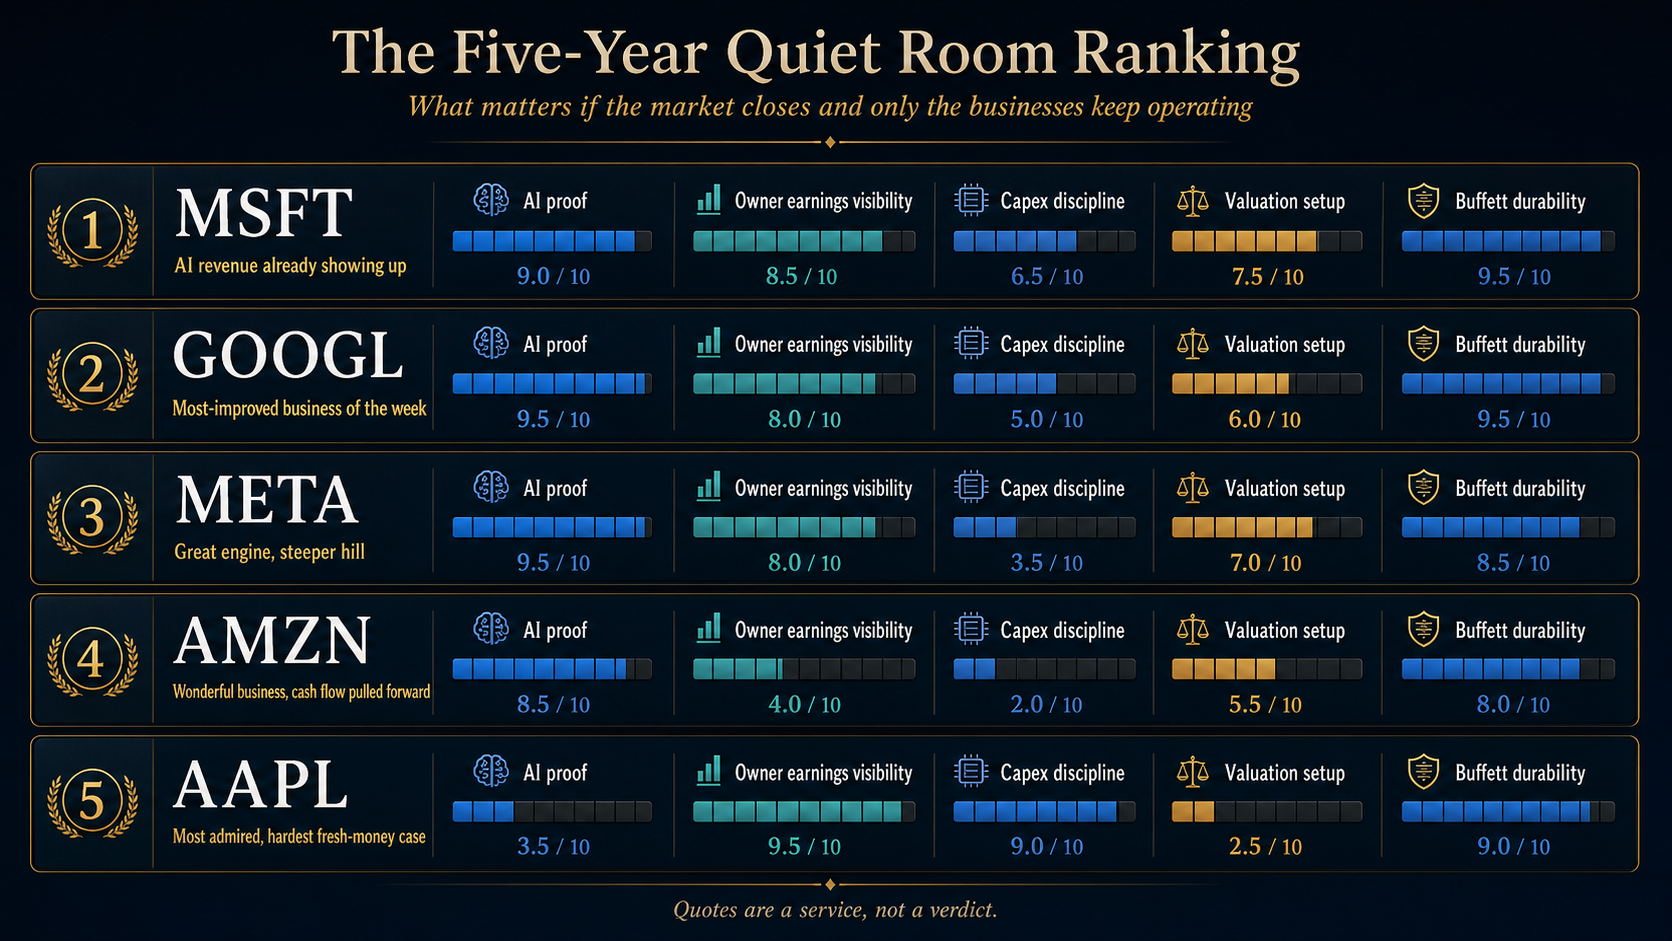
- (MSFT) Microsoft. The strongest evidence in the quiet room. AI is already running through the income statement, the balance sheet swamps the spend, and the starting price still sits below my Strong Buy line.
- (GOOGL) Alphabet. The most-improved business of the week. Cloud crossed the line from “huge AI spender” to “huge AI monetizer,” but the multiple now reflects most of that.
- (META) Meta Platforms. The loudest of the five. Ad pricing and impressions are firing, but the capex curve is climbing faster than the proof curve.
- (AMZN) Amazon. A wonderful business that’s still pulling owner cash forward into the future. The reinvestment is real, the payoff is later.
- (AAPL) Apple. The most admired company in the room and the hardest one to underwrite as fresh money at this price.
The sections below walk through what changed, what didn’t, and where I would and wouldn’t want to be a buyer today.
MSFT Microsoft: AI Revenue Already Showing Up
Microsoft reported fiscal Q3 2026 with revenue of $82.9 billion, up 18% year over year, and operating income of $38.4 billion, up 20%. Diluted GAAP EPS came in at $4.27, up 23%. Microsoft Cloud hit $54.5 billion, up 29%. Azure and other cloud services grew 40%, and commercial remaining performance obligations sat at $627 billion, up 99%.
The most important number isn’t in the headline ratios. CEO Satya Nadella said the AI business surpassed an annual revenue run rate of $37 billion, up 123% year over year. That’s $37 billion in actual customer revenue, not a roadmap promise.
A year ago every hyperscaler was asking investors to take the AI capex on faith. Microsoft is now showing that the customer dollars are actually arriving. The market reaction was cool because Azure 40% only met expectations rather than blowing past them, and CFO Amy Hood guided to roughly $190 billion of capex in calendar 2026. (MSFT) closed at $414.40 on May 1, still about 25% below the 52-week high around $552.
That gap between the high and today’s close is part of what makes this setup attractive over a long horizon. The case for ranking it first is straightforward. The base business is enterprise software, which is the most recurring revenue model on Earth. The cash machine is gigantic, with operating cash flow of $46.7 billion in this quarter alone.
The Vulcan database has Microsoft trading at a 32.6% discount to Fair Value with a Quality Score of 90.5 and a perfect Safety Score of 100. My Strong Buy zone in the system sits at $453.70, which means today’s price is materially below that line. The owner is being paid, in the form of a lower entry, to wait through the heaviest spending year in company history.
GOOGL Alphabet: The Biggest Single-Quarter Repricing
Alphabet had the most consequential earnings night of the week. Q1 2026 revenue rose 22% to $109.9 billion. Operating income rose 30% to $39.7 billion. Diluted EPS rose 82% to $5.11, helped by gains on equity securities, but the underlying operations were what carried the quarter.
Google Services advertising grew 16%, Search ad revenue grew 19% to $60.4 billion, and the cloud segment grew 63% to $20.0 billion. Cloud operating margin lifted to 32.9% from 17.8% a year earlier. The headline number, though, was the cloud backlog, which nearly doubled sequentially to roughly $462 billion. Management said just over half of that should convert to revenue inside the next 24 months.
That backlog number is contracted demand, not a forecast. Wall Street has been asking whether Alphabet’s AI capex would ever earn a return. Q1 answered with multi-year customer commitments worth more than the cumulative GDP of most countries.
Capex for 2026 was bumped to $180 to $190 billion from a prior range of $175 to $185 billion, and management warned 2027 will go higher still. (GOOGL) closed at $385.69 on May 1, basically at a fresh 52-week high after the post-earnings pop. The Vulcan database flags GOOGL with a Quant Score of 63.6 (Buy), an Altman Z of 16.79 (rare strength), Quality Score of 81.7, and a 14.0% discount to Fair Value.
Two things keep it from ranking first. After a sharp post-earnings move, much of the upside has already been priced in, which compresses my forward base case at this entry. The antitrust overhang is also still active. Google is appealing remedies tied to the search monopoly ruling, and any negotiated outcome could touch distribution economics or data sharing for years.
Both risks are manageable, both deserve some discount. If I had to pick the company whose forward setup improved the most this week, it’s Alphabet. The harder question is whether the price improved more than the business did, and the honest answer is probably yes.
META Meta Platforms: Great Engine, Steeper Hill
Meta’s quarter was a textbook ad business performance. Revenue grew 33% to $56.31 billion. Operating income climbed 30% to $22.87 billion. Operating margin held near 41%, and ad impressions rose 19% while average price per ad rose 12%.
That ad-side combination is as direct a piece of evidence as I could ask for that Meta’s AI investments are already lifting recommendation, ranking, and pricing across its surfaces. Operating cash flow hit $32.23 billion. Free cash flow was still a healthy $12.39 billion even after $19.84 billion of quarterly capex.
There’s a footnote worth flagging for honest accounting. GAAP EPS came in at $10.44, but $3.13 of that was a one-time tax benefit tied to the federal tax bill. Pull that out and underlying EPS was closer to $7.31. The operating story is excellent; the owner-earnings story is good but not as eye-popping as the headline.
The reason the stock dropped 6% to 7% had nothing to do with operations. Meta lifted 2026 capex guidance to $125 to $145 billion, up from a prior range of $115 to $135 billion. Management cited higher component pricing and added data center costs to support future capacity. Meta then followed the report with a $25 billion bond sale to help fund the buildout.
(META) closed at $608.57 on May 1, well below the 52-week high of $794. The Vulcan database shows META at a Quality Score of 83.8, an Altman Z of 8.97, Net Debt to EBITDA of just 0.24, and a 21.7% discount to Fair Value. My Strong Buy zone is $593.59 and my Good Buy zone is $659.55, which means today’s price is sitting almost exactly between those two markers.
This is a genuine accumulation window. What keeps Meta out of the top two is a Buffett-style honesty test. The company hasn’t yet shown investors the throughput between this latest capex wave and incremental owner earnings beyond the existing ad business. The bull case requires faith that AI spending creates durable new earnings on top of what the ad engine already produces.
I think the odds are in Meta’s favor. I just can’t honestly say it’s as easy a hold as Microsoft or Alphabet right now.
AMZN Amazon: A Great Business, Cash Flow Pulled Forward
Amazon’s quarter had everything except clean owner cash. Net sales rose 17% to $181.5 billion. Operating income jumped to $23.9 billion from $18.4 billion a year earlier, with the consolidated operating margin reaching a record 13.1%. AWS grew 28% to $37.6 billion, the fastest pace in 15 quarters, with segment operating income of $14.2 billion at a 37.7% margin.
North America sales grew 12% to $104.1 billion with $8.3 billion of operating income. Advertising hit $17.2 billion, up 24%, with trailing twelve months of advertising revenue now above $70 billion. The chips business including Graviton, Trainium, and Nitro crossed a $20 billion annual revenue run rate, growing triple digits. AWS now contributes roughly 59% of Amazon’s total operating income on just 21% of revenue.
Net income reached $30.3 billion, but a chunk of that came from a $16.8 billion pre-tax mark on the Anthropic stake, which is real but lumpy. The cleaner number is operating income, and that one stays impressive. The part that keeps me from ranking Amazon higher is what happens below the operating line.
Trailing twelve-month operating cash flow grew 30% to $148.5 billion. But trailing twelve-month free cash flow collapsed to $1.2 billion, down 95% year over year, because property and equipment purchases climbed by $59.3 billion. Q1 capex alone was $44.2 billion, and management is on track for roughly $200 billion of full-year capex.
(AMZN) closed at $268.36 on May 1, after touching a fresh 52-week intraday high near $273.88. The Vulcan database has AMZN at only a 3.6% discount to Fair Value. The “wonderful price” Buffett talks about is not on offer here.
One specific concern is what holds Amazon at fourth for me. The business is excellent, AWS is re-accelerating, the advertising flywheel is working, and the chip strategy is finally paying off. But the FCF compression is the kind of thing Buffett gets allergic to. He cares about owner earnings, and he’s wary of stories that need years of capex to convert into cash.
The earliest I expect FCF to normalize is once the heaviest capex stops growing, which is probably 2027 at the earliest. For a five-year hold I’m comfortable, just not enthusiastic at this entry. My Strong Buy zone in the system sits at $189.57, and I’d rather wait.
AAPL Apple: The Most Admired, The Hardest to Underwrite Today
Apple had a clean, old-fashioned strong quarter. Fiscal Q2 2026 revenue grew 17% to $111.2 billion, a March-quarter record. Diluted EPS was $2.01, up 22%. iPhone revenue hit $56.99 billion, up 22%, with the iPhone 17 lineup driving a March-quarter record.
Services climbed about 16% to a record $30.98 billion. Greater China revenue jumped 28% to $20.5 billion, which is an important data point given the geopolitical noise around Apple’s supply chain. Apple raised the dividend 4% and authorized another $100 billion buyback. June quarter guidance pointed to 14% to 17% revenue growth, above where the Street had been parked.
The market response was a clean 3% to 4% pop, and (AAPL) closed at $279.93 on May 1, with an intraday high of $287.21 that came within a buck of the 52-week high near $288.62. So why is Apple last on my five-year ranking? Start with valuation.
The Vulcan database shows AAPL at a 15.1% premium to Fair Value, with a Forward P/E above 31, a PEG of 2.43, and a Trim Price of $351.95. My Strong Buy zone for Apple sits at $168.46, which means today’s price is more than 60% above where I’d be a fresh buyer. Apple is never going to be cheap, but this is a particularly stretched starting point relative to its peers in this group.
The AI question is the bigger concern. Apple’s AI strategy has been the slowest to develop of the five. Reuters reported earlier that some Siri upgrades had been delayed, and the company is still running a more cautious, on-device AI playbook than its hyperscaler peers.
Apple isn’t asking to be reranked yet on AI, which means today’s premium has to be justified by hardware cycles, services growth, and a legendary buyback engine. Leadership is the other variable. Coverage of the report noted that a CEO transition is in motion, with a successor preparing to take over from Tim Cook. Buffett has always been clear that great businesses can survive average managers, but a CEO transition at a company of this size belongs in the risk column, not the footnotes.
(AAPL) is a wonderful franchise. I just can’t make a five-year fresh-money case at this multiple, with this AI uncertainty, in front of a transition. The Vulcan model agrees, with Apple’s GNG Quant Rating ticking to a Buy on the system but a Hold on the broader rating, and a 15.1% premium baked into today’s price.
What This Earnings Week Actually Changed
The big read-through is that the market has stopped giving “AI spender” credit by default. Two years ago, just announcing an AI capex number could move a stock 5% higher. This week, the algorithm flipped. Investors paid up only when the spending was already showing up in revenue, backlog, pricing, or margins.
That filter is the right one for a five-year owner. It rewards businesses where today’s investment is already converting into customer demand, and it pushes back on businesses that need a few more years of patience. (MSFT) and (GOOGL) passed that test comfortably. (META) didn’t, despite an excellent core quarter, because the capex raise overshadowed the operating performance. (AMZN) was given measured credit, neither punished nor rewarded much. (AAPL) was rewarded for executing on the franchise it already has, with the AI question still open.
In short, the bar for being trusted with capital just got higher this week. The names that passed have the strongest forward setups from here. The ones that still owe proof are interesting at the right price. The one running on franchise momentum has to be judged on its own terms.
Risks to This View
There are five risks I’m watching for the entire group, in order of conviction. The first is the capex bill itself. Combined 2026 capital spending across Alphabet, Amazon, Meta, and Microsoft now sits well above $700 billion. If even a portion of that fails to earn a sufficient return, the entire group’s forward returns get compressed.
The second is multiple compression. Most of these names are now trading above their 5-year average forward P/E ratios, and even small de-ratings can hurt forward returns more than EPS misses can. The third is antitrust risk for (GOOGL). The remedies process is still active, and any structural change to the search business model could affect distribution economics for years.
The fourth is hardware cycle dependency for (AAPL). The thesis still leans heavily on iPhone unit economics holding up, with services adding margin on top, and a weaker upgrade cycle would expose how much of the recent rally was iPhone 17 driven.
The fifth is AI demand digestion. There’s a non-trivial scenario where customer AI spending pauses for a quarter or two as enterprises consolidate vendors and renegotiate contracts. That would hit cloud growth at all three hyperscalers at once.
Comparison Table
| SYM | Mkt Cap | P/E | PEG | Fair Value | Disc. to FV | Qual | Safety | Altman Z | Piotroski | Rev. | Op. CF | FCF Yield |
|---|---|---|---|---|---|---|---|---|---|---|---|---|
| MSFT | $3.2T | 28.35 | 1.34 | $630.15 | -32.64% | 90.50 | 100.00 | 8.80 | 6.00 | $318.3B | $160.5B | 2.44% |
| GOOGL | $4.3T | 43.74 | 2.63 | $406.78 | -13.97% | 81.73 | 84.14 | 16.79 | 6.00 | $402.8B | $164.7B | 1.71% |
| META | $1.7T | 22.53 | 1.00 | $854.13 | -21.66% | 83.84 | 84.37 | 8.97 | 5.00 | $201.0B | $115.8B | 2.68% |
| AMZN | $2.9T | 36.69 | 1.90 | $272.75 | -3.56% | 82.56 | 84.41 | 5.94 | 6.00 | $716.9B | $139.5B | 0.27% |
| AAPL | $4.0T | 34.16 | 2.43 | $234.64 | 15.14% | 93.83 | 96.89 | 10.60 | 8.00 | $435.6B | $135.5B | 3.08% |
The Bottom Line
If the market shut for five years tomorrow, this is the order I’d want my MAG7 exposure: (MSFT) first, (GOOGL) second, (META) third, (AMZN) fourth, (AAPL) fifth. Buffett doesn’t avoid growth. He just won’t pay any price for it, and he’s particular about who he trusts with capital that he can’t easily redeploy.
This week’s earnings made it easier, not harder, to tell which of these businesses earned that respect. The numbers backing the ranking are in the Master Metrics Table below.
Sources and Disclosures
Sources include the company 8-K filings for Q1 2026 (for Alphabet, Meta, and Amazon), fiscal Q3 2026 (for Microsoft), and fiscal Q2 2026 (for Apple); CNBC; Reuters; Yahoo Finance; The Motley Fool; Sherwood News; Macrotrends; Investing.com; Robinhood; and the GNG Research database. Vulcan database fields (Quality Score, Safety Score, Quant Score, Fair Value, Strong Buy / Good Buy / Trim Zones) were sourced from gngresearch.com.
This is not investment advice. The author is not a financial advisor or fiduciary. All position sizes shown are illustrative. Do your own work.


Leave a comment