
Some businesses grow because the market is hot. Others grow because the world can’t function without them. Mastercard (MA) is the second kind. Every swipe, tap, and cross-border settlement on earth feeds revenue through a network so deeply embedded in global commerce that switching costs are practically theoretical. Yet the company just posted 18% revenue growth, 25% adjusted EPS growth, and hasn’t missed a consensus estimate in eight consecutive quarters. Despite all of that, the stock is sitting 17% below its 52-week high.
Wall Street is pricing in a problem. The business says otherwise. I’m a buyer, but a patient one.
The Network That Compounds While You Sleep
Mastercard (MA) doesn’t make loans, take credit risk, or hold deposits. It operates the rails connecting the bank behind your card to the bank behind the merchant’s terminal. Every transaction generates a fraction of a cent in revenue at margins that would make software companies jealous. More transactions make the network more valuable, and the more valuable the network becomes, the harder it is for merchants and banks to leave. Once you’re in, the economics of leaving are worse than the economics of staying.

Q4 2025 reinforced the contradiction. Net revenue climbed 18% reported, 15% currency-neutral. Adjusted diluted EPS jumped to $4.76, a 25% increase over the year-ago quarter. Cross-border volume, the highest-margin segment, rose 14%. Switched transactions grew 10%. For the full year, net revenue grew 16% and the network processed $10.6 trillion in gross dollar volume.
Most investors skip over the next figure, and that’s a mistake. Value-added services, the suite spanning fraud detection, data analytics, identity verification, consulting, and cyber defense, grew 26% in Q4 on a reported basis (22% currency-neutral). These are higher-margin, stickier revenue streams that are transforming Mastercard from a transaction processor into something closer to a financial infrastructure platform. When nearly 40% of your revenue comes from services that don’t depend on card swipes at all, you’re building a moat inside a moat. The business is getting harder to compete with, not easier.
Where the Discount Came From
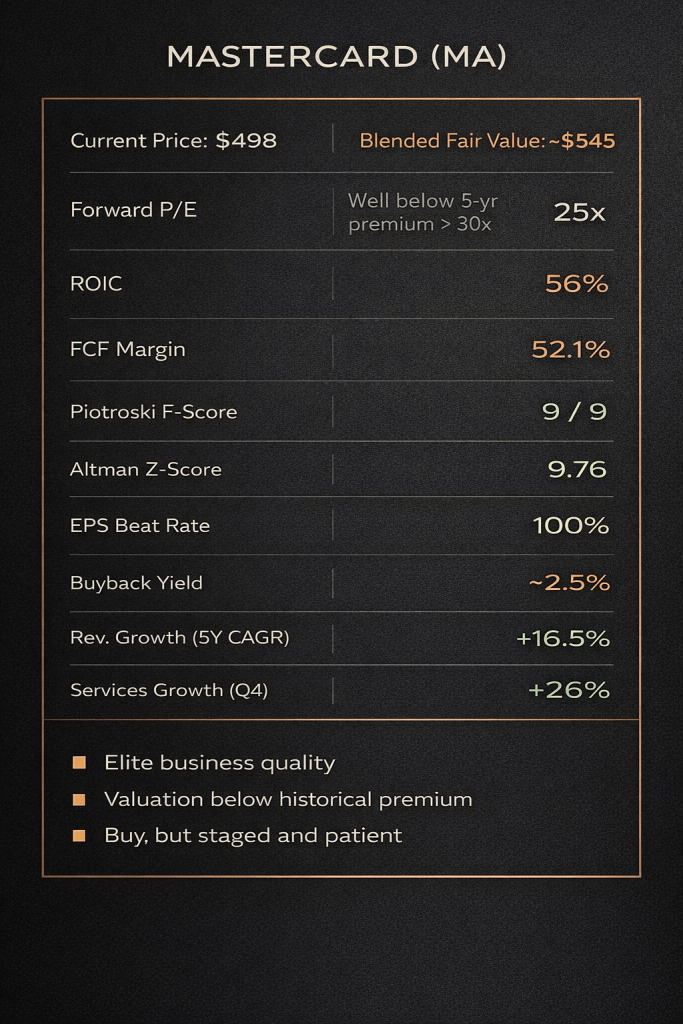
Peak business quality. Stock priced like the engine stalled. Those two facts don’t usually coexist for long.
What actually happened: the market compressed premium multiples across the board. Mastercard routinely traded above 30x forward earnings over the past five years. Today it sits around 25x. That re-rating, combined with negative momentum and tougher growth comparisons in early 2026, crushed sentiment. Management noted that early-2026 growth would run below second-half 2025 levels because of prior-year FX-volatility-driven comparisons, even while the broader 2026 revenue outlook stayed at the high end of low double digits.
Put differently: the market isn’t punishing Mastercard (MA) for what it did. It’s punishing it for what it might not do next quarter. In a market that rewards only acceleration, a company growing 15% currency-neutral instead of 17% gets treated like a deceleration story. The mispricing creates the opportunity.
Recent developments since earnings have actually been constructive. Mastercard launched its Agent Suite in late January, partnered with Ericsson on digital money movement in February, added SoFiUSD settlement support in early March, and rolled out a crypto partner program with more than 85 participants on March 11. None of these move the needle on next quarter’s EPS. All of them widen the moat over the next 3-5 years.
On the weekly chart, the correction is structural. Price sits below both the 50-week moving average and the 200-day trend proxy. It has broken through several Fibonacci retracement levels and now trades between the 1.382 extension near $499.8 and the 1.618 extension near $484.6. Weekly MACD is negative and widening. Stochastic readings sit in oversold territory, which historically has preceded bounces in this name, but doesn’t guarantee one.
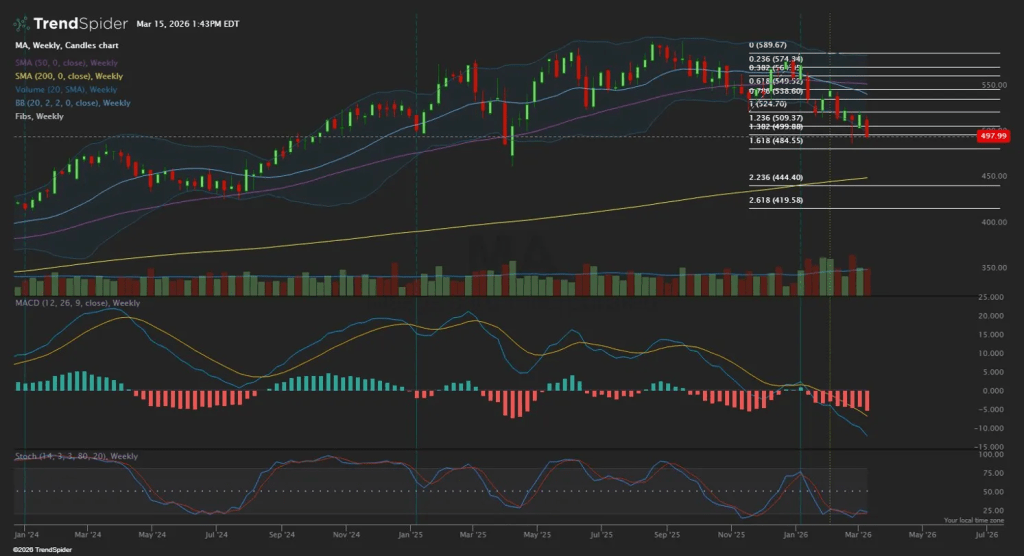
Two readings from that chart. Value is improving faster than price action is confirming. And you don’t need to chase the first bounce.
Under the Hood: What the Quality Scores Actually Mean
Time to look at the fundamentals that justify patience even when the chart looks ugly.
Altman Z-Score: 9.76. Anything above 3.0 signals financial safety. Mastercard is more than triple that threshold. Bankruptcy risk is about as close to zero as it gets in a public company. Piotroski F-Score: 9 out of 9. Perfect marks on profitability, operating efficiency, and balance sheet strength. I’ve screened thousands of tickers through this filter. A 9 is rare. A 9 on a $450 billion market cap company is exceptional. ROIC: 56%. For every dollar of invested capital, the business generates 56 cents of return. Most industrial companies are thrilled to clear 15%. FCF Margin: 52.1%. More than half of every revenue dollar converts to free cash flow, which means Mastercard doesn’t need to chase external financing to fund its growth or its buybacks. Cash Conversion Ratio: 1.17. Earnings are collected in cash at a rate that exceeds accounting profits. EPS Beat Rate over 8 quarters: 100%. Every single quarter. That kind of consistency in a $33 billion revenue business is what separates compounders from pretenders.
Net debt sits at $8.6 billion against $17.6 billion in operating cash flow. Mastercard could pay off every dollar of net debt in roughly six months of operating cash flow. Interest coverage is 26.4x. For a business this asset-light, the balance sheet is almost absurdly overcapitalized.
Capital returns reinforce the quality case. Share count is declining at 2.6% annually, meaning shareholders own a growing slice of a growing pie. Dividends have compounded at 13.7% over five years with a 16% payout ratio, leaving enormous room for continued growth. On the income-growth front, the Chowder Rule comes in at 15.3%, well above the 12% threshold income-growth investors screen for. Beneish M-Score of -2.32 confirms there’s no earnings manipulation. This is a clean set of books powering a clean growth story.
Valuation: Three Anchors, One Conclusion
I built my blended fair value from three independent sources for (MA).
One well-known independent research firm maintained a $520 fair value estimate after Q4 results, calling the stock roughly fairly valued at post-earnings levels. A quantitative screening platform calculates $541 with a 9% margin of safety. A custom earnings-growth model using a 28.43x fair-value multiple on 2026 estimated EPS of $19.57 implies a value in the mid-$550s.
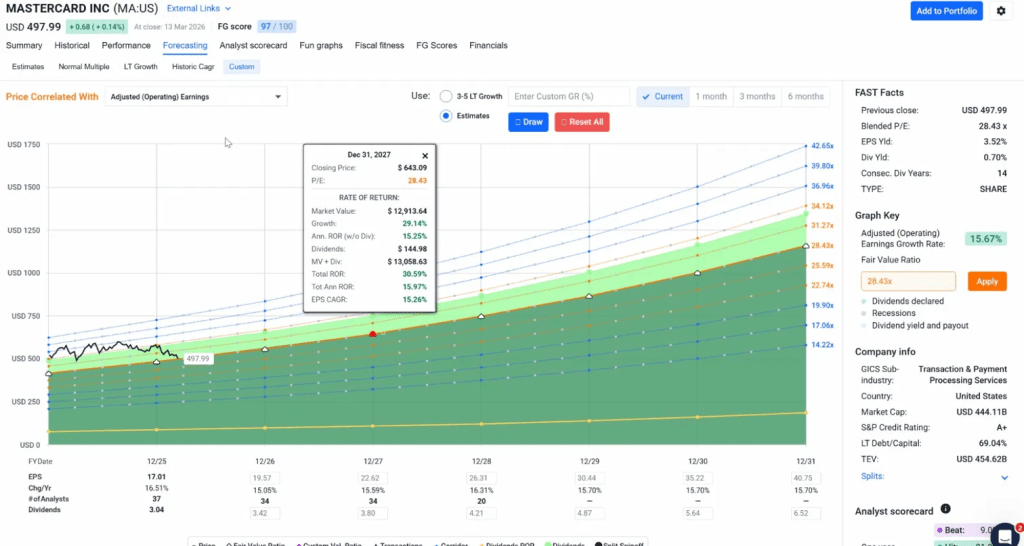
At a 15.67% adjusted operating earnings growth rate, the stock’s current price of ~$498 sits below every forward valuation corridor on the chart. By December 2027, the model projects a price above $640 at fair value, with a total annualized return north of 15% including dividends. Even the conservative anchor at $520 implies mid-single-digit upside before you account for the 0.6% yield and the 2.5% buyback yield working in the background.
Triangulating those three sources, my practical blended fair value lands near $545. At $498, that’s roughly 9.4% upside to fair value alone. Factor in shareholder yield of roughly 3.1% (dividends plus buybacks), and the total return picture over 12-18 months starts looking more compelling. Enough for a BUY in a business this good. Not enough for a Strong Buy under strict value discipline.
Five Risks Worth Tracking
Regulatory squeeze on interchange. A revised swipe-fee settlement worth $38 billion was announced in November 2025, and merchant opposition continues. If regulators push interchange rates meaningfully lower, the network economics compress.
Multiple compression continuing. If the market decides 22x, not 25x, is the right forward multiple for payment networks, the stock could trade to $430 before fundamentals catch up. That represents another 13% of downside from current levels. Worth noting: Visa trades at a similar premium, so a sector-wide re-rating would hit both names simultaneously, and there may not be a relative-value escape hatch within payment networks.
Cross-border growth deceleration. Cross-border volume is the highest-margin segment, contributing disproportionately to operating income. If global travel or cross-border commerce slows due to recession, trade restrictions, or geopolitical disruption, the revenue mix shifts unfavorably. Sequential declines below 10% growth would be a clear warning signal.
Government-sponsored real-time payment rails. FedNow in the US, UPI in India, Pix in Brazil: each one routes transactions around the card networks entirely. India’s UPI already processes over 14 billion transactions per month. When a country builds a free instant-payment system, it removes domestic transaction volume from the card network entirely. Cross-border remains Mastercard’s stronghold, but the domestic competitive landscape is shifting.
AI and crypto disruption at the edges. Mastercard is investing in both through partnerships (Cloudflare on cyber defense, SoFiUSD settlement support, an 85-partner crypto program). But these are early-stage. If they become competitive threats rather than partnership opportunities, the network advantage narrows.
The Entry Plan
Buy in thirds. This is a correction in a world-class business, not a broken franchise. My approach: staged accumulation with discipline.
Primary Buy Zone: $490 to $505. Current trading range, with support from the 1.382 Fibonacci extension on the weekly. Good starting position for a first tranche.
Strong Buy Zone: $463 to $490. If broader market stress pushes the stock through the 1.618 extension at $484.6, you’re getting a compounder of this caliber at a genuine discount. I’d add meaningfully in this zone.
Very Strong Buy Zone: $436 to $463. Gift territory. Reaching this level would require a market-wide selloff or company-specific bad news that hasn’t materialized. I’d be aggressive here.
Trim Zone: $600 to $655. At these levels, the stock would be trading at or above the mean analyst target of $663 and well above blended fair value. Time to take profits and redeploy.
Invalidation triggers: Cross-border and services growth rolling over materially. Management losing the ability to grow revenue at low-double-digit rates. Regulatory outcomes that start impairing actual economics rather than just headline sentiment. Or the stock breaking below $445 on a weekly basis alongside deteriorating fundamentals. Any of those would force a full thesis review.
Position sizing: 1 to 2% of portfolio. High-conviction, but sized for a premium compounder in correction rather than a core position.
The Bottom Line
The contradiction from the title hasn’t resolved. In 2025 alone, the network processed $10.6 trillion in gross dollar volume across 175.5 billion switched transactions. Value-added services are growing faster than the core payment network. Six months of operating cash flow could extinguish all net debt. Despite all of that, the stock trades at a discount to where it’s been for most of the past five years.
None of that screams “broken business.” It reads more like a franchise the market forgot to re-price after the fear passed. Buy it in stages. Let the chart confirm. The real edge isn’t in timing the bounce. It’s in accumulating a compounder at a discount while the network quietly does what it’s always done: compound.
Rating: BUY | Next earnings: May 7, 2026
Master Metrics Table
| Metric | Value | Context |
|---|---|---|
| Vulcan Composite | Quality 97, Growth 99, Value 72 | Top-tier quality and growth, fair value |
| Altman Z-Score | 9.76 | Financial safety (>3.0 threshold) |
| Piotroski F-Score | 9/9 | Perfect fundamental health |
| ROIC | 56% | Exceptional capital efficiency |
| FCF Margin | 52.1% | Over half of revenue becomes cash |
| Interest Coverage | 26.4x | Debt service is trivial |
| EPS Beat Rate (8Q) | 100% | Flawless execution streak |
| Chowder Rule | 15.3% | Strong income-growth signal (>12%) |
| Buyback Yield | 2.5% | Persistent share count reduction |
| Beneish M-Score | -2.32 | No earnings manipulation detected |
| Fwd P/E | ~25x | Below historical average of 30x+ |
| Blended Fair Value | ~$545 | ~9% upside from current price |
| Max Drawdown 1Y | -20.0% | Correction context |
| Cash Flow Predictability | 98th percentile | Near-perfect earnings visibility |
| Revenue CAGR (5Y) | 16.5% | Consistent double-digit topline |
Vulcan Stock Research | GNG Research
Disclosure: This is not financial advice. I may hold or initiate positions in $MA. Always do your own due diligence.
References
- Mastercard Q4 2025 Earnings Release, SEC Filing (January 29, 2026)
- Mastercard Q4 2025 Earnings Call Transcript
- Morningstar Fair Value Analysis, Post-Q4 2025
- Mastercard Investor Relations, Stock Data
- Reuters, Visa/Mastercard Revised Swipe Fee Settlement, Nov 2025
- FastGraphs Forecasting Tool
- TrendSpider Technical Analysis


Leave a comment