
Published March, 2026 | Vulcan Stock Research | GNG Research
Most investors treat earnings week like a game of musical chairs: everyone scrambles for position, nobody wants to be the last one standing when the music stops. I am doing the opposite with Micron Technology (MU). I am buying shares this week, five days before the March 18 report, because the data tells me the market is still pricing this company like a commodity memory maker when it has quietly become something closer to an AI infrastructure toll booth.
That is the core tension here. Micron (MU) trades at a forward P/E around 8x with a growth score of 100 out of 100 and a quality score of 97. Those numbers do not belong in the same sentence unless something is mispriced. Either the growth is fake, or the multiple is wrong. After running this through both the GNG Quant Rating (which flags MU as a Strong Buy) and the Vulcan GARP LDA model (Logic Dictates Alpha), I believe the multiple is wrong, and I am positioning accordingly.
The Memory Company That Stopped Being Just a Memory Company
Here is the simplest way to understand what happened to Micron (MU) over the past 18 months. Imagine a gravel quarry that has been selling crushed rock for decades, cycling through booms and busts with every construction season. Now imagine that quarry discovers a vein of rare gemstones running through the same rock, and suddenly every AI data center in the world needs those gems to function. The quarry still sells gravel, but the gemstone business is what changes the economics entirely.
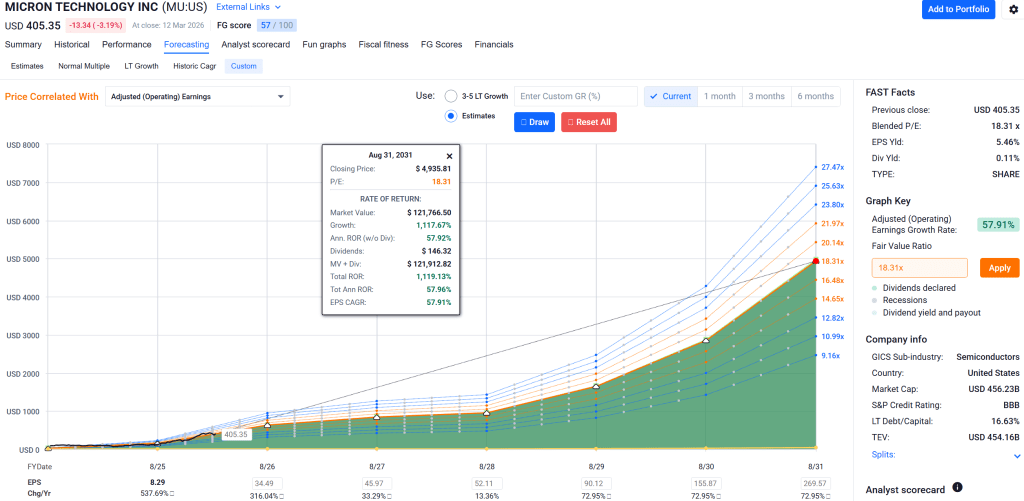
That is Micron’s high-bandwidth memory (HBM) transformation. The company reported record fiscal Q1 2026 revenue of $13.64 billion, then guided fiscal Q2 to $18.7 billion with roughly 68% non-GAAP gross margin and $8.42 of non-GAAP EPS. Those are not memory cycle numbers. Those are infrastructure monopoly numbers. Management also disclosed it has locked in price and volume agreements for its entire calendar 2026 HBM supply, including next-generation HBM4. When a cyclical company starts talking about full-year forward visibility, the cycle is changing.
The HBM total addressable market itself is accelerating faster than anyone modeled. Micron’s own December investor presentation moved the 2028 TAM estimate from roughly $35 billion in 2025 to $100 billion, pulling that milestone two years earlier than its prior forecast. Tight supply conditions could persist beyond calendar 2026.
This is not a hope trade. This is a company generating record quarterly free cash flow of $3.9 billion, posting a 100% EPS beat rate over the last eight quarters with an average surprise of 45.4%, and trading at a forward multiple that implies the market expects the cycle to crash tomorrow.
What the Vulcan GARP LDA Model Actually Shows
When I run (MU) through the Vulcan GARP LDA framework, it surfaces as one of the cleanest growth-at-a-reasonable-price setups in large-cap semiconductors. The model combines the GNG Quant Rating (Strong Buy) with proprietary factor scoring across value, growth, quality, and safety dimensions.
The numbers speak clearly. Next-year EPS estimates sit at $46.34 per share against a stock price around $405. That is an 8x forward earnings multiple on a company growing EPS 34% next year with 33% revenue growth. The PEG ratio lands at 0.3x forward. For context, the semiconductor sector median PEG is closer to 1.5x. Micron is trading at one-fifth of the sector’s growth-adjusted valuation.
Quality metrics reinforce the thesis rather than contradicting it. Altman Z-Score of 11.3 puts Micron firmly in the safe zone, well above the 3.0 threshold. Interest coverage runs at 32.3x, meaning the company earns enough to cover its debt obligations more than 30 times over. Debt-to-equity sits at just 0.2. The balance sheet is not a concern here; it is an asset.
The GNG fair value estimate comes in at $453.52. The Vulcan database shows fair value at $470.69. Blending these with the CFRA anchor of $440 produces a composite fair value around $455. At $405, that represents roughly 12% upside to fair value before accounting for further earnings revisions, which have been moving aggressively higher: current-quarter estimates rose 5.5% in the last 30 days alone, and next-quarter estimates jumped 9%.
Why the Technical Setup Supports the Fundamental Case
Price action matters even when the fundamental thesis is strong, because a stock can be right and early at the same time. Here, the technicals suggest I am not early.
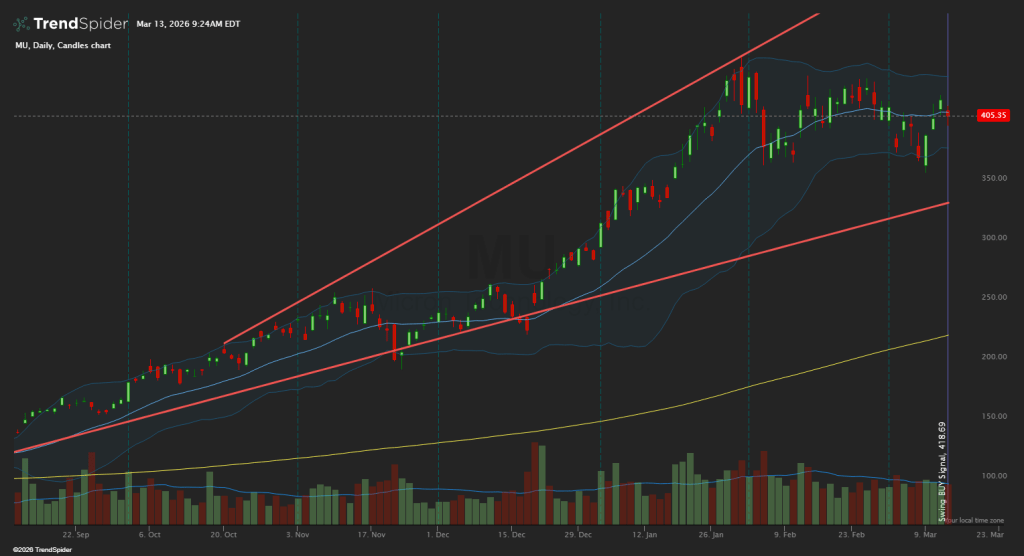
The daily chart shows MU pulling back from its January all-time high of $455.50 into a consolidation zone between roughly $395 and $420. The stock is holding above its key moving averages, and the recent pullback has brought MACD closer to a potential bullish crossover near the zero line. RSI has cooled from overbought territory into the mid-range, giving the stock room to run if earnings deliver. Volume has been declining on the pullback, which is constructive: sellers are not aggressive, they are cautious.
The $395-400 zone represents the line in the sand. If Micron holds above that level through earnings, the consolidation becomes a launchpad. If it breaks below on a miss, the next meaningful support sits around $355, which happens to align with the GNG “good buy” price of $354.91.
Five Risks That Could Break This Thesis
I do not buy anything without mapping exactly what would make me wrong. Here are five specific risks with measurable triggers:
Risk 1: HBM4 customer concentration disappointment. Reports this week suggest Samsung and SK Hynix may be initial HBM4 suppliers for Nvidia’s Vera Rubin platform, with Micron potentially joining later. If Micron’s HBM4 ramp delays beyond Q3 calendar 2026, trim the position by one-third. Invalidation: HBM revenue guidance cut by more than 10% on any future earnings call.
Risk 2: DRAM pricing cycle reversal. Memory is still cyclical. If average selling prices decline more than 15% quarter-over-quarter in conventional DRAM for two consecutive quarters, the margin expansion thesis compresses. Watch gross margins closely: a drop below 55% non-GAAP would signal trouble.
Risk 3: Capex overshoot destroying free cash flow. Micron’s capital expenditure runs at 42.6% of sales, which is extremely high. If capex rises above 50% of sales without proportional revenue acceleration, FCF generation breaks down. Current FCF margin is 11%, which is adequate but not wide. A drop below 8% FCF margin for two quarters triggers a reassessment.
Risk 4: Geopolitical supply chain disruption. The current Iran conflict is already impacting investor sentiment across semis. If oil prices spike above $120 and sustained military escalation disrupts Asian shipping lanes, the entire semiconductor complex faces demand destruction. This is a macro risk, not a Micron-specific risk, but it would hit cyclicals hardest.
Risk 5: Post-earnings sell-the-news reaction. Micron has gained roughly 42% year-to-date heading into this report. Even a strong beat could trigger profit-taking. If the stock drops 10% or more post-earnings on results that meet or beat guidance, I would add to the position, not sell. A sell-the-news reaction on good numbers is an opportunity, not a reason to panic.
How I Am Sizing and Staging This
My blended fair value of $455 against a current price around $405 gives me roughly 12% upside to fair. That is attractive but not screaming, so I size this as a staged GARP position, not a full-conviction one-shot entry.
Buy zone: $370 to $410. I am buying a starter position here, this week.
Strong buy zone: $320 to $355. If post-earnings volatility gives me a gift in this range without a thesis change, I scale to a full position.
Trim zone: $540 to $600. At those levels, the market would be pricing in peak-cycle euphoria, and I take profits.
Position sizing: Starter at 0.5% of portfolio, scaling to a 1.5% full position only on either (a) a pullback into the strong buy zone or (b) continued upward estimate revisions over the next two quarters.
12-month target: $460, representing a move toward the blended fair value with some margin for continued revision momentum.
The Bayesian View: Probability-Weighted Outcomes
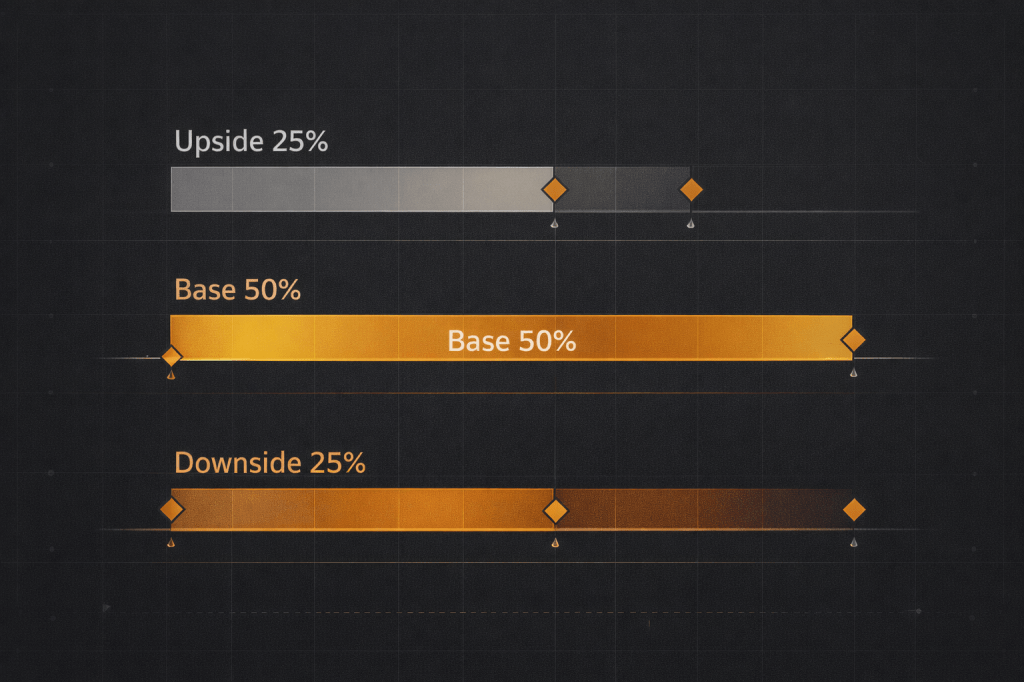
Rather than pretending I know exactly what happens, here is how I weight the forward scenarios:
Downside (25% probability): $300 to $355. Cycle cracks, HBM mix disappoints, post-earnings derate sends the stock back to the strong buy zone. In this scenario, I add rather than sell.
Base case (50% probability): $430 to $485. Guidance lands, AI memory demand stays tight, multiple stays reasonable. This is the most likely path and produces a solid return from current levels.
Upside (25% probability): $520 to $600. HBM execution remains elite, DRAM tightness persists through calendar 2026, estimates keep rising. This is where the position becomes a significant winner and I begin trimming.
Bottom Line
Micron is one of the better asymmetric setups in large-cap semis heading into this earnings print. The GNG Quant Rating of Strong Buy and the Vulcan GARP LDA model agree: this is a company where the growth trajectory has outpaced the market’s willingness to pay for it. A forward P/E of 8x on 34% EPS growth is the kind of mismatch that resolves in one direction.
I am buying before March 18 because I would rather own the right to that resolution than try to time it perfectly afterward. The easy money from the initial re-rating has been captured. What I am buying now is continued execution, continued HBM scarcity, and a market that eventually reconciles $46 in forward earnings with a stock price that does not yet reflect it.
Staged entry. Clear invalidation triggers. Eyes open. That is the Vulcan way.
Master Metrics Table
| Metric | Value |
|---|---|
| Vulcan Overall Rating | 87/100 |
| Value Score | 55 |
| Growth Score | 100 |
| Quality Score | 97 |
| Sentiment Score | 70 |
| Forward P/E | 8.0x |
| PEG Forward | 0.3x |
| Altman Z-Score | 11.3 |
| Piotroski F-Score | 7/9 |
| Interest Coverage | 32.3x |
| Debt/Equity | 0.2 |
| ROIC | 17.3% |
| Gross Margin | 45.3% |
| Operating Margin | 32.6% |
| Net Margin | 28.2% |
| FCF/Share | $4.12 |
| FCF Margin | 11.0% |
| EPS (TTM) | $10.63 |
| Next-Year EPS Est. | $46.34 |
| 1Y EPS Change | +151.7% |
| 5Y EPS Growth Est. | 37.6% |
| Beta (3Y) | 2.05 |
| 1Y Max Drawdown | -37.2% |
| Buyback Yield | 0.1% |
| Compensation Yield | 0.3% |
| EV/Forward EBITDA | 7.6x |
| GNG Quant Rating | Strong Buy |
| Vulcan LDA Pathway | GARP / Cyclical Growth |
| Blended Fair Value | ~$455 |
| Buy Zone | $370-$410 |
| Strong Buy Zone | $320-$355 |
| Trim Zone | $540-$600 |
| 12-Month Target | $460 |
References
- Micron Technology, Inc., “Results for the First Quarter of Fiscal 2026,” Micron Investor Relations, December 2025.
- Micron Technology, Inc., December 2025 Investor Presentation, Micron Investor Relations.
- Micron Technology, Inc., “World’s First High-Capacity 256GB LPDRAM SOCAMM2,” Press Release, March 3, 2026.
- GNG Research Terminal, gngresearch.com. Fair value and quant rating data.
- Vulcan Stock Research Database, vulcan-stock.com. Pillar scores and factor analysis.
- FastGraphs, Forecasting view for Micron Technology (MU), accessed March 2026.
- TrendSpider, Daily chart for Micron Technology (MU), accessed March 13, 2026.
Disclosure: The author holds a position in MU. This is not financial advice. All analysis reflects the author’s personal research framework and should be verified independently before making investment decisions.


Leave a comment