
The Fastest Machine on a Cracking Track
NVIDIA just printed one of the most dominant fiscal years in semiconductor history: $215.9 billion in revenue, $102.7 billion in operating cash flow, and a net margin north of 55%. The engine powering the AI revolution isn’t slowing down. But the road underneath the stock price has started to fracture, and the gap between what this company IS and what the market is willing to PAY right now is where the opportunity lives.
I’m buying NVDA here. Not all at once, and not because I think the chart is fixed. I’m buying because the fundamentals haven’t just held up under the weight of geopolitical chaos, customer concentration, and technical damage; they’ve actually accelerated through it. That disconnect is exactly what creates asymmetric setups in mega-caps. You don’t get to buy the best business in AI at a forward P/E under 17x very often. When you do, you buy it like a risk manager: in layers, with discipline, and with clear lines where you walk away.
The Engine: Why This Business Is Still Elite
Start with the fiscal 2026 numbers, because they’re staggering even by NVIDIA’s own standards. Full-year revenue of $215.9 billion represented 65% growth. Q4 alone delivered $68.1 billion, with Data Center contributing $62.3 billion of that, up 75% year over year. Quarterly gross margin came in at 75.0%. That’s not hardware economics; that’s software-like profitability wrapped inside a physically constrained supply chain.
The balance sheet reinforces the picture. Cash and marketable securities sit at $62.6 billion. Debt-to-equity is 0.1. Interest coverage is 547x. The Altman Z-score registers around 57, which isn’t just “safe”; it’s in a category most industrial companies will never reach. Free cash flow for the year came in around $96.7 billion after roughly $6.1 billion in capex.
Quality scoring across the Vulcan system confirms what the raw numbers show. Quality Score: 100. Growth Score: 100. ROIC: 91.5%. Return on equity: 76.3%. Return on assets: 75.4%. These aren’t inflated by financial engineering or leverage tricks. They’re the product of a genuine monopoly position in accelerated computing during the most capital-intensive infrastructure buildout since the internet backbone.
The competitive moat here isn’t just hardware. It’s CUDA, the software ecosystem that makes switching costs enormous for enterprise customers. It’s the networking stack, including Mellanox and InfiniBand, that connects GPU clusters. It’s the architectural cadence, Hopper to Blackwell to Rubin, that keeps the product roadmap ahead of every competitor by at least one generation. AMD and custom silicon from hyperscalers will take share at the margin. None of them are close to replicating the full-stack advantage.
The Cracks: What the Market Is Actually Pricing
None of those fundamentals are in dispute. The market is fighting about three things: concentration, geopolitics, and duration.
On concentration, NVIDIA’s own 10-K is blunt. One direct customer represented 22% of fiscal 2026 revenue. Another represented 14%. In a rising-demand environment, that’s fine. In any scenario where hyperscaler capex pauses, it becomes a single-point-of-failure risk. The AI infrastructure buildout depends on a handful of companies continuing to spend at unprecedented rates. Any crack in that spending discipline, and the stock will feel it before the income statement does.
On geopolitics, the situation has worsened. NVIDIA is effectively foreclosed from competing in China’s data-center compute market under current export controls. The company recorded a $4.5 billion charge related to H20 inventory and purchase obligations after new licensing requirements took effect. H200 shipments into China face a 25% tariff, and NVIDIA hasn’t generated revenue under that licensing program yet. Recent reports indicate the company has paused H200 chip production for China entirely, redirecting TSMC capacity toward Vera Rubin. That’s a strategic pivot, not a capitulation, but it means the China revenue line is effectively zero for now.
On capital commitments, NVIDIA disclosed $95.2 billion in outstanding inventory purchase and long-term supply obligations. That number reflects confidence in demand duration, but it also means the company has underwritten a very large bet. If utilization rates crack, the write-down exposure is real.
The fifth risk worth naming is valuation compression in a macro downturn. Even at a forward P/E of 16.7x (using next year’s $10.60 EPS estimate), NVIDIA trades at a beta of 2.07 and carries 42% annualized volatility. In a broad risk-off event, this stock will sell harder and faster than the fundamentals justify. That’s not a flaw; it’s a feature if you’re ready to add into weakness.
Reading the Tape: Technical Reality
The chart captures exactly why the stock feels worse than the business. Price is sitting near the bottom of a multi-month range, fighting around the $175 to $180 area. The Fibonacci structure from the November low to the October high frames the current battle: Fib 0.236 sits at $175.79, Fib 0.382 at $179.65, and the critical reclaim zone clusters at $183 to $185 where horizontal support, Bollinger midline, and broken trend support all converge.
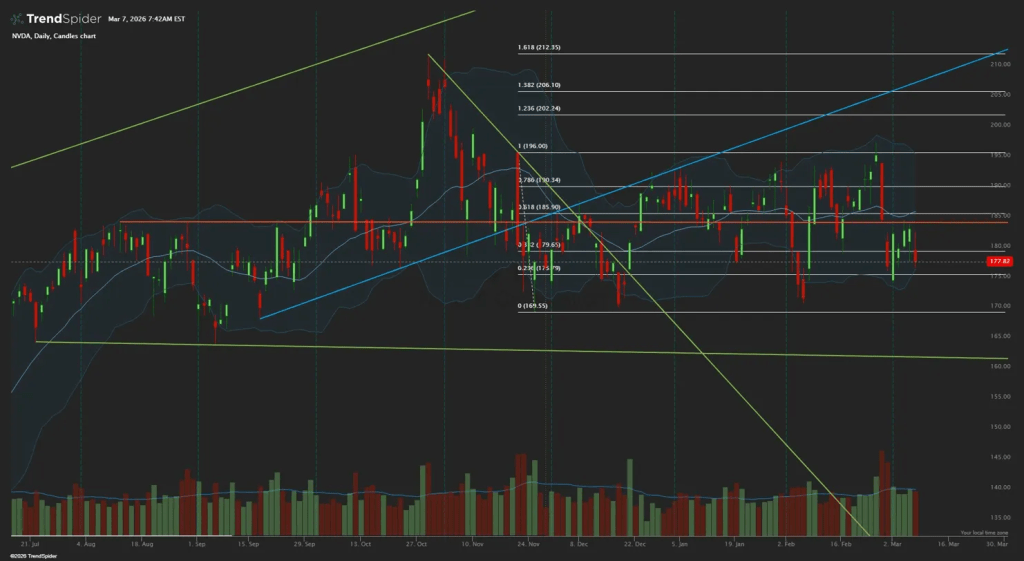
Above $185, resistance stacks at $190 to $192, then $196. Below current price, structural support sits at $169 to $171, with a deeper air pocket toward $155 to $162 if macro stress accelerates. MACD turned negative in the prior week, confirming short-term momentum has shifted. RSI sits at 40, which isn’t oversold but isn’t showing any buying conviction either.
My read: fundamentally buyable, technically not yet repaired. The engine is elite, but the track surface between here and $185 is rough. That’s why you use tranches, not a single entry.
What It’s Worth: Triangulating Fair Value
No single valuation model captures a company growing this fast, this profitably, at this scale. So I’m triangulating.
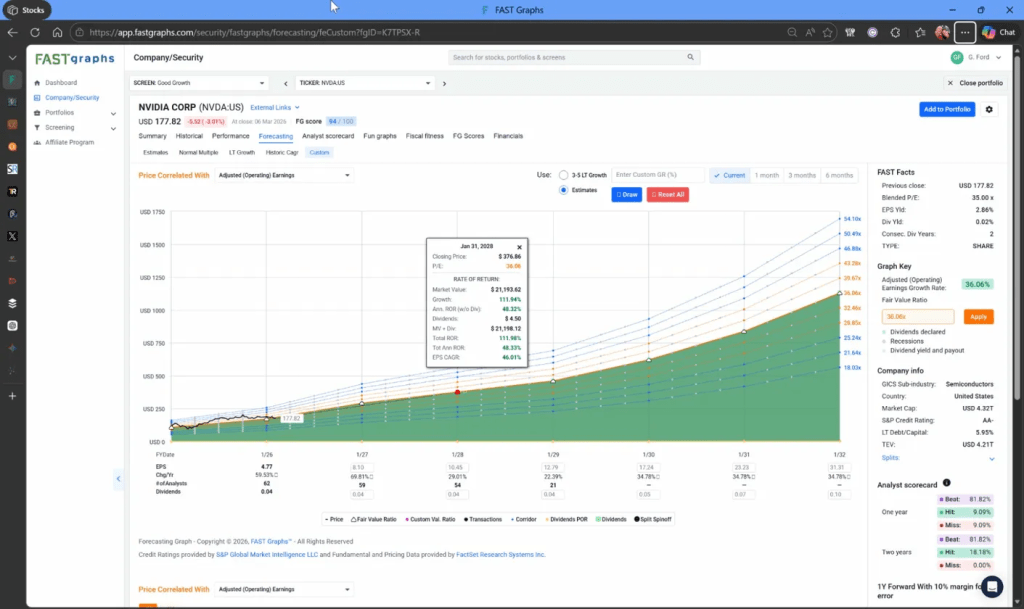
The conservative anchor comes from a blended P/E framework around 35x, which puts near-term fair value around $190. That’s the floor for a “what if growth disappoints” scenario. The mid anchor is an independent research firm’s $240 estimate, which tends to be slower-moving and less momentum-driven than sell-side targets. The Street cluster runs from $260 to $300 among major banks, with one bull case reaching $360 on the high end. Mean consensus target sits around $262.
For the internal anchor, I’m using fiscal 2026 operating cash flow of $102.7 billion, subtracting roughly $6.1 billion in capex, and applying a conservative capitalization rate that accounts for rising capex in FY27 and some deceleration in the growth trajectory. That gets me to the high $270s. Blending 60% internal models with 40% Street consensus produces a practical fair value of about $267 and a 12-month price target of $268.
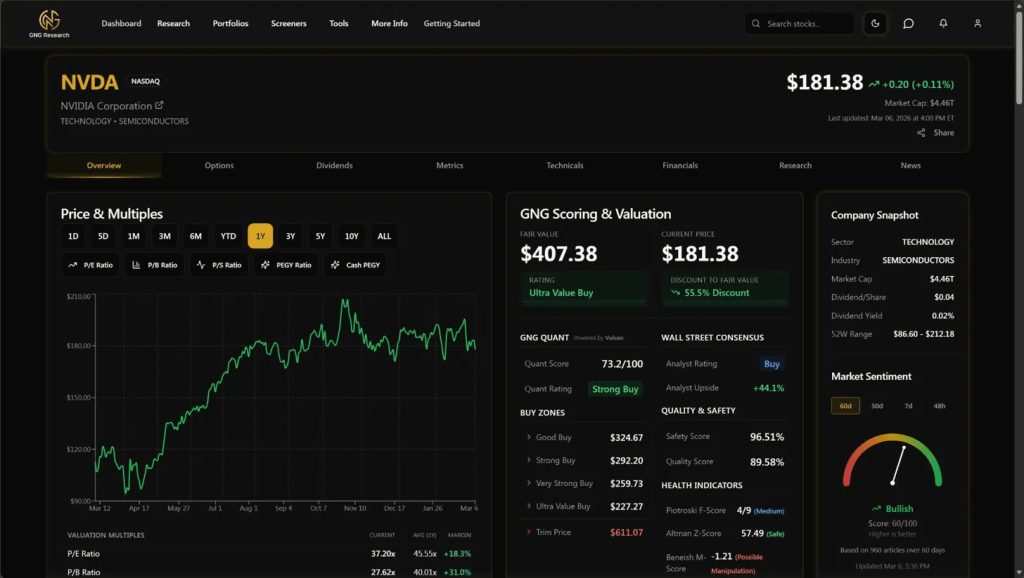
The GNG Research system rates NVDA as a Strong Buy with a Quant Score of 73.2/100, Safety Score of 96.51%, and Quality Score of 89.58%. The Piotroski F-Score of 4 (Medium) and Beneish M-Score of -1.21 (Possible Manipulation flag) are worth watching but don’t override the broader quality picture given the extraordinary growth distortions in NVIDIA’s recent financials.
The Plan: How I’m Playing This
I’d buy NVDA in the $175 to $183 zone, which is where price sits today. I’d add harder in the $169 to $175 zone. I’d only chase strength after a daily reclaim of $183 to $185 on volume. Position sizing: 1 to 2% of portfolio per tranche, with a hard cap at the level appropriate for a high-beta mega-cap in a concentrated AI trade.
My invalidation trigger is a clean loss of $169 on volume combined with deteriorating FY27 demand visibility. That would signal the market is pricing something worse than a temporary technical correction. If $169 breaks in a macro stress environment, I’d expect a test of $155 to $162, and I’d re-evaluate the entire thesis at that point rather than averaging into a changing fundamental story.
On the upside, I’d begin trimming in the $260 to $290 range unless the FY27 revenue path re-accelerates enough to justify lifting the fair value estimate.
Peer Context: Not Cheap, But Not the Craziest Multiple Either
Among AI semiconductor peers, NVIDIA’s valuation looks reasonable relative to its growth. TSM trades around 32.7x earnings with slightly higher margin of safety. AMD screens richer at about 73.5x. Broadcom sits around 69.4x. MU looks cheaper at 35.2x but carries far more cyclical earnings risk. NVIDIA at roughly 36x trailing earnings, with 91.5% ROIC and 65% revenue growth, isn’t cheap in absolute terms. But relative to the quality and growth on offer, it’s arguably the best risk-adjusted entry in the entire AI supply chain right now. The stock is no longer in the euphoric zone where only perfection works. It’s in the zone where good execution plus a stabilized tape can produce very attractive returns from here.
Scenario Framework
Base case (55% probability): AI infrastructure demand remains strong, Blackwell and Rubin sustain architectural leadership, enterprise and sovereign AI broaden the customer base, and FY27 growth decelerates from extreme levels but remains elite. Stock rerates toward $235 to $285. My point target is $268.
Bear case (25% probability): Export controls widen further, hyperscaler digestion lasts longer than feared, and technical damage persists. Stock trades $150 to $170, roughly -4% to -16% from here.
Bull case (20% probability): GTC refreshes sentiment, Rubin visibility strengthens, margins hold near 75% longer than feared. Stock reaches $300 to $360, a potential double from current levels.
The Bottom Line
NVIDIA is still one of the best businesses in the world. It’s just not one of the cleanest charts in the world right now. That split is exactly why the stock is interesting. The engine is running at full throttle: 91.5% ROIC, 55.6% net margins, $96.7 billion in free cash flow on a company growing revenue 65% annually. The track has cracks: customer concentration, export control damage, $95.2 billion in supply obligations, and a tape that hasn’t found a bottom.
I own it here, and I’m adding in layers. The math at a 16.7x forward P/E for this quality of business is compelling enough to start building. But the discipline of staged entries is what turns a great thesis into a great trade. Buy the engine. Respect the road. Build your position in the zones where the surface is solid.
Master Metrics Table
| Metric | Value |
|---|---|
| Price (as-of March 6, 2026) | $177.82 |
| Revenue FY26 | $215.9B |
| Q4 FY26 Revenue | $68.1B |
| Q4 Data Center Revenue | $62.3B |
| FY26 GAAP Gross Margin | 71.1% |
| Q4 GAAP Gross Margin | 75.0% |
| FY26 Operating Cash Flow | $102.7B |
| FY26 Capex | ~$6.1B |
| Simple FCFF Proxy | ~$96.7B |
| Net Margin | 55.6% |
| Operating Margin | 60.4% |
| ROIC | 91.5% |
| Return on Equity | 76.3% |
| Cash + Marketable Securities | $62.6B |
| Debt / Equity | 0.1 |
| Interest Coverage | 547x |
| Altman Z-Score | ~57 |
| Piotroski F-Score | 4 |
| Forward P/E (NTM) | 16.7x |
| PEG Forward | 0.7 |
| 5Y EPS Growth Estimate | 33.3% |
| Customer Concentration | 22% + 14% of FY26 revenue |
| H20 Inventory Charge | $4.5B |
| Supply/Capacity Obligations | $95.2B |
| Vulcan Quality Score | 100 |
| Vulcan Growth Score | 100 |
| GNG Quant Score | 73.2/100 |
| Mean Analyst Target | ~$262 |
| Practical Blended Fair Value | ~$267 |
| 12-Month Price Target | $268 |
| Primary Buy Zone | $175 to $183 |
| Stronger Buy Zone | $169 to $175 |
| Deep Dislocation Zone | $155 to $162 |
| Initial Trim Zone | $260 to $290 |
| Invalidation Trigger | Clean loss of $169 on volume + deteriorating FY27 visibility |
Position Disclosure
I hold NVDA as a core position and am actively accumulating in the $175 to $183 zone as described above. GOOGL and NVDA are my two largest holdings. I manage a family fund as the primary income source and publish systematic equity analysis across 5,000+ tickers.
About the Author
For more research articles, visit GNG Research and Vulcan Stock Research where I publish comprehensive stock analysis across multiple sectors.
Follow me on X: Vulcan Stock Research (@VulcanMK5)
Disclosure: This article is for informational purposes only and should not be considered investment advice. The author holds positions in securities discussed. Always conduct your own research and consult with a financial advisor before making investment decisions.
Data as of: March 7, 2026
References
- NVIDIA Investor Relations, Q4 and Fiscal 2026 Earnings Release, nvidianews.nvidia.com
- NVIDIA Corporation 10-K Filing (FY2026), SEC.gov
- StatMuse Money, NVDA Stock Returns
- Business Insider, Wall Street price target coverage
- Investing.com, Morgan Stanley analyst note
- TheStreet, Wedbush analyst price target
- Vulcan-mk5 Unified Stock Database
- GNG Research Terminal
- TrendSpider Technical Analysis Platform
- FastGraphs Forecasting Tool


Leave a comment