
The quality is undeniable. The chart is broken. Here’s my game plan.
Down 56% in twelve months. Sentiment score of 1 out of 100. Short interest in the high teens. And yet the business just pre-announced Q4 results at or above the high end of guidance with DAU growth still running 30% year-over-year.
This is exactly the kind of disconnect that makes my screens light up. But there’s a problem: the trend is still broken, and catching falling knives is how portfolios get destroyed. So I’m watching from the sidelines with a very specific entry plan.
What Duolingo Actually Does
Forget the gamified owl memes for a moment. Duolingo is a subscription software machine that happens to teach languages. The company has built what might be the stickiest consumer app on the planet: over 50 million daily active users voluntarily open the app every single day to maintain their streaks and complete lessons. That’s engagement metrics most SaaS companies would kill for.
The business model is elegant. Free users see ads and have limited features. Paid subscribers (now north of 11 million) get unlimited access, no ads, and premium features like unlimited hearts and personalized review sessions. The company also runs the Duolingo English Test, which is increasingly accepted by universities as an alternative to the TOEFL. Revenue is growing at 29% annually with a path to $1.2 billion in forward sales.
What makes this special isn’t the growth rate alone. It’s the margin structure. Duolingo generates 72% gross margins and has crossed into material free cash flow territory: $348 million in trailing twelve-month FCF on $964 million in revenue. That’s a 36% FCF margin. For context, many mature software companies would celebrate getting to 25%.
Why the Quality Metrics Are Exceptional
My Vulcan-mk5 screening system rates DUOL at Quality Score 90 out of 100. That’s elite company.
The numbers tell the story. Return on invested capital sits at 27.6%, meaning management is generating serious value from every dollar deployed. The balance sheet is pristine: debt-to-equity of just 0.1 with net cash of $21.28 per share. The company carries no meaningful debt and has a current ratio of 2.8, meaning it can cover short-term obligations nearly three times over. The Altman Z-Score of 8.7 puts bankruptcy risk at essentially zero.
Predictability scores are mixed: FAST Graphs rates overall predictability at just 6/100 given DUOL’s shorter public history, though the subscription model generates real, recurring cash flows. This isn’t a story stock running on hope. It’s a proven cash machine that just happens to be trading like the business is broken.
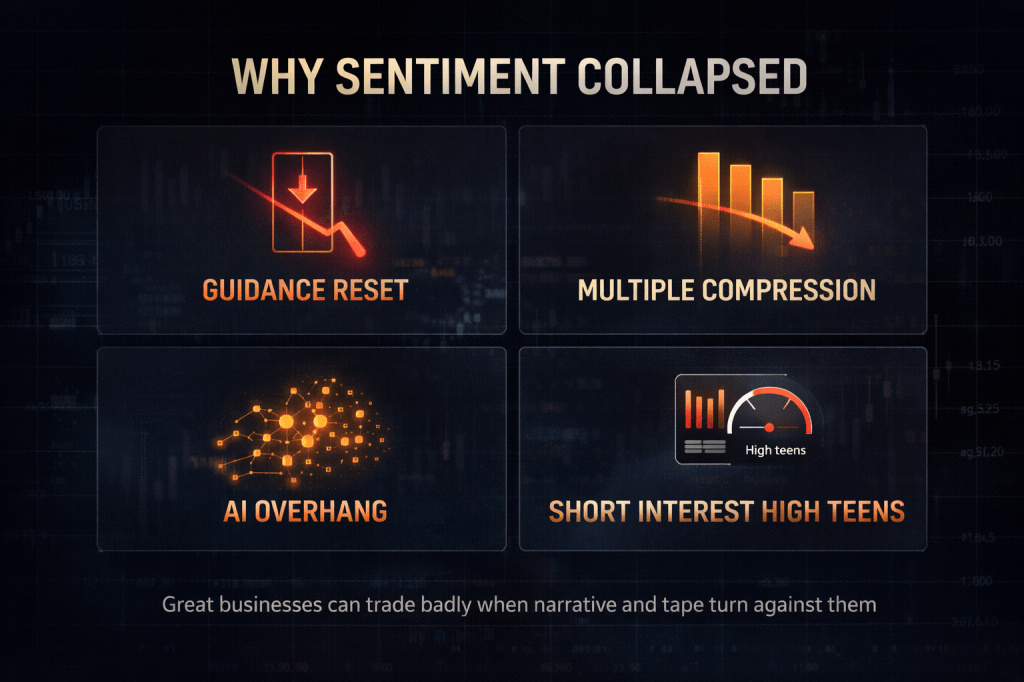
Why Sentiment Is This Bad (And What’s Actually Broken)
The market isn’t debating whether Duolingo’s product works. Everyone knows it works. The debate is about three specific concerns.
First, growth durability. The November earnings report was a textbook “beat the numbers, miss the narrative” event. DUOL reported Q3 revenue of $271.7 million, beating estimates by $11 million. Adjusted EBITDA hit a record $80 million. But Q4 bookings guidance of $329.5 to $335.5 million came in below the Street’s $343.6 million expectation. Bookings is the leading indicator for subscription businesses, so a weaker guide reads as growth deceleration.
Second, multiple compression. Even quality growth companies face repricing when the market decides duration is shortening. DUOL traded at eye-watering multiples during the pandemic boom. The stock peaked above $540 in May 2025. The quality of the business hasn’t changed, but the multiple has collapsed from speculative to reasonable.
Third, the AI overhang. Whether justified or not, “AI makes language learning obsolete” has become a headline risk that institutional investors can’t ignore. CEO Luis von Ahn has addressed this directly, arguing that AI actually enhances Duolingo’s product rather than replacing it. But headline risk drives de-risking, and de-risking drives selling.
The result: Sentiment Score of 1, the lowest possible reading. Twelve-month return of negative 56%. Max drawdown of 72%. Short interest reportedly in the high teens as a percentage of float.
What the Valuation Actually Says
Here’s where it gets interesting. Stock Rover calculates fair value at $207.39, implying 38% margin of safety at current prices around $150. My own DCF work, using conservative assumptions (20% five-year FCF growth, 10% discount rate, 3.5% terminal growth), generates a base case fair value in the low $200s.
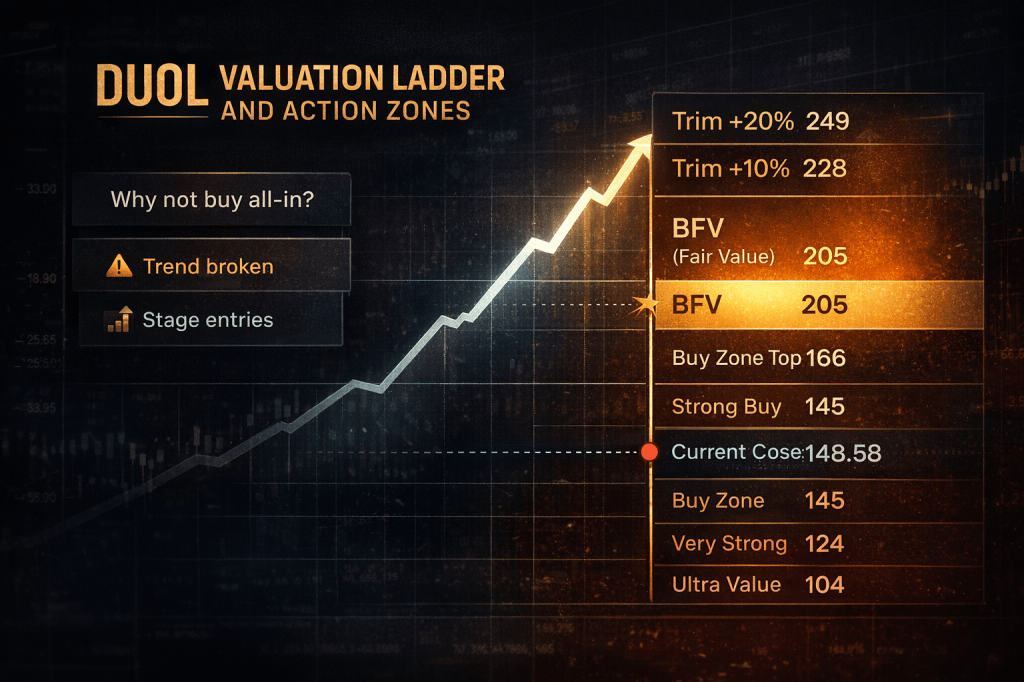
The Vulcan blended fair value (BFV) lands at $205. At today’s price of roughly $148.58, that’s 38% upside to fair value.
But here’s my rule: valuation alone is not an entry signal when the trend is this broken. I’ve learned the hard way that cheap can get cheaper when momentum is negative and sentiment is washed out. The stock is making lower lows, trading well below its 50-day and 200-day moving averages, and showing no signs of base formation yet.
My Specific Entry Plan
I’m not initiating a position today. Here’s exactly what I’m waiting for.
Trigger A (Technical Repair): Price reclaims and holds above the 50-day exponential moving average, currently around $198 (EMA50 per Stock Rover), with confirming volume. This would signal the first evidence of buyers stepping in at scale.
Trigger B (Earnings Confirmation): A clean Q4 report on February 26, 2026 that meets or beats the preliminary numbers, combined with stable or improving Q1 guidance language. The preliminary DAU and bookings update suggests this is likely, but I want confirmation before committing capital.
Trigger C (Higher Low Formation): Price holds the current $145-150 zone and forms a recognizable higher low on the daily chart. This would be the earliest technical evidence that selling exhaustion is setting in.
Once any of these triggers fires, I’ll initiate a starter position (1/3 of full allocation) and scale from there.
Position Sizing and Buy Zones
Given the volatility profile (1Y vol of 0.69, 1Y beta of 1.46 per Stock Rover), this is not a name I’d overweight. My max allocation would be 3% of portfolio even with full conviction.
Here are my BFV-derived buy zones:
- Initial Buy Zone: $166 or below (0.80x BFV)
- Strong Buy: $145 or below (0.70x BFV)
- Very Strong: $124 or below (0.60x BFV)
- Ultra Value: $104 or below (0.50x BFV)
At current prices around $148, we’re already in Strong Buy territory on valuation. The issue is the trend, not the price.
Five Specific Risks I’m Watching
1. Guidance resets continue. If management guides Q1 2026 bookings below consensus, the stock could leg lower regardless of Q4 results. Near-term growth concerns are real.
2. Multiple compression isn’t done. The forward P/E of 18.9 and EV/Fwd EBITDA of 15.5 (trailing EV/EBITDA is 49.2) are reasonable but not cheap for a company where growth is decelerating. Further compression is possible.
3. CFO transition creates uncertainty. Matt Skaruppa stepping down after six years as CFO is not a red flag per se, but executive transitions during periods of weakness add noise. The new CFO, Gillian Munson, takes over February 23.
4. The AI narrative escalates. If competitive AI language tools gain meaningful traction (ChatGPT-based tutoring, real-time translation improvements), the bull case for Duolingo’s moat weakens.
5. Reflexive selling continues. High short interest combined with broken charts can create self-reinforcing downtrends. The stock could overshoot fair value to the downside before stabilizing.
Why I’m Confident This Eventually Works
The thesis is straightforward: a 90th percentile quality business with 36% FCF margins, no debt, and still-growing revenues is trading at a 38% discount to fair value because the chart is broken and sentiment is washed out.
This is the setup that historically produces the best risk-adjusted entries: quality companies in temporary distress, selling below intrinsic value, with identifiable repair triggers. I’m not predicting when the turn happens. I’m building a plan to act when it does.
The pre-announced Q4 metrics support the base case. DAU growth of 30% year-over-year and bookings at or above the high end of guidance means the business is executing even as the stock prices in disaster. That divergence is what I’m betting on narrowing.
If the February earnings confirm stability and the chart starts to heal, I’ll be building a full position. If guidance deteriorates further or the technical picture worsens, I’ll stay patient. Either way, DUOL is on my watch list with a clear action plan.
The quality is there. The price is there. Now I’m waiting for the chart to stop making me feel like I’m volunteering to be someone else’s exit liquidity.
Master Metrics Table
| Metric | Value |
|---|---|
| Price (Jan 20, 2026) | $148.58 |
| Vulcan BFV | $205 |
| Upside to BFV | +38% |
| Market Cap | $6.9B |
| Stock Rover Fair Value | $207.39 (implied from 38% MoS) |
| Quality Score | 90/100 |
| Growth Score | 76/100 |
| Value Score | 67/100 |
| Sentiment Score | 1/100 |
| Sales (TTM) | $964M |
| Sales Growth (1Y) | 28.9% |
| Gross Margin | 72.0% |
| Operating Margin | 11.0% |
| Net Margin | 40.0% |
| FCF (TTM) | $348M |
| FCF Margin | 36.1% |
| P/FCF | 20.8 |
| ROIC | 27.6% |
| Fwd P/E | 18.9 |
| EV/Fwd EBITDA | 15.5 |
| EV/EBITDA (TTM) | 49.2 |
| Debt/Equity | 0.1 |
| Net Cash/Share | $21.28 |
| Current Ratio | 2.8 |
| Altman Z-Score | 8.7 |
| Piotroski F-Score | 5 |
| Beta (1Y, Stock Rover) | 1.46 |
| 1Y Volatility | 0.69 |
| Max Drawdown (1Y) | -72.2% |
| 12M Return (as of Jan 19) | -56.1% |
| Analyst Mean Target | ~$263-271 (varies by source) |
| Next Earnings | Feb 26, 2026 |
| EMA50 | $197.81 |
| EMA150 | $265.24 |
Data as of: January 20, 2026 Recommendation: BUY (staged, on technical repair triggers) Risk Level: High Max Allocation: 3%
Disclosure: I do not currently hold a position in DUOL. This analysis represents my personal research and is not financial advice. Always conduct your own due diligence.


Leave a comment