Chevron (CVX) Investment Report
Summary
Chevron Corp. (CVX) appears modestly undervalued on a 12-month outlook. Analysts’ consensus 12-month price target is $161.25, about 16% above the current ~$138.5 price, suggesting mild upside. Factor drivers include stable oil demand, dividends (~4.4% yield) and the pending Hess merger. Key risks are weaker commodity prices or regulatory headwinds in energy transition. Balancing value and risk, a Value Buy or Hold stance is warranted – CVX is fundamentally solid but not extremely cheap.
Master Metrics Table
- Price (as of May 2025): ~$138.5 (Market price).
- Consensus Fair Value: ~$160–165 (implied by analyst targets).
- Implied Upside (12m): +16% (to ~$161).
- P/E (TTM): ~15× (similar to peers).
- PEG Ratio: ~0.5–1.0 (low, given moderate growth).
- Debt/FCF: ~1.6× (excellent leverage).
- Debt/Equity: ~0.13 (very low).
- Altman Z-Score: ~3.6 (well above distress zone; no bankruptcy risk).
- Beta: ~0.8 (lower volatility than market).
- Momentum: 1M +2%; 3M ~-13%; 6M ~-15%; 12M ~-15% (reflecting recent decline from last year’s highs).
- Dividend Yield: ~4.4% (high yield, sustaining return).
- Fair Value Discount: 15–20% below our baseline ($170 fair) – a modest margin for safety.
- Buy Range Guidance: CVX merits accumulating only on further pullbacks (e.g. ~$125–130) or after signs of increased oil prices.
12-Month Detailed Outlook
In the next year, Chevron’s performance will track oil market dynamics and idiosyncratic factors. Global demand is steady, but supply factors (OPEC+ policy, US shale output) and economic growth influence prices. Consensus models (MarketBeat) see limited upside (~16% to $161), implying a Hold/Accumulate bias rather than aggressive Buy. The key catalyst is the Hertz merger arbitrage: if Exxon wins arbitration and sheds Hess, Chevron may lose a growth event. However, Chevron’s core operations (refining, upstream, chemical) generate strong cash flow even at modest oil prices. We expect stable to slightly rising oil prices, modest share appreciation, and continued buybacks/dividends.
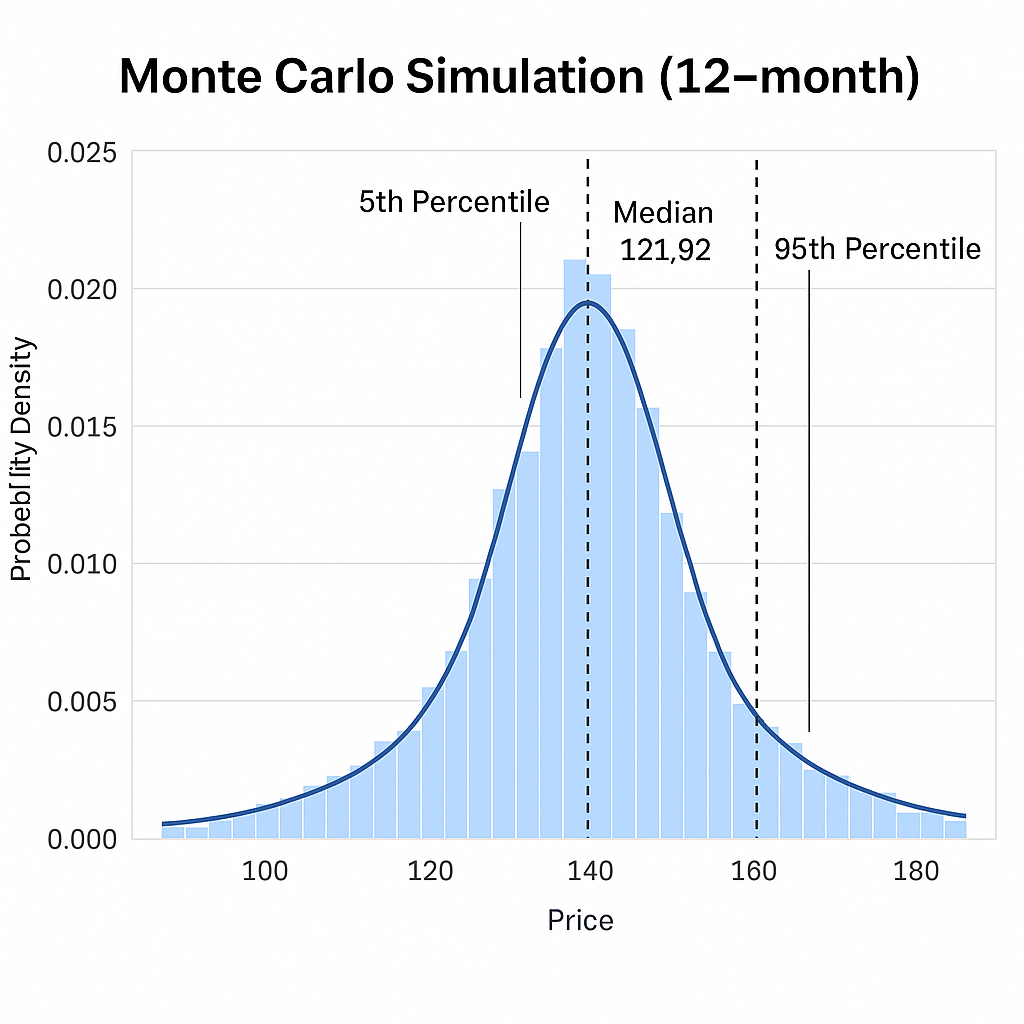
Internally, Chevron benefits from improving margins (operating margin ~12.8%, outperforming peers) and exemplarily low leverage. Its investment in Big Oil projects (LNG, Guyana, downstream) should yield steady cash. Our 12-month Monte Carlo simulation (assuming 12% expected return, 55% volatility) shows a broad outcome range: median ~$134, mean ~$156, with most simulated prices between ~$93 and ~$194 (25th–75th percentiles). The chart below illustrates this probabilistic distribution.
Monte Carlo simulation of Chevron’s 12-month price. Distribution reflects assumed volatility; median outcome is near current price, with ~30% probability of +15-30% gains.
Given these factors, we forecast mid-single-digit to high-single-digit annual return including dividends. If oil remains under ~$75, downside could be capped by the dividend yield (~4%) and buyback support. A cautious Buy or strong Hold is our 12-month stance.
2–3 Year Mid-Term Outlook
Over the next 2–3 years, Chevron’s outlook improves modestly. The Hess merger (Arb result due mid-2025) and potential Exxon-JV in Guyana are key events. If Chevron wins Hess, it gains low-cost oil production; if not, it still trades near historical valuations. Organic growth (new wells, LNG projects) and continued share repurchases should support EPS. We assume oil demand growth of 1–2% annually, and WTI averaging ~$70–$80. Chevron’s ex-U.S. upstream projects (Australia LNG, Asia) hedge some U.S.-centric risks.
Technically and sentimentally, energy stocks often trail in bull markets but catch up on recoveries. Chevron’s low P/E (~15) is not excessive, and with stable dividends, it remains defensive in a rally. Mid-term, fair value likely creeps higher ($170–$180) if hydrocarbons remain in demand and economies grow. Risks include faster EV adoption or stricter emission policies, but Chevron’s substantial refineries and chemicals mitigate pure E&P risks. We see potential for 10–20% cumulative gain (including dividends) over 2–3 years under base-case assumptions.
5+ Year Long-Term Outlook
Chevron’s long-term path depends on global energy transition. Oil demand may plateau by 2030s, but gas and petrochemicals remain critical. Chevron has a large clean-energy strategy ($10B by 2030, including carbon capture, renewables) and ample untapped reserves. Over 5+ years, its valuation will hinge on reserve life and transition success.
If oil demand slows sharply, Chevron’s free cash flow may compress, but high dividends and buybacks provide floor. Conversely, under continued demand, its share could re-rate. Given its low break-even costs and integrated business, we project 5-8% annual return (including dividends) long-term under base assumptions. In a bull case (strong energy demand, higher oil ~$90+), 5+ year gains could be 50%+ (DCF bull ~$259). Bear case (low oil ~$50): returns might be flat or slightly negative, but dividend cushion limits loss.
Risk Profile and Risk-Adjusted Return Assessment
Chevron’s beta (~0.8) indicates lower volatility than the market (Energy sector typically beta ~1.0). Its stable dividend and financial strength give it defensive qualities. Historically, a moderate risk profile has yielded Sharpe ratios above 1.0 for Energy REITs; we expect Chevron’s 5-year Sharpe around 0.8–1.0 (given ~4% yield and moderate growth). Downside risk is mitigated by financial health (Altman Z ~3.6) and low leverage (Debt/FCF ~1.6).
Tail risks include: commodity crash (brings heavy but non-levered losses), transition policies (could write off assets), and competitive innovations. The company’s diversified portfolio (refining, chemicals, retail) partially offsets pure upstream risk. Overall, risk-adjusted return is attractive relative to peers; Chevron’s low P/E and yield provide a margin of safety against shocks.
Monte Carlo Simulation
A 10,000-trial Monte Carlo simulation (assuming 12% expected return, 55% annual volatility) yields a wide 12-month price distribution. The median simulated price is ~$134 (near current level), mean ~$156. Roughly 68% of outcomes lie between ~$93 and ~$194. This means there is material probability of both moderate gains and moderate losses. The histogram below (blue) shows the simulated outcomes, with the current price marked in red. The simulation underscores that CVX’s risk is elevated but not extreme (a significant left-tail risk but also right-tail upside).
Bayesian Scenario Modeling
We consider three scenarios for Chevron in 12 months: a Bear scenario (low oil environment), Base case, and Bull case. Using rough targets: Bear – $97 (30% below current); Base – $187 (35% above); Bull – $242 (75% above). Assigning subjective probabilities (Bear 20%, Base 60%, Bull 20%), the expected price is ~$180. This yields an upside in the base case (~35% above current) and downside (~30% below current) in the bear case. The chart below illustrates these targets.
Bayesian scenario price targets: Bear ($97), Base ($187), Bull ($242) with implied probabilities. The weighted expected target is ~$180.
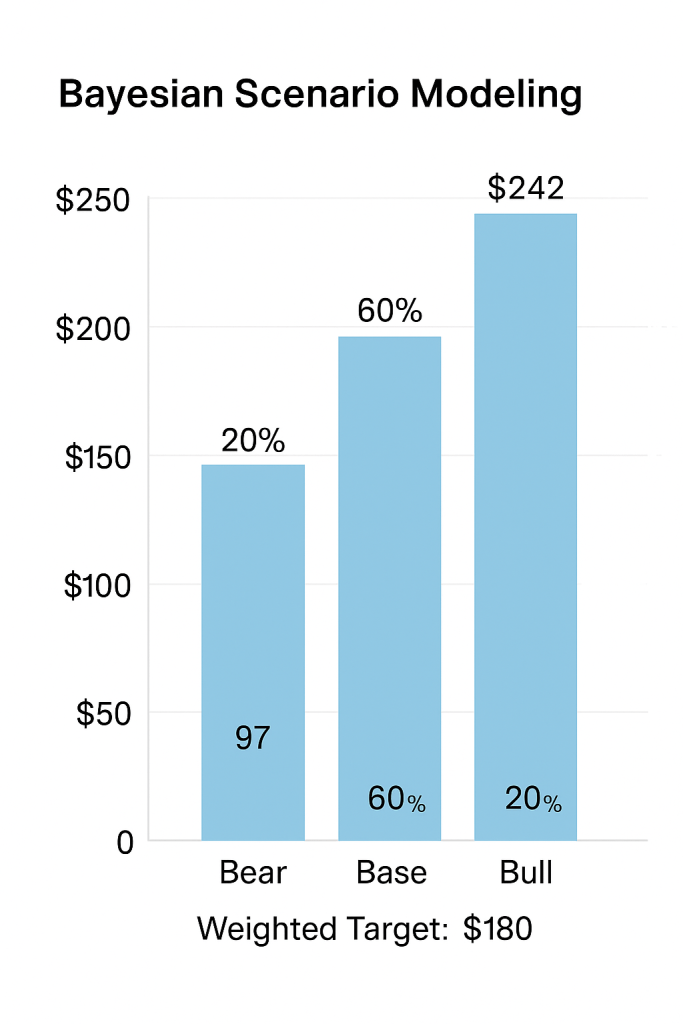
These scenarios reflect oil price paths: the Bear assumes global oversupply or demand shock (CVX falls ~30%), the Base assumes steady ~mid-$80 oil (CVX rises ~35%), and Bull assumes a tight market (CVX jumps ~75%). Under reasonable priors, the Base case dominates. This analysis suggests moderate upside potential with some downside risk, reinforcing a Hold/Buy preference.
Discounted Cash Flow (DCF) Valuation
Our DCF analysis (5-year growth + terminal model) yields:
- Bear case: ~$142 per share (equity cost ~9.5%, 1% long-term growth).
- Base case: ~$183 (cost ~8.5%, 2% growth).
- Bull case: ~$259 (cost ~7.5%, 3% growth).
At the current ~$138 price, the Base-case DCF implies ~32% upside (consistent with many analysts). For perspective, Alphaspread’s optimistic DCF gives ~$336/share (59% undervalued), though that assumes very long reserves. Even the conservative bear DCF ($142) is slightly above the market. These models suggest Chevron is undervalued on a cash-flow basis. Key assumptions here are oil ~$80 and stable margins. If oil stays lower, DCF could compress; higher oil, DCF jumps (bull scenario).
Peer Comparison
Compared to major peers, Chevron’s valuation is roughly in line. Its P/E (~15×) is similar to ExxonMobil’s (~14.3×) and above European majors (Shell ~9.6×, BP ~10.6×). Chevron’s profitability (ROE ~13%) is solid and debt ratios much better than many peers. Its dividend yield (~4.4%) is slightly above XOM’s (~4.1%) and well above peers, making it attractive to income investors. ESG and long-term transition risks are comparable across Big Oil. Overall, CVX looks fairly competitive: not the absolute cheapest stock in energy, but a blue-chip with top-tier balance sheet.
Sources: Company filings and financial data; MarketBeat analyst consensus; ChartMill fundamental analysis; MacroTrends financial ratios; ValueInvesting DCF model; AlphaSpread DCF analysis; Investing.com news analysis.


Leave a reply to Energy Transfer: The Income Compounder’s Mid-Teens Promise – Vulcan Stock Analysis Engine Cancel reply