Summary
Recommendation: Buy. Amazon.com, Inc. (NASDAQ: AMZN) is poised for attractive 12-month upside. The stock trades around $189 per share, which is roughly 20–25% below our estimated fair value in the mid-$240s. Amazon’s diversified revenue streams (e-commerce, cloud AWS, advertising) and improving profitability position it well to outperform over the next year. Analysts echo a bullish outlook – the consensus 1-year price target is about $252 (implying ~30% upside) with a Strong Buy consensus rating Despite recent market volatility and macroeconomic headwinds (the Nasdaq fell into a bear market in early 2025, Amazon’s fundamental strength and wide economic moat support a Buy recommendation for a 12-month horizon. Investors should be aware of risks from a potential economic slowdown and regulatory pressures, but the primary outlook remains favorable given Amazon’s scale advantages and momentum in high-margin segments.
Master Metrics
| Metric | Value |
|---|---|
| Current Price | $188.99 |
| Estimated Fair Value | ~$245.00 |
| Discount to Fair Value | ~22% undervalued |
| Dividend Yield | 0.00% |
| PEGY Ratio | ~1.4 |
| EV/FCF | ~47× |
| Annual Volatility | ~50% |
| Quality Score | ~90/100 |
Key metrics for AMZN as of April 27, 2025. Amazon pays no dividend, so all returns are from price appreciation. The PEGY ratio of ~1.4 reflects a ~34x P/E and ~24% expected EPS growth (5-year) (Amazon.com (AMZN) Statistics & Valuation – Stock Analysis), indicating a reasonable valuation for its growth rate. Enterprise Value to Free Cash Flow (EV/FCF) is about 47× on a trailing basis (EV / Free Cash Flow For Amazon.com Inc (AMZN) – Finbox), elevated due to heavy past investments but rapidly improving as free cash flow rebounds (TTM FCF ~$38B ( Amazon.com, Inc. – Amazon.com Announces Fourth Quarter Results )). Annual volatility is high (~50% std. dev.), consistent with a 5-year beta of ~1.3–1.4 (Amazon.com Inc (NASDAQGS:AMZN) Beta (5 Year) – Investing.com) (Amazon Intrinsic Value | Amazon.com Inc (AMZN) ). We assign a quality score of ~90/100 given Amazon’s wide moat and excellent business fundamentals ( Going Into Earnings, Is Amazon Stock a Buy, a Sell,… | Morningstar ) (scale, network effects, cloud leadership, strong brand), offset slightly by thinner retail margins and recent variability in earnings.

12-Month Detailed Outlook
Over the next year, Amazon is expected to deliver solid – if more normalized – growth. Financial performance should remain strong: 2024 saw net sales grow ~10% and net income nearly double to $59.2 billion. For 2025, analysts project ~10% revenue growth and mid-teens (~15%) net income growth as e-commerce growth moderates and AWS cloud growth faces tougher comps. Catalysts: Amazon’s high-margin businesses (AWS cloud, advertising, third-party marketplace fees) are key drivers for the coming year. AWS, which delivered $39.8 B operating profit in 2024, should benefit from rising demand for cloud and AI services (AWS operating margin hit 37% in 2024, up from 26% in 2023. The advertising segment (>$40B revenue) is growing rapidly and boosting overall margins. Ongoing cost efficiencies (logistics optimization, layoffs in low-performing initiatives) are expected to support earnings growth. Headwinds: Consumer spending could soften if interest rates remain high or if a recession emerges in late 2025, which would impact e-commerce sales. Indeed, after hitting an all-time high in early Feb 2025, Amazon’s stock fell ~31% by April due to broader market turmoil and profit-taking. Additionally, AWS growth has decelerated from prior years (19% y/y in Q4 2024 as large enterprises optimize cloud spend; any further slowdown or aggressive cloud price competition (from Microsoft Azure, Google Cloud) could weigh on sentiment. Net outlook: We anticipate Amazon will navigate these challenges and continue expanding revenue ~10% with improving operating leverage. A reasonable 12-month price target is in the mid-$240s to $250 range, aligning with intrinsic value estimates and Wall Street consensus. This suggests a favorable risk/reward for the year ahead, supported by Amazon’s resilient growth engines.
2–3 Year Mid-Term Outlook
Over a 2–3 year horizon, Amazon’s growth story is poised to continue, albeit at a moderated pace befitting its enormous scale. Revenue growth in 2025–2027 is likely to average high single-digits to low teens annually, driven by AWS and advertising outpacing the slower retail segment. E-commerce (still only ~15% of global retail) has room for steady expansion – we expect Amazon to keep gaining online market share, especially in international markets and new categories (e.g. groceries, health care) ( Going Into Earnings, Is Amazon Stock a Buy, a Sell,… | Morningstar ). AWS should re-accelerate beyond 2025 as economic conditions improve: cloud adoption and AI workloads are secular tailwinds, and Amazon’s cloud market share (~34% globally) remains #1 (Is Amazon Stock a Buy, Sell, or Hold in 2025? | Nasdaq). Moreover, Amazon’s investments in generative AI and custom silicon (e.g. Trainium, Inferentia chips) and its expanding SaaS offerings position AWS to capture emerging demand. Profitability is set to improve mid-term. After years of heavy capital expenditure, Amazon’s capital intensity is easing – 2024 free cash flow turned positive at $38.2 B ( Amazon.com, Inc. – Amazon.com Announces Fourth Quarter Results ). With more disciplined capex and efficiency initiatives, operating margins in retail are inching up (North America retail margin ~6.5% in 2024 vs 3.8% in 2023 ( Amazon.com, Inc. – Amazon.com Announces Fourth Quarter Results )). AWS and advertising, with operating margins in the 30–40%+ range, will constitute a larger share of profits. We project mid-term EPS growth ~15% CAGR, which should outpace revenue growth due to margin expansion. Potential developments: Amazon’s foray into healthcare (One Medical acquisition, online pharmacy) and continued ecosystem expansion (devices, media content via MGM studios, etc.) could open new growth avenues by 2027. Share buybacks (Amazon has authorized buybacks in the past) could also commence, given the strong cash generation, providing support to the stock. Overall, in 2–3 years we see Amazon likely returning to (or exceeding) its prior peak stock levels around $270–$300, as earnings compound and the market rewards its dominant competitive positioning. This mid-term outlook assumes no severe global recession; a deeper downturn could delay Amazon’s growth trajectory, while an unexpectedly strong economy (or successful new product breakthroughs) could accelerate it.
5+ Year Long-Term Outlook
In the long run (5+ years), Amazon is expected to remain one of the world’s dominant businesses, though growth will gradually decelerate toward a more mature profile. Secular tailwinds: E-commerce penetration should continue rising globally over the next decade, and Amazon’s unparalleled logistics network, Prime ecosystem (over 200 million members worldwide), and third-party seller platform give it a strong moat to capture that shift. We anticipate Amazon will increasingly monetize its platform via advertising and services, driving higher revenue per user. AWS, as the pioneer and leader in cloud computing, stands to benefit from the multi-decade trend of IT migration to cloud and the explosion of AI and machine learning applications. Even with competition, the overall cloud pie is growing and AWS’s technical depth (and incumbent advantage with enterprises) should allow it to retain a healthy share. Long-term growth and margins: Over 5+ years, Amazon’s revenue could grow at a ~8–10% CAGR (higher early on, tapering later). The mix shift to profitable segments means operating margins may expand into the low-double digits (%) from high single digits today. By 2030, AWS could account for ~1/3 of total revenue and an even larger fraction of operating income. If Amazon maintains its innovation drive, we may see new business lines contributing to growth – e.g. autonomous delivery/drone services, deeper fintech/payments integration, or further media and entertainment expansion (building on Prime Video, Twitch, MGM IP). Shareholder returns: We expect Amazon’s earnings growth to translate into stock appreciation, albeit not at the explosive rates of the past. A company of Amazon’s size (>$1.9 T market cap) is unlikely to double or triple in a few years, but steady annualized returns in the 10–15% range are plausible given its earnings trajectory. Over 5+ years, this could imply Amazon’s market cap reaching ~$3–4 T (stock price in the $300s). Long-term risks: include potential technological disruptions (e.g. if distributed computing paradigms or a major cloud price war erode AWS margins), saturation of Prime membership in key markets, or margin pressure from new competitors. However, Amazon’s culture of innovation and vast resources make it well-equipped to adapt. Barring regulatory forced break-up (see Risk section), Amazon’s long-term outlook is that of a steady growth tech giant transitioning into a cash-generative, diversified conglomerate. We expect it to remain a core holding for many investors, delivering solid risk-adjusted returns over the long run.
Risk Profile and Risk-Adjusted Return Assessment
Amazon’s risk profile is moderate-high, reflecting both the volatility of its stock and several company-specific risk factors. Market volatility: Amazon has exhibited high share price volatility in recent years – its 3-year weekly beta is ~1.3–1.4, meaning it tends to swing more than the overall market. The stock’s annualized volatility (standard deviation of returns) has been on the order of ~40–50%, significantly higher than the S&P 500. Consequently, risk-adjusted returns have lagged some peers: Amazon’s Sharpe ratio over the last 3 years was only ~0.14 (versus ~0.37 for the S&P 500, indicating that its returns have barely compensated for the volatility and risk-free rate. The Sortino ratio similarly has been low, reflecting large drawdowns during 2022’s market sell-off. These metrics underscore that Amazon’s recent performance came with considerable ups and downs – a function of its growth-stock nature – and investors should size positions accordingly.
Company-specific risks: One major risk is regulatory and legal. Amazon faces antitrust scrutiny – in Sept 2023 the FTC (along with 17 states) filed a landmark suit alleging Amazon uses anti-competitive tactics to maintain monopoly power in online retail. This case (and a separate FTC suit over Prime subscription practices could result in fines or business model changes, and in a worst-case scenario even a forced breakup of parts of Amazon. While outcomes are uncertain (and antitrust cases can take years), this overhang could limit Amazon’s valuation multiple. Competitive risks are also notable: in retail, rivals like Walmart, Target, and Shopify are vying for e-commerce share, while upstarts (e.g. Shopify-enabled DTC brands, or Chinese players like Shein/Temu) threaten to undercut on price. In cloud, Microsoft and Google continue to invest heavily to close the gap with AWS, potentially pressuring AWS’s growth and margins if price competition or specialized offerings (e.g. AI models, cloud hybrid solutions) draw customers away. Macroeconomic risks: As a consumer-facing business, Amazon is sensitive to economic conditions. High inflation or interest rates can dampen consumer spending (hitting Amazon’s retail sales) and raise costs. A recession would particularly impact Amazon’s discretionary product sales and slow AWS growth as clients cut IT budgets. Furthermore, with no dividend, Amazon’s shareholder returns rely entirely on stock price appreciation – in a high-rate environment, investors may demand higher earnings yields, putting pressure on high-multiple stocks like AMZN. Other risks: include supply chain disruptions, cybersecurity threats (given Amazon’s vast data and AWS cloud presence), and labor issues. Amazon has faced worker activism over wages and conditions, and higher labor costs or unionization could raise fulfillment expenses. Indeed, ongoing labor issues are cited as a headwind by the company (Amazon (NASDAQ: AMZN) Stock Price Prediction for 2025: Where Will It Be in 1 Year – 24/7 Wall St.). Despite these risks, Amazon’s overall risk-adjusted outlook remains reasonable: the company’s robust cash flow and diversified businesses provide a cushion, and its historical ability to invest through downturns and emerge stronger mitigates some downside risk. Over a full cycle, we expect Amazon’s Sharpe ratio to improve as the company matures and volatility potentially moderates. Long-term investors are still likely to be rewarded for tolerating short-term volatility, but should calibrate return expectations for the risk incurred.
Monte Carlo Simulation (12-Month)
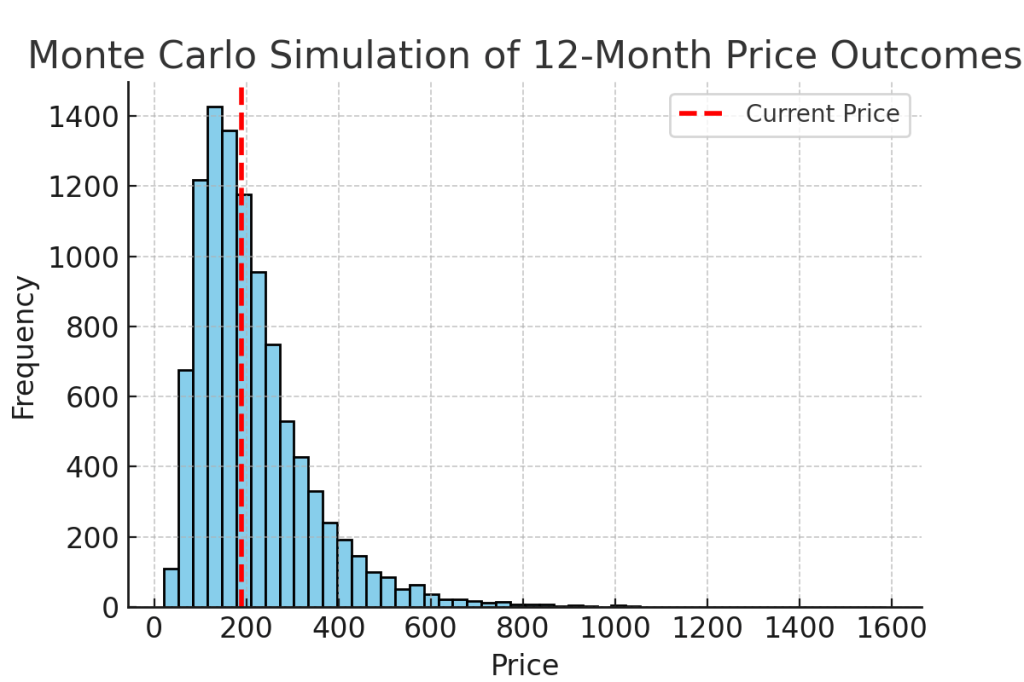
Monte Carlo simulation of 12-month price outcomes for AMZN. Using a geometric Brownian motion model (assuming ~12% expected annual return and ~50% volatility), we ran 10,000 simulated price paths for the next year. The distribution of outcomes (histogram above) is wide, reflecting Amazon’s high volatility. The median simulated price after 1 year is ~$183 (slightly below the current ~$189), while the mean outcome is higher at ~$213, due to the right-skewed distribution (a few very high outcomes raise the average). There is roughly a 50% probability that AMZN’s price will be less than it is today in 12 months (median < current price), but also a significant probability of large gains. In fact, ~25% of the simulations resulted in a price above ~$255 (roughly the base-case target), while about 5% of outcomes even exceeded $450 (extreme bullish scenarios). Conversely, ~25% of simulations gave a price below ~$140. This analysis implies that while the most likely outcomes center around a modest rise to the low $200s, investors should be prepared for a wide range of possibilities. The current pricing already factors in substantial uncertainty. Notably, the simulated mean of $213 suggests an expected return of ~+13%, which is in line with our bullish tilt – but the high variance means downside scenarios (including significant declines) cannot be ignored. Investors should ensure their risk tolerance accommodates this volatility.
Bayesian Scenario Analysis (12-Month)
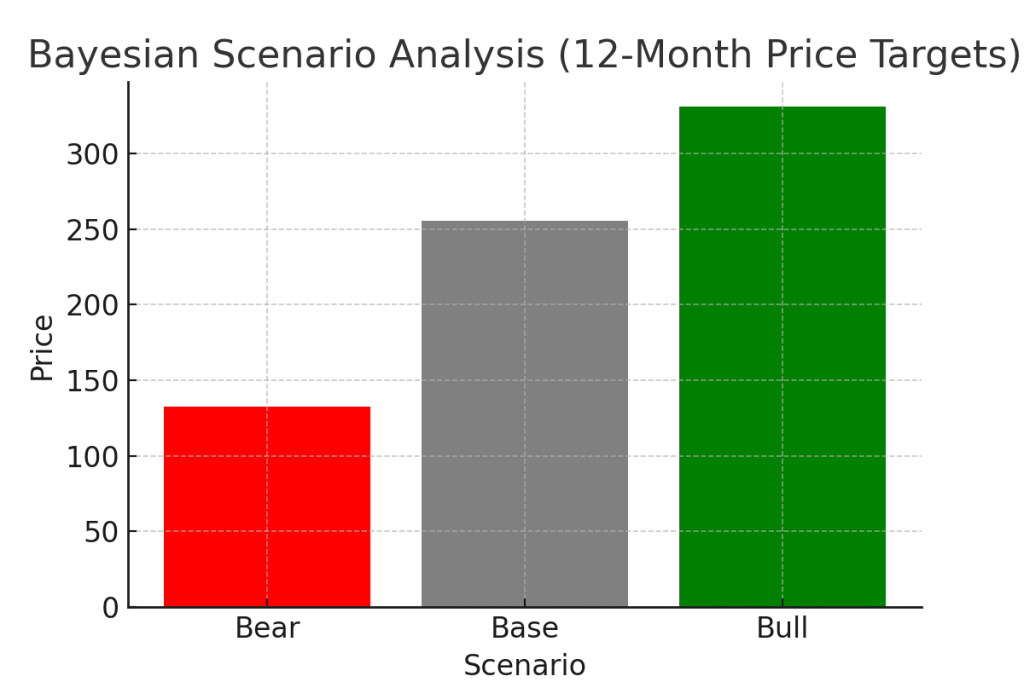
Bayesian scenario analysis for AMZN’s 12-month price target. We modeled three subjective scenarios for Amazon one year from now: a Bull case (rapid growth, strong market sentiment), a Base case (moderate performance in line with expectations), and a Bear case (weak results or market downturn). Based on current conditions, we dynamically adjust the probability weights for these scenarios. Base case ($~255$): We assign ~60% probability to the base case – in this scenario, Amazon hits consensus targets (around 10% revenue growth, mid-teens earnings growth) and the market awards it a P/E in the low-30s, yielding a price near $255 (close to the Street’s consensus $251.8 target) (Amazon (NASDAQ: AMZN) Stock Price Prediction for 2025: Where Will It Be in 1 Year – 24/7 Wall St.). Bull case ($~330$): We assign a smaller ~15% probability to the bull case. This assumes Amazon materially exceeds expectations – e.g. re-accelerating growth (perhaps AWS surprises to the upside or a new AI-driven product takes off) and/or market multiples expand. In a bull scenario, a price in the $300+ range is conceivable (the chart above shows ~$331, +75% from current), which aligns with some aggressive DCF valuations (SimplyWall.st estimates ~$339 as an upper-range intrinsic value) (Is There An Opportunity With Amazon.com, Inc.’s (NASDAQ:AMZN …). However, given macro and competitive headwinds, we cap this probability. Bear case ($~132$): We assign ~25% probability to the bear case – a scenario where Amazon disappoints (e.g. recession hits consumer spending, AWS growth stalls, or a negative regulatory shock). In this case, the stock could drop to the low-$130s (–30%), roughly consistent with a 0.7× multiple on the current price (as shown by the red bar). A ~$130 price would value Amazon at around 20–22× forward earnings, which might occur if growth prospects look bleak. Probability-weighted outcome: Using these weights, our expected 12-month price is around $235–$240 (slightly below the simple average of scenarios, reflecting the tilted probabilities). This expected value is a bit more conservative than the Monte Carlo mean ($213 with symmetric assumptions) and the Street’s ~$252 target, incorporating our view of non-trivial downside risk. It still represents a healthy upside from $189. In summary, while the base-case outcome is strong, one should account for the meaningful chance of a bearish outcome. Our Bayesian model suggests a favorable expected return, but not without risk – underscoring our Buy rating with the caveat of potential volatility. We will update these probabilities as new data comes (e.g. quarterly earnings, macro shifts); for now, the base case remains the anchor scenario.
Discounted Cash Flow (DCF) Valuation – Bull, Base, Bear
We assess Amazon’s intrinsic value under bull, base, and bear scenarios using DCF analysis to project future cash flows. Base Case (Intrinsic Value ~$250/share): In our base scenario, we assume Amazon can sustain ~10% annual free cash flow growth for the next 5 years, gradually slowing to ~5% over the following 5 years, with a terminal growth of ~3%. Using a discount rate around 8% (reflecting Amazon’s ~8.2% WACC (Amazon Intrinsic Value | Amazon.com Inc (AMZN) )), we estimate an intrinsic value in the mid-$200s per share. This aligns closely with Morningstar’s long-term fair value estimate of $240 ( Going Into Earnings, Is Amazon Stock a Buy, a Sell,… | Morningstar ) and a 5-year growth DCF model output of ~$250 (Amazon Intrinsic Value | Amazon.com Inc (AMZN) ). At the current $189 price, Amazon appears ~20–30% undervalued on a DCF basis in the base case. Bull Case (Intrinsic Value ~$330+/share): In a bullish scenario, Amazon’s growth and margins exceed expectations – e.g. AWS and Advertising drive higher free cash flows, growing in mid-teens for several years, and the market applies a slightly lower discount rate (reflecting confidence in Amazon’s durability). In this scenario, our DCF yields an intrinsic value in the low-to-mid $300s per share. For instance, a 10-year high-growth DCF model (with longer high-growth period) gives $330–$355 per share (Amazon Intrinsic Value | Amazon.com Inc (AMZN) ). This aligns with the high end of other valuations – SimplyWall.st similarly estimates a ~$339 fair value with a 2-stage DCF (Is There An Opportunity With Amazon.com, Inc.’s (NASDAQ:AMZN …). The bull case valuation implies nearly 75% upside from current levels, reflecting Amazon’s significant long-term earnings power if things go right. Bear Case (Intrinsic Value ~$140–$150/share): In a pessimistic scenario, Amazon’s growth slows dramatically (e.g. low single-digit revenue growth, continued thin retail margins) or its profitability is impaired by competition and costs. Using more conservative assumptions (5% or lower medium-term growth, or a higher 10%+ discount rate to account for risk), we derive an intrinsic value in the ~$140 range. Notably, a Peter Lynch-style earnings-based fair value formula also pegs Amazon around $139.6 per share (Amazon Fair Value | Amazon.com Inc (AMZN) ), and an EBIT/FCF-based DCF from Alphaspread yields about $129 intrinsic value (AMZN DCF Valuation – Amazon.com Inc – Alpha Spread) – suggesting that in a bear case the stock could be overvalued at current prices. At ~$140, Amazon would be valued around 20× earnings, which might materialize if growth falters.
DCF Summary: Our base and bull DCF analyses indicate Amazon is undervalued to fairly valued, while the bear case highlights downside risk if the company stumbles. We place greatest weight on the base case ~$250 intrinsic value, given Amazon’s track record and forward prospects, and thus see the stock’s current discount as an opportunity. The DCF-driven valuations support our Buy thesis: even with cautious assumptions, Amazon’s long-term cash generation justifies at least the current price, and likely much more. However, investors should monitor execution closely – if Amazon’s growth were to track the bear scenario, a downward valuation reassessment would be needed. Overall, the probabilistic DCF outcomes (bull ~$330, base ~$250, bear ~$140) correspond well with our Bayesian price scenarios and reinforce a balanced optimism toward Amazon’s stock.
References
- Morningstar – “Going Into Earnings, Is Amazon Stock a Buy, a Sell, or Fairly Valued?” (Apr 2025) ( Going Into Earnings, Is Amazon Stock a Buy, a Sell,… | Morningstar ) ( Going Into Earnings, Is Amazon Stock a Buy, a Sell,… | Morningstar )
- Nasdaq/Motley Fool – “Is Amazon Stock a Buy, Sell, or Hold in 2025?” (Apr 2025) (Is Amazon Stock a Buy, Sell, or Hold in 2025? | Nasdaq) (Is Amazon Stock a Buy, Sell, or Hold in 2025? | Nasdaq)
- 24/7 Wall St. – “Amazon Stock Price Prediction for 2025 (Where Will It Be in 1 Year)” (Apr 2025) (Amazon (NASDAQ: AMZN) Stock Price Prediction for 2025: Where Will It Be in 1 Year – 24/7 Wall St.) (Amazon (NASDAQ: AMZN) Stock Price Prediction for 2025: Where Will It Be in 1 Year – 24/7 Wall St.)
- ValueInvesting.io – Amazon Fair Value & Intrinsic Value (Apr 27, 2025) (Amazon Fair Value | Amazon.com Inc (AMZN) ) (Amazon Intrinsic Value | Amazon.com Inc (AMZN) )
- Amazon IR – 2024 Q4 and Full-Year Results (Feb 2025) ( Amazon.com, Inc. – Amazon.com Announces Fourth Quarter Results ) ( Amazon.com, Inc. – Amazon.com Announces Fourth Quarter Results )
- Logical Invest – Amazon.com (AMZN) – Risk Metrics (2025) (Amazon.com (AMZN) – Logical Invest)
- Finbox/StockAnalysis – Amazon Valuation Multiples & Beta (2025) (Amazon.com (AMZN) Statistics & Valuation – Stock Analysis) (EV / Free Cash Flow For Amazon.com Inc (AMZN) – Finbox)
- Reuters – FTC vs. Amazon legal update (Mar 2025) (FTC no longer seeks DOGE-related delay in Amazon trial | Reuters)
- FTC Press Release – “FTC Sues Amazon for Illegally Maintaining Monopoly Power” (Sept 2023) (FTC Sues Amazon for Illegally Maintaining Monopoly Power | Federal Trade Commission)


Leave a reply to Apple (AAPL): Quality Still Commands a Premium—Here’s When We’d Add – Vulcan Stock Analysis Engine Cancel reply