
The Impossible Chokepoint
Every investor in artificial intelligence is making the same bet whether they know it or not. They’re betting that one company in Hsinchu, Taiwan, can keep converting sand into the most complex objects humanity has ever manufactured, at margins that would make a luxury goods CEO jealous. That company is Taiwan Semiconductor Manufacturing, and it just printed its strongest March in history.
I don’t say that casually. (TSM) reported March 2026 revenue of NT$415.19 billion, up 45.2% from a year ago. First quarter sales hit NT$1.134 trillion, landing at the very top of the company’s own guidance range. This isn’t a beat driven by accounting tricks or one-time items. It’s raw demand from customers who have no alternative supplier for the chips powering the AI buildout.
Here’s what caught my attention: while the rest of the semiconductor industry outside of AI spent the last year flat or contracting, TSMC added the equivalent of a mid-cap foundry’s entire annual revenue to its quarterly run rate. In twelve months. That acceleration signals something structural, not cyclical.
What TSM Actually Does, and Why Replacement Is a Fantasy
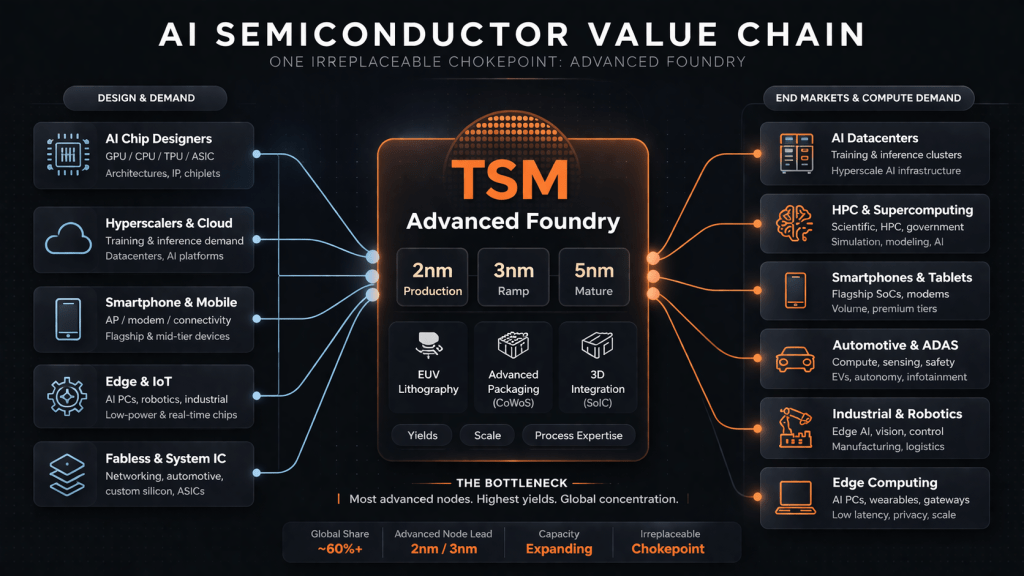
Think of TSMC as the only commercial-grade forge on the planet capable of working with a specific metal. (NVDA) designs the blueprint. (AMD) draws up competing plans. (AAPL) sketches its own custom pieces. But every single one of them walks into the same building in Taiwan to get their designs turned into physical silicon.
That concentration sounds like a risk, and it is. But it’s also the moat. Building a competing advanced foundry isn’t a capital allocation decision; it’s a decade-long industrial project that requires tens of thousands of highly trained engineers, specialized equipment with multi-year lead times, and process knowledge that took TSMC nearly forty years to accumulate. Intel has committed over $100 billion in capital investment trying to close the gap. Samsung has thrown everything it has at the problem. Neither can match TSMC’s yields at leading-edge nodes.
In Q4 2025, TSMC’s advanced technologies (7nm and below) accounted for 77% of wafer revenue. The 3nm node alone was 28%, with 5nm at 35% and 7nm at 14%. High-performance computing, the segment driven by AI accelerators and datacenter chips, represented 58% of 2025 revenue and grew 48% year over year.
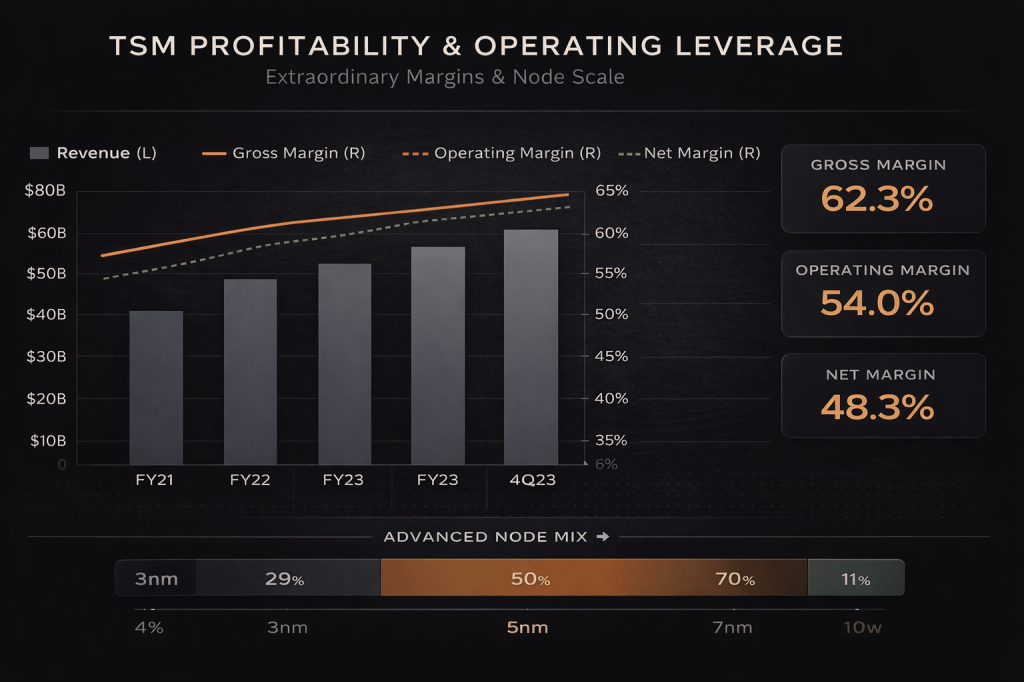
The Margin Machine
The Q4 2025 numbers deserve a second look because they reveal something about TSMC’s operating leverage that most investors underappreciate.
Revenue: $33.73 billion for the quarter, beating the top end of guidance. Gross margin: 62.3%, a new record that cleared even the elevated Q4 2022 peak. Operating margin: 54.0%. Net margin: 48.3%. For context, nearly half of every dollar of revenue falls to the bottom line. That kind of profitability at $122 billion in annual revenue is almost unprecedented in hardware manufacturing.
Full-year 2025 reinforces the point at scale: revenue up 35.9% in dollar terms, gross margin climbing 3.8 percentage points to 59.9%, operating margin up 5.1 points to 50.8%. Return on equity hit 35.4%. These aren’t numbers you get from riding a cycle. You get them from owning a chokepoint.
The Valuation is Worth Understanding
Here’s where I have to be honest about the setup. TSMC is not a bargain-bin buy. At $370, the stock trades at roughly 24.7x forward earnings with a PEG of about 1.2. In my valuation framework, the blended fair value comes in around $391, which gives a margin of safety of approximately 5.4%. That’s enough to justify a buy, but it isn’t the kind of discount that makes you aggressive. FastGraphs, with its FactSet data, shows a Blended P/E of 32.48 and Total Annualized Rate of Return of 27%. This is incredible growth that has legs for years to come.
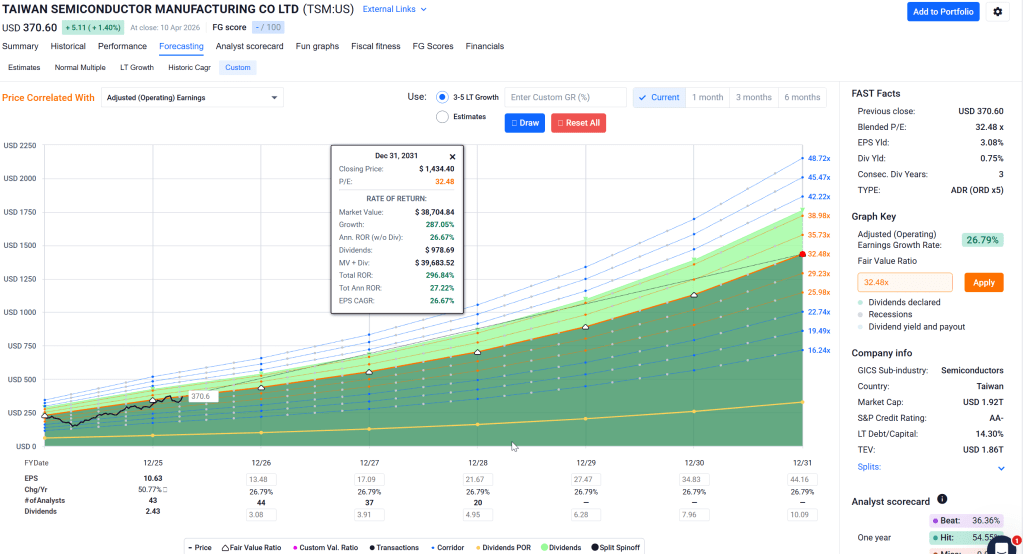
The analyst consensus target sits around $430, with the most bullish houses above $500. The internal DCF, using normalized free cash flow that strips out growth capex, produces a value near $358. Peer multiples push it toward $430. The Greenwald earnings-power floor anchors around $364. Blending those gives me the $391 figure.
What that means practically: you’re paying a fair price for a world-class asset, not getting a screaming deal. The trade-off is that TSMC’s quality scores are nearly as high as they get. Quality at 90.43 out of 100. Safety at 99.52. Interest coverage at 214x. Debt-to-equity at 0.22. These are the financials of a company that could stop growing tomorrow and still throw off enormous cash for years.
Where the Free Cash Flow Hides
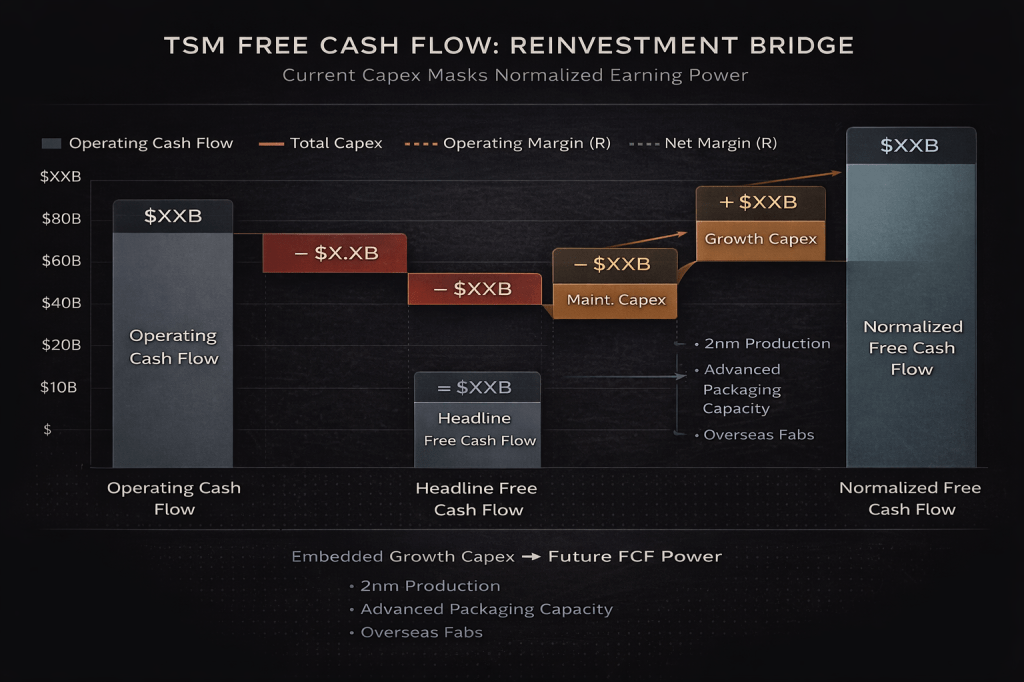
One of the most common mistakes analysts make with TSMC is looking at raw trailing free cash flow and concluding the stock is expensive. That view ignores the deliberate reinvestment happening right now.
Capex was $40.9 billion in 2025. Guidance for 2026 is $52 to $56 billion, roughly a 30% increase at the midpoint that represents the largest capacity build in the company’s history. Most of that spending isn’t maintenance; it’s growth investment into N2 (2nm) production, advanced packaging capacity for CoWoS, and overseas fab construction in Arizona and Japan.
If you strip out the growth portion and keep only the maintenance capex proxy (roughly 25% of total), normalized free cash flow jumps from $32 billion to approximately $63 billion. That’s the economic earning power of the platform that the headline numbers obscure. TSMC isn’t capital-starved. It’s deliberately reinvesting into confirmed demand that stretches through 2028 and beyond.
Five Risks That Deserve Your Attention
Geopolitical concentration. Taiwan Strait tensions remain the existential risk. A military escalation wouldn’t just disrupt TSMC; it would freeze the global technology supply chain overnight. Arizona fab construction helps, but won’t meaningfully diversify production before 2028.
Overseas margin dilution. Management guided that new fab ramp-ups will dilute gross margins by 2-3% initially, potentially 3-4% in later stages. The 2nm ramp alone is expected to compress full-year 2026 margins by 2-3 percentage points. If multiple new fabs ramp simultaneously, the hit could exceed guidance.
Customer concentration risk. (NVDA) and (AAPL) together likely account for over 40% of revenue. If either shifts volume, delays product cycles, or brings any fabrication in-house, the revenue impact would be material and immediate.
Valuation assumes excellence. At 24.7x forward earnings, the market is pricing sustained 30%+ revenue growth and continued margin expansion. A reverse DCF at 8.5% WACC and 3% terminal growth implies the market expects roughly 13-14% free cash flow CAGR for the next five years. That’s achievable but leaves limited room for execution stumbles.
Currency and macro exposure. TSMC bills most customers in US dollars but incurs the majority of its costs in New Taiwan dollars. A strengthening TWD raises production costs against dollar-denominated revenue, mechanically compressing margins. The 10-year Treasury near 4.3% also keeps multiple expansion constrained for all duration-sensitive growth assets.
The Buy Zone Framework
Based on my blended fair value of $391:
Strong Buy: $352 or below Buy Zone: $352 to $391 Hold: $391 to $430 Trim: Above $430 Too Expensive: Above $470
At $370, we’re in the Buy Zone but closer to the upper boundary than I’d like. My approach here is straightforward: take a partial position and save heavier adds for weakness into the mid-$350s. That’s where the risk-reward gets genuinely attractive.
Position sizing: 1-2% maximum for a single foundry name at these valuations. TSMC is the kind of stock where quality justifies ownership, but concentration risk demands discipline.
Invalidation triggers: Gross margin guidance below 60% without a credible temporary explanation. Evidence that AI/HPC demand is decelerating rather than shifting timing. Sustained revenue growth dropping below 15% on a trailing basis.
The Peer Context
Among large-cap semiconductor names, TSMC sits in a unique position. It doesn’t compete with its customers; it enables all of them. (NVDA) trades at 21.8x forward with 72% ROIC but faces architectural competition. (AVGO) at 28.3x has strong diversification but lower safety scores. (ASML) at 38.6x is a premium monopoly play on the equipment side. (AMD) at 32.5x carries execution risk with lower quality metrics. (INTC) at 101x forward is a restructuring story with uncertain outcomes.
TSMC sits at 24.7x forward with 26% ROIC, 90+ quality, and 99+ safety. The balance of growth, profitability, and financial durability is difficult to match anywhere in the semiconductor universe.
What the April 16 Call Will Reveal
TSMC’s full Q1 2026 earnings conference is scheduled for April 16. Investors will be watching for three things: Q2 guidance that validates the 30% annual growth trajectory, margin commentary that addresses both 2nm dilution and overseas fab drag, and any updated color on the capex envelope that might signal whether $56 billion is a ceiling or a floor.
The monthly sales data already removed most of the downside surprise risk for the revenue line. The margin detail is what matters now.
The Conviction Case
I own (TSM) and I’m adding on weakness. Not because it’s cheap, but because quality at a fair price beats cheapness without quality every time. This is the company that fabricates roughly nine out of every ten leading-edge logic chips on the planet, holding over 70% of total foundry market share and around 90% of advanced-node production. Its customers can’t leave, its margins are expanding, and its reinvestment is going into confirmed demand, not speculative capacity.
The correct framing isn’t “is TSMC expensive?” It’s “can you afford not to own the only forge that matters?” At $370, the answer is to buy with discipline, add in tranches, and let the compounding do the work.
Master Metrics Table
| Metric | Value |
|---|---|
| Live Price (Apr 10, 2026) | $370.06 |
| BFV Blended | $391.36 |
| Margin of Safety | 5.44% |
| Quality Score | 90.43 |
| Safety Score | 99.52 |
| Forward P/E | 24.7x |
| PEG Ratio | 1.20 |
| ROIC | 26% |
| Net Margin (TTM) | 45.1% |
| Operating Margin (Q4 2025) | 54.0% |
| Gross Margin (Q4 2025) | 62.3% |
| Debt/Equity | 0.22 |
| Interest Coverage | 214.8x |
| Piotroski F-Score | 8/9 |
| Revenue CAGR (5Y) | 20.8% |
| EPS Beat Rate (8Q) | 100% |
| 2025 Revenue | $122.42B |
| 2026 Capex Guide | $52-56B |
| Normalized FCFF | $62.90B |
| Analyst Consensus Target | ~$430 |
| Rating | BUY |
References
TSMC Q4 2025 Earnings Release (SEC Form 6-K, Jan 15, 2026)
TSMC March 2026 Monthly Revenue Report (TSMC IR, Apr 10, 2026)
TSMC Q4 2025 Earnings Call Transcript (Jan 15, 2026)
GNG Research Quantitative Database, accessed Apr 10, 2026
Vulcan Stock Research Database, accessed Apr 10, 2026
Disclosure: The author holds a position in (TSM) and related semiconductor names including (NVDA). This is not investment advice. Always conduct your own research and consult a financial advisor before making investment decisions.
Published by GNG Research | Vulcan Stock Research Data as of April 10, 2026


Leave a comment