
By Vulcan Stock Research | GNG Research
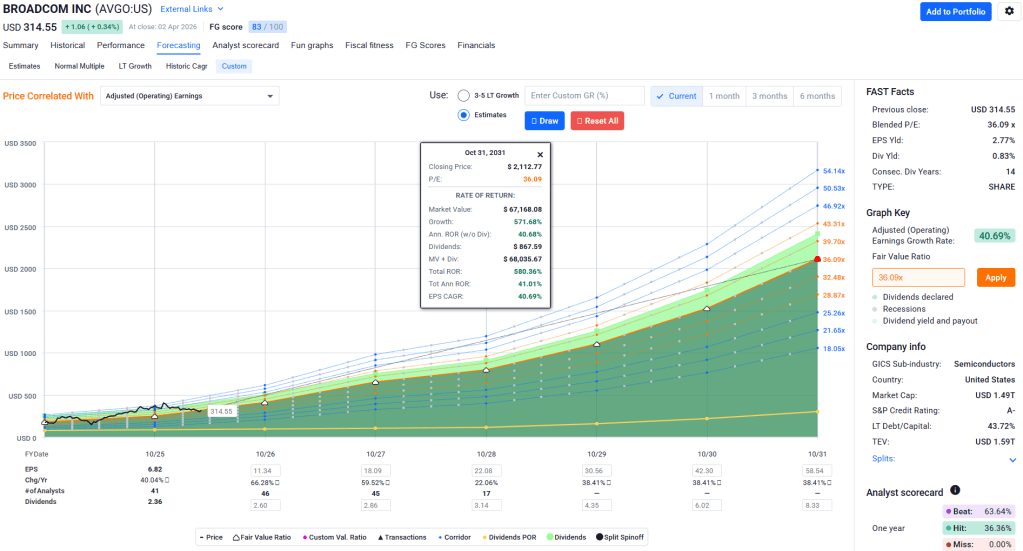
The correction came fast. Broadcom (AVGO) shed roughly 24% from its 52-week high of $414.61, landing at $314.56 as of early April 2026. The technical picture is not pretty: below the 50-day and 200-day moving averages, RSI hovering near 47, and a formal downtrend label from most systematic screens. For investors who run a pure value process, none of that is surprising. The stock was expensive when it peaked, and it’s still not statistically cheap. A strict discount-to-fair-value framework can stay cautious here and defend that call without breaking a sweat.
But “the stock corrected” and “the business broke” are two very different sentences. I’ve spent considerable time working through the fundamentals behind this name, and my read is that the blueprint that makes (AVGO) worth owning hasn’t shifted. The custom silicon position, the software monetization engine, the free cash flow machine, the quietly compounding dividend; all of it is intact. The market repriced the multiple. The underlying architecture of the business didn’t change.
That distinction is why I think this pullback deserves serious attention from investors who run a GARP framework rather than a deep-value one.
What Broadcom Actually Owns

Before debating whether the stock is cheap or expensive, it helps to understand what you’re actually buying. Broadcom is not a general semiconductor company chasing every trend. The company has built a two-engine model: a custom silicon and networking business serving the largest hyperscalers in the world, layered on top of a software stack that adds recurring revenue and margin durability.
The custom AI chip business is the engine everyone watches right now. In Q1 FY2026, (AVGO) reported $8.4 billion in AI chip revenue, up 77% year over year from an already large base. Management guided that figure to approximately $10.7 billion for Q2, implying sequential growth close to 30%. And the company has put a number on the runway: at least $100 billion in AI chip revenue in fiscal 2027. That is not a vague aspiration. That is a management team telling you they have the customer relationships and the design wins to anchor that kind of volume.
The moat around this business matters more than the revenue number in isolation. Broadcom holds the blueprint for how the largest AI compute clusters actually get wired together. Custom accelerators, networking switches, connectivity fabric; these aren’t commodity inputs. They’re years of co-design work with customers who have enormous switching costs. That is what creates the pricing power behind a 67.8% gross margin and a 40.8% operating margin. Those margins don’t come from luck. They come from being the party that defined the architecture everyone else has to work around.
The software side of the business, built largely through the VMware acquisition, adds a second pillar. It generates high-retention recurring revenue and diversifies the cash flow profile away from pure semiconductor cyclicality. The combined model produces a free cash flow margin just above 42% on trailing revenue, with $28.91 billion in TTM free cash flow. For a company posting 25% revenue growth year over year and 25.6% revenue CAGR over three years, that kind of cash conversion is exceptional. Most high-growth tech companies burn cash to grow. Broadcom grows and floods the bank account at the same time.
The Revision Signal That Changes the Valuation Math

One of the things I look for in a GARP situation is whether the earnings bar is moving in the right direction while the stock is moving in the wrong one. When that divergence opens up, the forward multiple compresses faster than the trailing multiple would suggest.
For (AVGO), the revision picture is one of the strongest I’ve seen in this market. In the 30 days leading up to early April 2026, the current-quarter EPS estimate of $2.39 had 35 analysts revising upward and zero revising downward. The next quarter at $3.22 showed 33 up revisions against just one down. For the full fiscal year, EPS estimates moved up 12.2% over 90 days, and next year’s estimates rose 27.4% over the same period. This is not a stagnant story where you’re buying future growth that hasn’t materialized yet. The math under the stock is getting better in real time while the price sits 24% off its high.
That combination; a stock in a technical downtrend with continuously rising earnings estimates; is precisely where GARP setups tend to live. The forward P/E at roughly 27.8x looks rich in isolation. But when EPS estimates are moving up 12-27% over just 90 days, the effective forward multiple you’re paying compresses quickly. The growth score from the GNG Research terminal sits at 100 out of 100. The cash flow predictability percentile sits at 100 as well. You’re paying a premium for a business that almost never misses, is growing fast, and is still getting faster estimate revisions than virtually anything else in the semiconductor space.
The Dividend Nobody Talks About
Broadcom is not an income stock. I want to be clear about that upfront because misclassifying it creates false expectations. The forward yield sits around 0.8% and the current payout ratio is near 48%. If you need 4% yield, this is not your vehicle.
But here’s what I think gets overlooked: the dividend growth rate is genuinely impressive for a company at this stage of its growth curve. The five-year dividend CAGR is 12.5%, confirmed across both my Vulcan database and the GNG Research terminal. The Chowder Rule score, which combines dividend yield with that five-year dividend growth rate, lands at 13.3%. For a company still growing revenue at 25%, maintaining that kind of dividend compounding discipline is a signal worth paying attention to. It says management is not raiding the balance sheet or sacrificing shareholder return to fund ego acquisitions. The cash engine is large enough to grow the dividend double-digits, fund buybacks at a 0.4% yield, service a manageable debt load, and still have room for capital allocation flexibility.
The dividend trajectory also says something about management confidence. Forward dividend growth guidance sits near 7-7.4%. That is not aggressive, but it is consistent. When a semiconductor company with this much AI-cycle torque is still growing its dividend at 12.5% annually over five years rather than suspending it to fund capacity, it signals that management views the cash generation as durable across cycles rather than dependent on this specific moment in AI capex.
For long-term compounders, that distinction matters. My position in (AVGO) is a core GARP holding, and the dividend compound is part of why I’m comfortable holding through volatility rather than trading around the swings.
The Balance Sheet and Risk Picture
Broadcom carries real debt. Total debt sits around $68 billion with net debt near $54 billion, and the Altman Z-score of approximately 11.35 confirms the company is not in distress territory despite that headline leverage number. Interest coverage at 8.1x and a current ratio at 1.9x give the balance sheet enough runway that the debt load is a management question rather than a survival question. The company generates enough free cash flow in a single year to cover a meaningful chunk of that obligation.
That said, there are five specific risks I’m watching and I think any investor who ignores them is doing themselves a disservice.
First, valuation compression is a real scenario. At 27.8x forward earnings, (AVGO) is priced for continued execution. If the broader market decides AI infrastructure multiples should be lower, the stock can fall further even with no change in fundamentals. The max drawdown over the past three years hit 41.1% at its worst. This is not a smooth ride.
Second, AI capex deceleration would hit the thesis at its core. The entire bull case depends on hyperscalers continuing to pour capital into custom silicon and networking infrastructure. Any meaningful slowdown in that spending, whether from economic conditions, regulatory pressure, or a shift in AI architecture, removes the primary revenue growth driver.
Third, estimate revisions can reverse. The current picture of 35 up and zero down on quarterly EPS is extraordinary. That won’t last forever. If revisions stall or turn negative, the GARP premium evaporates quickly.
Fourth, VMware integration execution risk remains. The software segment needs to keep converting VMware’s installed base into recurring, high-margin revenue. If churn runs higher than expected or pricing power proves weaker than modeled, the second engine of the thesis loses torque.
Fifth, concentration risk is structural. A handful of hyperscaler customers represent a substantial portion of AI chip revenue. Losing or meaningfully reducing a relationship with one of them would have an outsized impact on results. Customers with enough scale to fund their own chip programs have both the incentive and the capability to reduce dependence over time.
My Strategy and How I’m Positioned
I own (AVGO) as a core GARP holding. Here’s how I’m thinking about adding from the current level around $314.
At the low $300s, I think the stock is in a reasonable accumulation range. The business quality is elite, the revision momentum is strong, and the AI revenue trajectory gives you a credible growth path through 2027. I’m adding in tranches rather than going heavy in one shot, because the technical picture is still negative and the broader market is not giving semiconductor names an easy ride.
Between $285 and $300, the setup becomes more compelling. At that level, the forward multiple compresses further and the margin of safety improves even if fair value estimates stay static. I’d be adding more meaningfully in that zone.
Below $260, assuming estimates remain intact and AI demand hasn’t fundamentally cracked, I would be building my largest tranche. At that kind of discount, the GARP case becomes very strong even by conservative valuation methodologies.
The upside case is straightforward: if AI chip revenue grows toward the $100 billion fiscal 2027 target and VMware continues compounding, the earnings power over the next two years likely justifies a meaningful premium over today’s price. The consensus analyst target sits near $460, which implies substantial upside from current levels. I don’t anchor my thesis to analyst targets, but the directional case is clear.
The invalidation triggers are equally clear. If AI capex growth stalls materially, if estimate revisions reverse direction, or if VMware integration disappoints significantly, I’d be reducing position size. The blueprint remains compelling as long as the underlying construction project is still running at scale.
The Simplest Way to Say It
Broadcom is not cheap. It probably won’t be cheap by a traditional metric screen for a very long time, if ever. But cheap and buyable are different things. The business held its quality while the stock reset. The cash flow machine kept producing. The dividend kept growing at 12.5% annually. The AI chip design wins kept accumulating. The earnings estimate revisions kept moving the right direction.
When the blueprint doesn’t change and the price does, that’s worth paying attention to.
Master Metrics Table
| Metric | Value | Vulcan Context |
|---|---|---|
| Ticker | AVGO | Broadcom Inc. |
| Price (April 3, 2026 close) | $314.56 | ~24% below 52-week high |
| 52-Week High | $414.61 | Well off peak; correction underway |
| 52-Week Low | $138.10 | Wide range reflects AI cycle volatility |
| Market Cap | ~$1.49T | Mega-cap infrastructure platform |
| Revenue (TTM) | $68.3B | Large and still accelerating |
| Revenue Growth YoY | 25.2% | Elite for a company this size |
| Revenue CAGR 3Y | 25.6% | Sustained, not one-year spike |
| EPS Growth YoY | 120.8% | Exceptional earnings leverage |
| EPS CAGR 5Y | 42.7% | Long-run compounding machine |
| Forward P/E | 27.78x | Premium, but revisions are climbing fast |
| EV / EBITDA | 40.65x | Expensive on trailing; shrinks with growth |
| EV / FCF | 55.05x | Rich; requires execution to compress |
| Fair Value (GNG Research) | $332.33 | Modest MoS at current price |
| Analyst Consensus Target | $459.95 | Street sees substantial upside |
| Gross Margin | 67.8% | Elite; reflects architectural moat |
| Operating Margin | 40.8% | Exceptional for a company this complex |
| Net Margin | 36.2% | Large-cap tech at premium profitability |
| FCF Margin | 42.1% | Cash generation that funds everything |
| TTM Free Cash Flow | $28.91B | Funds dividends, buybacks, debt service |
| ROIC | 18.0% | Strong capital efficiency |
| Return on Equity | 28.5% | Excellent equity returns |
| Altman Z-Score | 11.35 | Very low distress risk despite leverage |
| Interest Coverage | 8.1x | Comfortable; debt is manageable |
| Debt / Equity | 0.8x | Leverage present but not distress-level |
| Current Ratio | 1.9x | Healthy near-term liquidity |
| Payout Ratio | 48.1% | Sustainable at current FCF levels |
| TTM Dividend Yield | 0.7% | Small yield; not income thesis |
| Forward Dividend Yield | 0.8% | Yield growing with dividend increases |
| Dividend 5Y CAGR | 12.5% | Quietly compounding; core conviction metric |
| Chowder Rule (5Y) | 13.3% | Solid total yield story despite low starting yield |
| Buyback Yield | 0.4% | Present but secondary to organic growth |
| Cash Flow Predictability | 100th percentile | Highest reliability in the database |
| EPS Predictability | 70th percentile | Above average; consistent deliverer |
| Quality Score | 95/100 | Elite quality by GNG Research system |
| Growth Score | 100/100 | Top-tier; maximum rating |
| Value Score | 55/100 | Middling; not a value setup |
| Overall Rating vs. Peers | 84/100 | Strong peer-relative standing |
| PEG (Fwd) | 3.9x | Premium; justified by moat and revisions |
| Beta 3Y | 1.94 | High-beta; position sizing matters |
| Max Drawdown 3Y | -41.1% | Real volatility; not a smooth compounder |
| Max Drawdown 1Y | -25.3% | Current correction in historical context |
| AI Revenue Q1 FY26 | $8.4B | +77% YoY; core thesis proof point |
| AI Revenue Q2 Guidance | $10.7B | ~28% sequential acceleration guided |
| FY2027 AI Revenue Target | $100B+ | Management committed to this floor |
| Current Qtr EPS Revisions | 35 up / 0 down | Exceptionally strong estimate momentum |
| Next Qtr EPS Revisions | 33 up / 1 down | Revision trend intact heading forward |
| Current Year EPS Est. | $11.35 | Up 12.2% over 90 days |
| Next Year EPS Est. | $17.84 | Up 27.4% over 90 days |
| Institutional Ownership | 79.3% | Dominant institutional base |
| Insider Ownership | 2.0% | Modest but present |
| Consensus Rating | Strong Buy | 36 Strong Buy, 3 Buy, 3 Hold |
Vulcan Stock Research is a publishing brand of GNG Research. This is not financial advice. The author holds a long position in (AVGO). Past performance does not guarantee future results. All data sourced from GNG Research terminal and publicly available company filings. Metrics as of early April 2026.
Data sources: GNG Research Terminal, company earnings releases, analyst consensus data.


Leave a comment