
Published by GNG Research | Ticker: (NEM)
Every serious portfolio has a foundation layer. Not the exciting stuff. Not the AI darlings or the biotech moonshots. The layer that holds when everything else wobbles. For thousands of institutional investors and retail holders alike, that foundation has been gold, and for years one company has served as the most liquid, most financially rigorous way to own it at scale.
That company is Newmont Corporation NEM). And right now, it sits at a genuinely interesting crossroads.
The Case for Owning the Ground Itself
Before getting to Newmont’s specific numbers, let’s talk about why gold belongs in a portfolio at all, because the conventional wisdom on this gets garbled regularly.
Gold does not generate cash. It does not pay a growing dividend. It does not compound the way a business does. But it does something those assets cannot: it holds its value across regimes. Across currency debasements. Across decades where paper assets get repriced by inflation or by policy error. When everything else in your portfolio correlates to one, gold tends not to. That is not a bug in gold’s design. That is the whole point.
The physical route is clean and transparent. Exchange-traded products like (IAUM) and (GLD) give you that exposure with tight spreads and low fees. (IAUM) in particular runs an efficient structure with physical gold backing. If your goal is pure commodity exposure with no equity risk layered on top, those products do exactly what they say.
But equities to gold add something the bullion ETFs cannot: operating leverage. When gold trades at 3,100 dollars an ounce and Newmont’s all-in sustaining cost is running around 1,680 dollars per ounce, the company is generating roughly 1,420 dollars per ounce in margin before corporate overhead. That spread matters enormously. A 200-dollar move in gold translates, at scale, into billions in additional free cash flow. The metal itself does not do that for you. The miner does.
That is why (GDX), the large-cap miners ETF, has historically outperformed bullion on a percentage basis during gold bull runs. It is also why miners can crater harder on the way down. The leverage cuts both ways. Understanding that is not optional if you are going to hold this space with conviction.
Silver deserves a brief mention here because it behaves like gold’s younger, more excitable sibling. (SLV) and (SIVR) give you the pure metal. Silver has industrial demand kickers that gold does not, especially in solar panels and electronics, which makes it more cyclical but also potentially more interesting in a manufacturing recovery. Miners like (PAAS) sit in both the silver and gold world. For portfolio construction, silver adds some diversification within the precious metals basket, but gold is the anchor. That order of precedence matters when you are building.
Newmont Is Not the Same Company It Was Two Years Ago
There is a version of the Newmont story that old-time followers know well, and it is not a flattering one. Stretched balance sheets. Acquisition regret. A dividend that got cut. Cost overruns at multiple mines. That Newmont was a frustrating hold.
The 2025 Newmont is different in ways that matter structurally. The company reported 10.3 billion dollars of operating cash flow for the full year. Free cash flow came in at 7.3 billion dollars. It paid down 3.4 billion dollars in debt and closed the year with 7.6 billion dollars in cash, putting the company in a net cash position. The adjusted EBITDA figure was 13.5 billion dollars. These are not incremental improvements. These are step-change numbers that reflect what happens when a company right-sizes its cost structure, benefits from higher commodity prices, and finally gets the portfolio integration it paid for with the Goldcorp merger working in its favor.
The balance sheet quality now crosses almost every institutional threshold you can run. The Altman Z-Score is 4.02 on the GNG platform, comfortably above the 3.0 threshold that separates financially stable companies from distress candidates. Interest coverage comes in at 52.85x, which means Newmont could watch its operating income fall by 98% before it missed an interest payment. The Piotroski F-Score sits at a perfect 9 out of 9, which is the quant signal for broad-based financial health improvement across nine distinct accounting dimensions. The Beneish M-Score is negative 1.63, which suggests the financials are not being massaged for appearances.
None of that is accidental. It reflects a management team that made a deliberate choice to prioritize financial strength over production growth after years of the mining sector doing the opposite.
The Numbers That Change the Math
Here is what the Vulcan and GNG platforms surface when you run (NEM) through a full screen, and why the picture is more interesting than a casual glance at the stock chart might suggest.
The GNG Safety Score is 99.03 out of 100. That is not a typo. Newmont sits in the top 1% of all screened stocks globally on balance sheet and financial stability metrics. The Quality Score is 82.37. The Vulcan Composite ranks it at the 93rd percentile versus all peers in its universe. Growth Score on Vulcan comes in at 96 out of 100. These are not metrics that tend to cluster together in mining names.
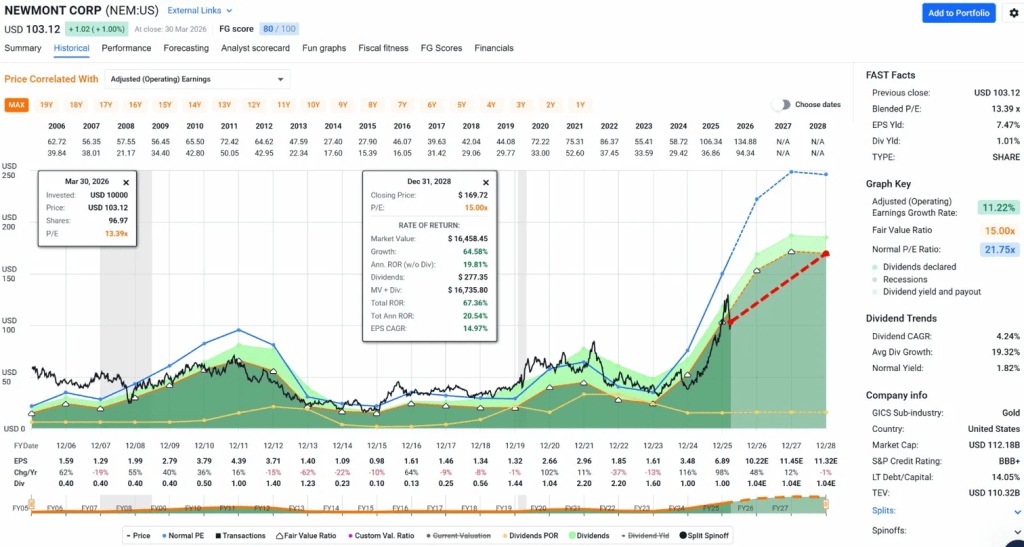
Revenue grew at a 22.7% three-year CAGR. EPS grew at 63.2% over the same period, reflecting the operating leverage that makes gold miners compelling when the commodity cycle cooperates. The EPS figure itself is 6.39 dollars per share at a stock price in the 105-dollar range, implying a forward earnings yield above 7%. The GNG Fair Value sits at 127.94 dollars. The Vulcan Fair Value is 144.88 dollars. The blended internal-plus-external target from the Full Deep report clocks in at 124.1 dollars.
What that means in plain language: the stock is trading at a discount to every serious valuation anchor in the database. The margin of safety on the Vulcan platform is 25%. The GNG Discount to Fair Value is 25.1%. That kind of convergence across two independent models and a third-party analyst consensus averaging around 141 dollars is not a coincidence. It is a signal.
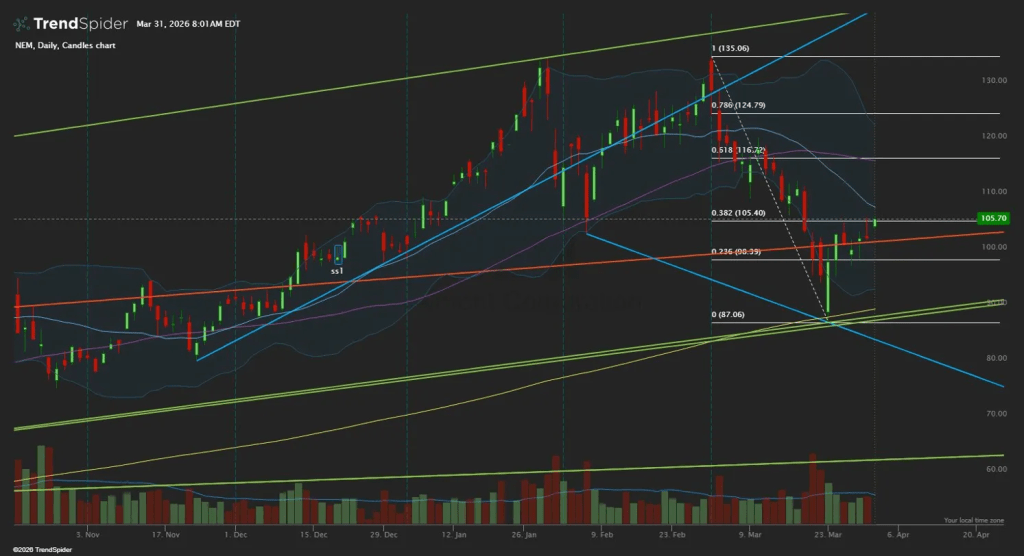
The chart adds nuance rather than contradiction. Newmont topped near 135, sold off sharply into the 87 area, and has bounced back to the 0.382 Fibonacci retracement level around 105.40. That is the first meaningful resistance shelf. The 0.518 level sits at 116.72. The 0.786 sits at 124.79. Holding above the 0.382 and working through that overhead is how this recovers its full trend structure. The tactical implication is straightforward: accumulate on weakness rather than chase into resistance. The valuation supports it. The chart demands patience.
What Can Go Wrong
This is where honest coverage earns its credibility. Newmont’s risk profile is not simple, and anyone building a position should hold these five concerns in their head simultaneously.
First, 2026 is a softer production year by management’s own guidance. The company guided to approximately 5.26 million attributable gold ounces versus 5.89 million in 2025, with by-product AISC running around 1,680 dollars per ounce. That guidance reflects real capital spend at Cadia, Boddington, Tanami, and Red Chris. You are paying for a transition year, not an acceleration year.
Second, the gold price itself remains the dominant variable. Newmont does not control the commodity. If real interest rates rise meaningfully from current levels and the dollar strengthens, gold faces headwinds that no operational excellence can fully offset. The stock’s 1-year max drawdown is 66.7% on the GNG platform, which reflects how violently this name can move when the metal tape turns against you.
Third, jurisdictional risk is real and underappreciated. Newmont operates in multiple countries with different regulatory environments, royalty structures, and political risk profiles. A change in mining law, an unexpected royalty increase, or a labor dispute in a key jurisdiction can shift cost guidance quickly and materially.
Fourth, the dividend history carries a warning. The DPS three-year CAGR is negative 23.1% on the GNG platform, reflecting the dividend cut Newmont made in 2023 before reinstating it. The current payout is 1.01 dollar per share with a payout ratio around 15.8%, which makes it very sustainable from a coverage standpoint. But if you are building a position partly for income, know that this company has already demonstrated willingness to cut when capital allocation required it.
Fifth, the Sentiment Score on Vulcan is just 27 out of 100. Short-term sentiment is bearish on the 48-hour view. That does not change the fundamental case, but it does mean you are not getting a tailwind from the crowd right now. Contrarian comfort matters here.
How to Position
The GNG buy zone structure is explicit and worth following. The Good Buy price is 102.35 dollars. The Strong Buy is 92.12 dollars. The Very Strong Buy is 81.88 dollars. The Ultra Value level is 71.65 dollars. At the current price near 105 dollars, you are just above the Good Buy threshold, which makes this a start-a-position environment rather than a pile-in moment.
Position sizing should reflect the risk profile. This is not a predictable earnings compounder. The cash flow predictability percentile from Vulcan is 91st, which is excellent for a miner, but the volatility profile is still a 44th percentile name on 1-year terms. Sizing it appropriately within a broader portfolio, perhaps alongside (IAUM) or (GDX) for diversification within the gold complex, is the disciplined approach.
Trim triggers are equally important. The GNG Trim Price is 191.91 dollars. The Full Deep report flags 139 as the first level where you start thinking about reducing. Between 105 and 139 is where patient holders get rewarded.
The fundamental invalidation case is specific: a material cut to medium-term production confidence, balance sheet deterioration, or evidence that the 2025 cash generation was cyclical rather than structural. None of those conditions exist today. The business earned that free cash flow against well-documented conditions that are unlikely to reverse overnight.
The Bigger Picture
Portfolios built to last need layers. The growth layer compounds at high rates and carries meaningful volatility. The income layer provides regular cash return and dampens drawdowns. And the hard asset layer, built around gold and the best-in-class equities attached to it, provides the regime hedge that protects the whole structure when paper assets go through their periodic repricing.
Newmont, owned alongside physical gold exposure through (IAUM), broad miner exposure through (GDX), and selective individual names, is not a trade. It is an architecture decision. The company has the financial strength, the asset duration, and the cash-return framework to anchor that architecture for years. The stock is not free. But it is not expensive, and the discount to fair value across every serious model in the database says that much.
At 105 dollars, buying the ground still makes sense.
Master Metrics Table
| Metric | Value | Source |
|---|---|---|
| Ticker | NEM | Newmont Corporation |
| Sector | Basic Materials | Gold |
| As-of Price | 105.70 | TrendSpider 3/31/26 |
| GNG Fair Value | $127.94 | GNG Research |
| Vulcan Fair Value | $144.88 | Vulcan DB |
| BFV Blended | $124.10 | Full Deep Report |
| Margin of Safety (Vulcan) | 25% | Vulcan DB |
| Discount to FV (GNG) | 25.1% | GNG Research |
| Safety Score | 99.03/100 | GNG Research |
| Quality Score | 82.37/100 | GNG Research |
| GNG Quant Rating | Strong Buy | GNG Research |
| Vulcan Overall Rating vs Peers | 93rd pctile | Vulcan DB |
| Vulcan Quality Score | 98/100 | Vulcan DB |
| Vulcan Growth Score | 96/100 | Vulcan DB |
| Vulcan Sentiment Score | 27/100 | Vulcan DB |
| Piotroski F-Score | 9/9 | Both DBs |
| Altman Z-Score | 4.02 | GNG Research |
| Beneish M-Score | -1.63 | GNG Research |
| Interest Coverage | 52.85x | GNG Research |
| Debt/Equity | 0.17 | GNG Research |
| ROIC | 20.0% | GNG Research |
| Current Ratio | 1.72 | GNG Research |
| Forward P/E | 13.87x | GNG Research |
| EV/EBITDA | 8.04x | GNG Research |
| FCF Yield | 5.54% | GNG Research |
| FCF Per Share | $5.31 | GNG Research |
| EPS | $6.39 | GNG Research |
| EPS CAGR (3Y) | 63.2% | GNG Research |
| EPS CAGR (5Y) | 18.6% | GNG Research |
| Revenue CAGR (3Y) | 22.7% | GNG Research |
| Long-Term Growth | 21.13% | GNG Research |
| Net Margin | ~31.3% | Vulcan DB |
| OCF Margin (TTM) | 46.8% | GNG Research |
| FCF Margin (TTM) | 26.6% | GNG Research |
| Dividend Per Share | $1.01 | GNG Research |
| Dividend Yield | 1.05% | GNG Research |
| DPS CAGR (3Y) | -23.1% | GNG Research |
| Payout Ratio | 15.8% | GNG Research |
| Total Shareholder Yield | 1.04% | GNG Research |
| 12-Month Return | 101.2% | GNG Research |
| 1-Month Return | -23.4% | GNG Research |
| 6-Month Return | 22.7% | GNG Research |
| Max Drawdown (1Y) | -66.7% | GNG Research |
| 52-Week High | $134.61 | GNG Research |
| 52-Week Low | $42.38 | GNG Research |
| 50-Day MA | $118.41 | GNG Research |
| 200-Day MA | $87.50 | GNG Research |
| Institutional Ownership | 80.7% | Vulcan DB |
| Analyst Target (GNG) | $141.66 | GNG Research |
| Good Buy Price | $102.35 | GNG Research |
| Strong Buy Price | $92.12 | GNG Research |
| Very Strong Buy Price | $81.88 | GNG Research |
| Ultra Value Price | $71.65 | GNG Research |
| Trim Price | $191.91 | GNG Research |
| Rating | BUY | GNG Research / Full Deep |
This article is for informational and educational purposes only and does not constitute financial advice. All data sourced from GNG Research Terminal and Vulcan database as of available snapshot dates. Price anchor sourced from TrendSpider chart dated March 31, 2026. Do your own due diligence.


Leave a comment