Why the World’s Most Boring Monopoly Might Be Your Best Buy Right Now
Every business in America pays Microsoft a tax.
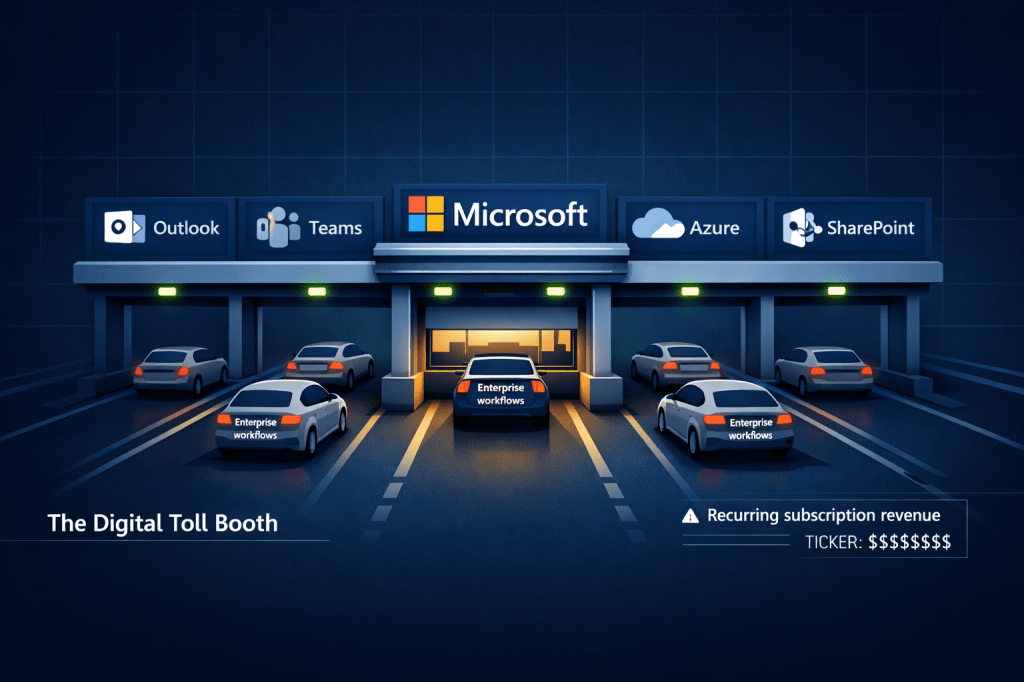
Not literally, of course. But think about what happens on a Monday morning in any Fortune 500 company. Someone opens Outlook. Another fires up Teams. A developer pushes code to Azure. A CFO runs numbers in Excel. A marketing team collaborates on SharePoint. Every one of those actions generates revenue for a single company in Redmond, Washington, and almost nobody thinks twice about it.
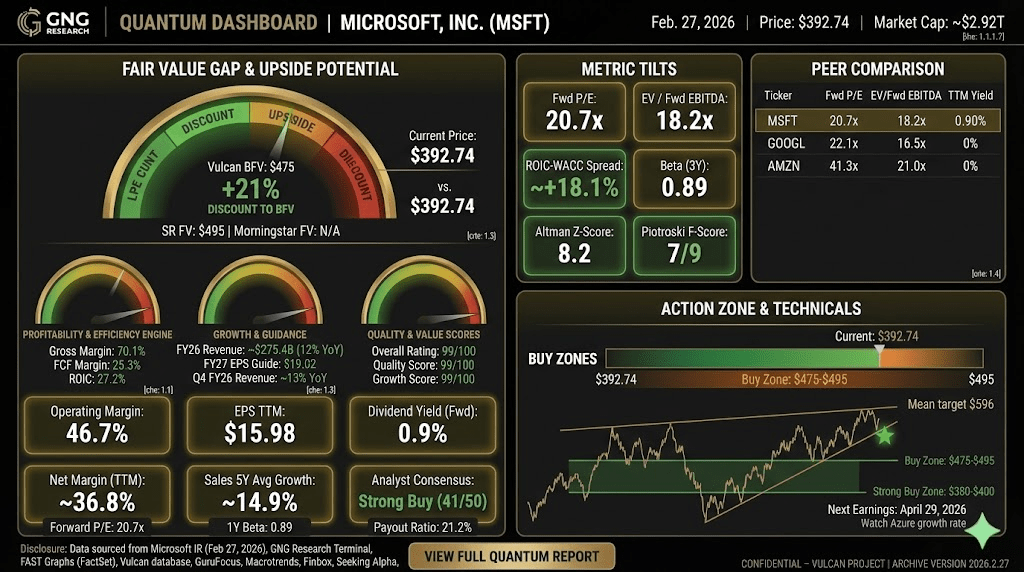
That is the kind of dominance that should command a premium. And yet here we are: Microsoft (MSFT) at $392.74, down nearly 29% from its July 2025 high of $555, trading at the same multiple as the S&P 500 average. A AAA-rated company growing earnings at 17% annually, priced as if it were just another stock on the shelf.
Something doesn’t add up. And that gap between perception and reality is where patient investors get paid.
The Machine Nobody Notices
Microsoft’s (MSFT) power comes from something Wall Street often undervalues invisibility. The companies that generate the most conversation (Tesla, Nvidia, Palantir) are rarely the ones that generate the most consistent free cash flow. Microsoft printed $77.4 billion in free cash flow over the trailing twelve months. That’s more than the entire annual revenue of most S&P 500 companies.
The business operates across three segments, each one a profit engine in its own right. Productivity and Business Processes (Office, LinkedIn, Dynamics) is the legacy toll booth, collecting subscription fees from over 400 million commercial users. Intelligent Cloud (Azure, server products) is the growth engine, running at 47% operating margins while competitors struggle to break even. More Personal Computing (Windows, Xbox, Surface) provides the floor.
What makes this combination so powerful is the switching cost. Once a corporation builds its workflows around Microsoft 365 and Azure, ripping that out is roughly as practical as replacing all the electrical wiring in a skyscraper. The cost isn’t just financial; it’s organizational. Every integration, every custom workflow, every trained employee becomes an anchor holding the customer in place.
Revenue has compounded at 12.8% annually over the past four years, while operating income grew at 15.4%. The company isn’t just big; it’s getting more profitable as it scales, which defies the typical pattern for mature technology businesses.
Stock Rover assigns Microsoft a Quality Score of 99 out of 100 and a Growth Score of 99 out of 100. Those aren’t typos. Across every metric that matters for business durability, profitability, and balance sheet strength, Microsoft sits in the top 1% of all publicly traded companies.
The AI Toll Just Got Added
Here’s where the conventional narrative gets it wrong. Most investors are debating whether Microsoft is “spending too much” on AI infrastructure. They see $50 billion-plus in annual capex and flinch. But that framing misses the business model entirely.
Microsoft isn’t building AI to sell chips. It’s embedding AI into the toll booth.
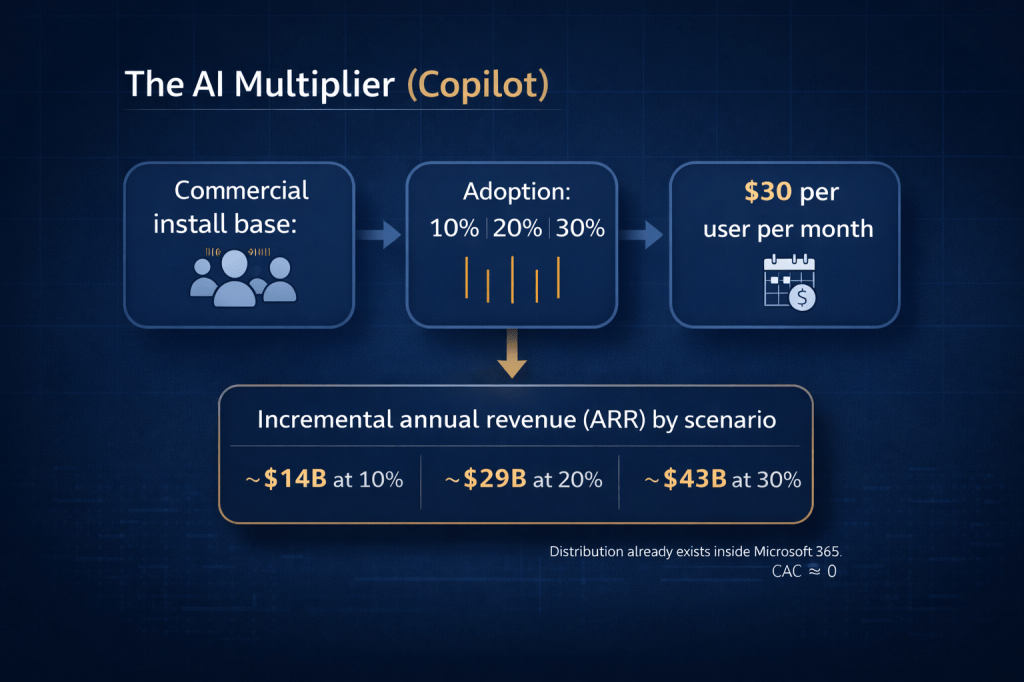
Copilot, Microsoft’s AI assistant layered into Office 365, costs $30 per user per month. If even 20% of the 400 million commercial install base adopts it, that’s roughly $29 billion in incremental annual revenue, and it flows through at software margins because the distribution channel (Office 365) already sits on every corporate desktop in the world. The customer acquisition cost is effectively zero.
This is why the capex spending isn’t a risk factor in the traditional sense. It’s a capital moat. Smaller competitors literally cannot afford to build the data center infrastructure required to compete at Azure’s scale. Every dollar Microsoft invests in AI infrastructure raises the barrier to entry for everyone else.
The most recent quarter (December 2025) delivered earnings of $5.16 per share against estimates of $3.85, a 34% surprise. That wasn’t a one-time beat: Microsoft has posted positive earnings surprises in 10 of the last 12 quarters, with zero misses.
What the Balance Sheet Actually Says
In a higher-rate world, balance sheet quality separates the survivors from the casualties. Microsoft’s financials don’t just pass the test; they set the standard.
The company carries a AAA credit rating from S&P, higher than the United States government. Debt-to-equity sits at just 0.2. Interest coverage is 56.4x, meaning Microsoft earns enough operating income to cover its interest expense more than 56 times over. The Altman Z-Score registers 8.2, well above the 3.0 threshold that signals financial health.
ROIC runs at 27.2% against a weighted average cost of capital near 9.2%, creating a positive spread of roughly 18 percentage points. That spread is the clearest measure of whether a company is creating real economic value, and Microsoft’s is among the widest in the entire market.
Piotroski F-Score of 7 (out of 9) confirms the balance sheet is strengthening, not weakening. Free cash flow margins hold at 25.3%, funding the dividend ($3.64 per share, growing at 10% annually for the past decade), aggressive buybacks, and the massive AI capex simultaneously. No trade-offs required.
Valuation: Four Anchors, One Conclusion
We triangulate fair value using four independent sources to filter out noise and anchoring bias.
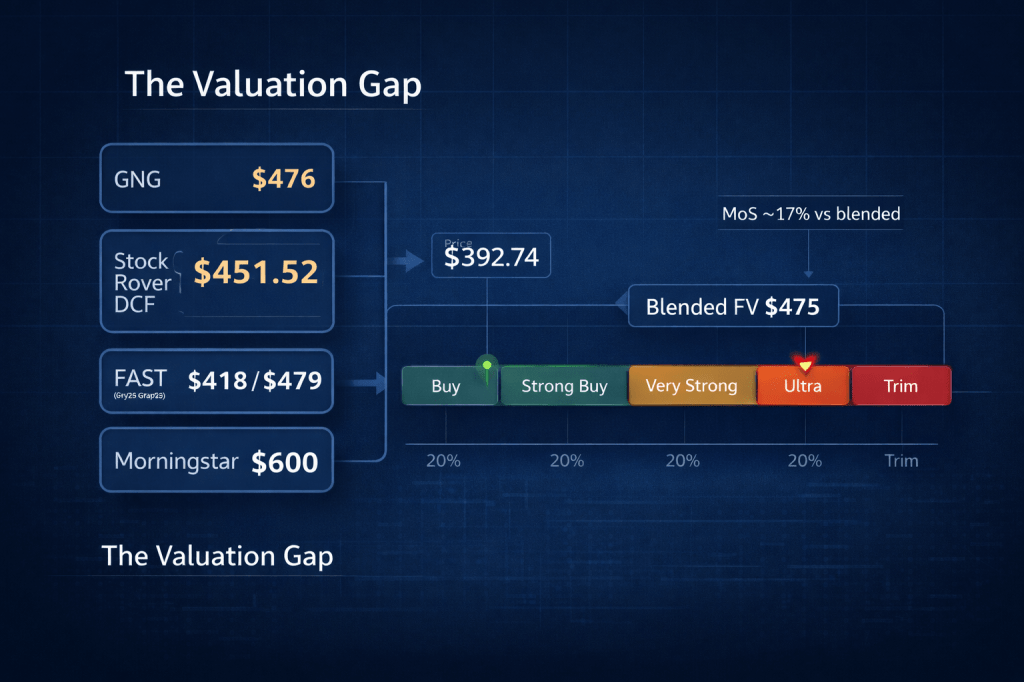
The Vulcan database (GNG baseline) places fair value at $476. Stock Rover’s discounted cash flow model calculates $451.52. FAST Graphs, using the historical normal P/E of 25.2x applied to forward earnings, implies roughly $418 on current-year estimates and $479 on fiscal 2027 projections. Morningstar’s analyst DCF view anchors higher at $600, reflecting a longer-duration growth assumption.
Our Blended Fair Value weights these sources by methodology and recency: 30% GNG, 30% Stock Rover, 25% FAST Graphs normal PE, 15% Morningstar.
Blended Fair Value: $475
At $392.74, that’s a 17.3% margin of safety against our blended anchor. The stock currently sits in our Buy zone, just above the Strong Buy threshold at $380.
Action Zones
Current price: $392.74
Buy Zone (8% MoS): $437 and below. Strong Buy (20% MoS): $380 and below. Very Strong (27.5% MoS): $344 and below. Ultra Value (35% MoS): $309 and below.
Trim (10% premium to BFV): $523 and above. Heavy Trim (20% premium): $570 and above.
Twelve-Month Outlook: Probability Bands
Bull case (25% probability, target $560): Copilot adoption accelerates, Azure growth re-rates higher, and the market decides AI capex is investment rather than drag. Multiple expands toward 30x forward earnings.
Base case (55% probability, target $500): Steady execution on cloud and AI monetization. Multiple normalizes to mid-to-high 20s on fiscal 2027 EPS estimates of roughly $19. Dividends add approximately $4.
Bear case (20% probability, target $380): Macro slowdown compresses multiples across big tech. AI spending concerns persist. Growth narrative softens, though the business itself remains fundamentally sound.
Probability-weighted 12-month target: $495
Five Risks That Keep Us Honest
1. Capex hangover. If AI monetization disappoints over the next 12 to 18 months, $80 billion-plus in annual capital spending creates a depreciation headwind that compresses margins by 200 to 300 basis points. Watch operating margins dropping below 43%.
2. Azure deceleration. Cloud growth slowing below 20% would signal market saturation sooner than expected and pressure the growth premium. Current growth rate sits near 25 to 30%.
3. Regulatory overhang. The OpenAI partnership and broader AI governance scrutiny could introduce compliance costs or structural changes. EU AI Act enforcement begins scaling in 2026.
4. Multiple compression regime. If macro conditions deteriorate (tariffs, rates staying elevated), even high-quality names can sit at lower multiples for extended periods. The stock’s 1-year beta of 0.89 provides some buffer, but a 20x multiple on $17 in earnings only gets you to $340.
5. Concentration risk in AI narrative. Microsoft’s valuation re-rating depends partly on the market believing AI spending is productive. A broader “AI winter” or disappointment cycle could pressure sentiment even if fundamentals hold.
The Bottom Line
Microsoft is the kind of stock that doesn’t generate headlines until it’s already moved 30% higher. At $392, you’re buying a AAA-rated compounder with 17% earnings growth, a 99th-percentile quality profile, and a 17% discount to blended fair value.
The risk isn’t that Microsoft fails. The risk is that the market takes longer than you’d like to recognize what the numbers already show. And in that scenario, you collect a growing dividend, benefit from aggressive buybacks, and wait for the math to reassert itself.
This is a Buy with a 12-month target of $495. Accumulate at current levels, add aggressively below $380, and trim only above $523.
Next earnings report: April 29, 2026.
Master Metrics Table (MSFT)
| Metric | Value | Context |
|---|---|---|
| Price (Feb 27 close) | $392.74 | Down 29% from July 2025 high |
| Blended Fair Value | $475 | 17.3% margin of safety |
| 12M Target (probability-weighted) | $495 | +26% total return potential |
| P/E (Blended) | 25.2x | In line with S&P 500 average |
| Forward P/E | 20.7x | Below historical 5Y range (22-43x) |
| EPS (TTM) | $15.98 | FY27E: $19.02 (17% CAGR) |
| Quality Score | 99/100 | Top 1% of all stocks |
| Growth Score | 99/100 | Top 1% of all stocks |
| ROIC | 27.2% | ~18pt spread over WACC |
| Operating Margin | 46.7% | Expanding, elite for software |
| Free Cash Flow Margin | 25.3% | $77.4B TTM |
| Debt/Equity | 0.2 | AAA credit rating |
| Interest Coverage | 56.4x | Fortress-grade |
| Altman Z-Score | 8.2 | Well above 3.0 safe zone |
| Piotroski F-Score | 7/9 | Strengthening balance sheet |
| Dividend Yield (Fwd) | 0.9% | $3.64/share, 10Y CAGR 9.7% |
| Payout Ratio | 21.2% | Massive room for growth |
| 1Y Beta | 0.89 | Lower volatility than market |
| Max Drawdown (1Y) | -29.1% | Current drawdown from ATH |
| Analyst Consensus | Strong Buy (41/50) | Mean target $596 |
| Next Earnings | April 29, 2026 | Watch Azure growth rate |


Leave a comment