
General Motors (GM Stock Details Here) just posted the best trailing 12-month return of any Detroit automaker in a generation, up 70% in the past year, and the stock still trades at 5.9 times forward earnings. That is not a typo. A company generating north of $11 billion in free cash flow, aggressively repurchasing its own shares, and guiding for even higher profitability in 2026 trades for less than six times what it expects to earn. Somewhere between the EV headlines and the tariff noise, the market forgot to actually price in the cash.
This is the dilemma at the center of the (GM) thesis right now. The quant screens are screaming buy. The Vulcan database flags a 37% margin of safety against fair value. The 8.2% buyback yield means management is retiring shares at a pace that would make a private equity shop jealous. But the discretionary side of the brain whispers a different message: autos are cyclical, leverage is real, and “mid-cycle” cash flow has a habit of looking like “peak” right before the bottom drops out.
Both sides are correct. The question is which one deserves your capital, and at what price.
The Cash Flow Engine Detroit Built
Think of (GM) right now as two businesses bolted together under one hood. The first is the automotive operation, a massive manufacturing engine that sells trucks, SUVs, and crossovers across North America and internationally. This is the business generating the bulk of that $11 billion in free cash flow. The Chevrolet Silverado, GMC Sierra, and the Cadillac Escalade are not just vehicles; they are annuity streams with four-wheel drive.
The second business is GM Financial, a captive lending arm with $14.6 billion in tangible equity and a 15.5% return on that equity. Most investors glance at GM Financial and move on. That is a mistake. Valued properly using a residual income framework (the same approach institutional investors use for bank stocks), GM Financial alone is worth roughly $19.7 billion in a base case. That is more than a quarter of GM’s entire current market capitalization.
Then there is Cruise, the autonomous driving unit that GM took a $7.1 billion writedown on in Q4 2025. The market treated that charge like a funeral. In reality, it was a housecleaning. GM restructured both Cruise and its China operations simultaneously, clearing the decks for cleaner financials going forward. Cruise is worth zero in a base case, but it carries real option value if autonomous technology eventually scales.
The Math That Changes Everything
Here is where the story gets interesting, and where most casual observers stop reading too early.
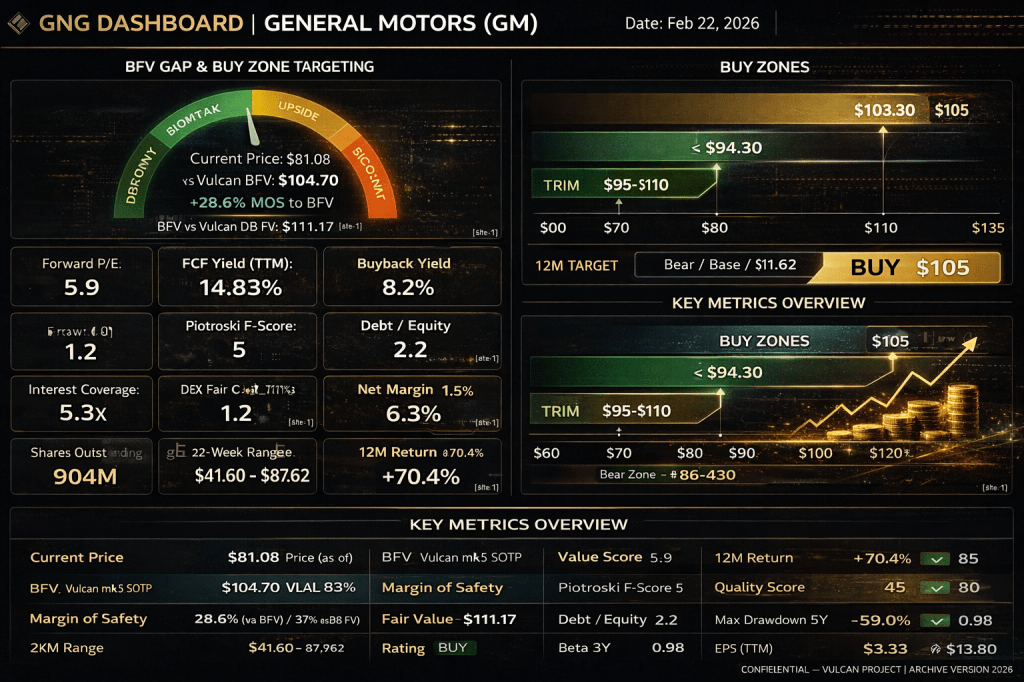
GM’s sum-of-the-parts valuation, built from the ground up with probability-weighted scenarios, produces a base fair value of $104.70 per share. At a recent price near $81, that is a 29% discount to intrinsic value. The Vulcan database independently calculates fair value at $111.17, which is even more generous.
The SOTP breaks down like this. In a bull scenario where automotive free cash flow sustains around $10 to $12 billion and (GM) Financial continues compounding at current returns, the equity is worth roughly $165 per share. In a base case where cycle normalization shaves margins and cash flow moderates, you get $84. In a bear case with a consumer recession and multiple compression, the floor sits near $58.
Weight those outcomes at 30% bull, 55% base, and 15% bear, and the probability-weighted anchor lands at $104.70. That is not a hope number. It is arithmetic disciplined by downside scenarios.
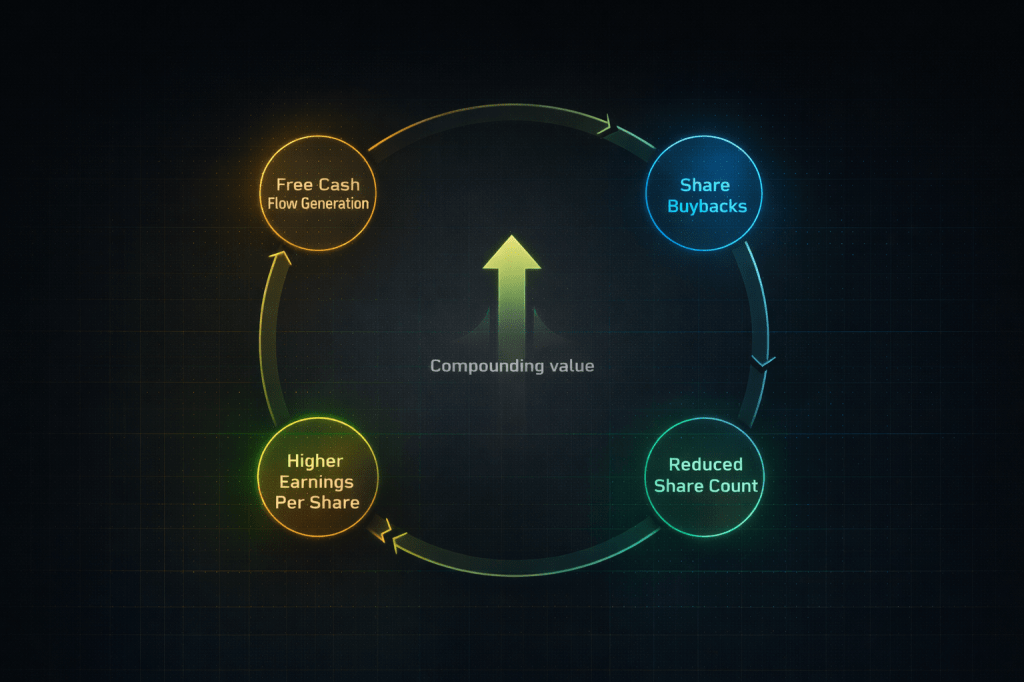
The buyback yield adds another layer. At 8.2%, GM is retiring shares faster than almost any company in the S&P 500 relative to its market cap. Every quarter that passes with the stock below intrinsic value, each remaining share becomes worth more. Mary Barra’s team is not just returning capital; they are compounding per-share value at an accelerating rate precisely because the stock is cheap.
Why the Market Keeps Discounting
If the math is this clean, why does GM trade at a single-digit multiple while the S&P 500 averages north of 20x?
Three words: cycle, leverage, and narrative.
The cycle risk is genuine. Auto sales are tied to consumer confidence, employment, and interest rates. A recession would compress both volumes and margins, and GM’s fixed-cost structure amplifies the pain on the way down. The 5-year max drawdown of 59% is not ancient history; it is a reminder of what happens when the cycle turns hard.
Leverage is the second anchor. GM carries a debt-to-equity ratio of 2.2x (Vulcan database), and the Altman Z-Score sits at 1.2, well inside the “distress zone” threshold of 1.8. For context, this does not mean GM is going bankrupt. The Z-Score was designed for manufacturers in the 1960s and auto OEMs with captive finance arms routinely score low because of the lending book. But it does mean the balance sheet offers no margin for error if cash flows deteriorate sharply.
The narrative discount is perhaps the most powerful. Wall Street has spent five years debating whether GM is an “EV company” or a “legacy automaker.” That identity crisis suppressed the multiple even as the core ICE business churned out record cash flow. The $7.1 billion Q4 charge was the market punishing GM for admitting what everyone already knew: the EV transition is expensive, uncertain, and not yet profitable.
Five Risks You Cannot Ignore
1. Consumer recession drives cash flow below $7 billion. GM’s 2026 adjusted automotive FCF guidance is $9 to $11 billion. If the economy softens meaningfully, incentives spike and volumes decline. A 30% FCF cut pushes the stock toward the bear case near $58. Monitor monthly SAAR data and GM incentive spending as leading indicators.
2. Altman Z-Score of 1.2 signals thin balance sheet cushion. While structurally expected for an auto OEM with a captive finance arm, it means GM has limited flexibility to absorb simultaneous shocks across auto operations and the lending book. A credit cycle downturn hitting GM Financial at the same time as an auto downturn is the left-tail scenario.
3. Tariff escalation compresses margins by 100 to 200 basis points. GM has more exposure to cross-border supply chains than Ford. The company is investing $63 million in its Oshawa plant to boost domestic production, but full reshoring is years away. Additional tariff rounds would hit margins before offsets materialize.
4. China operations remain a drag. Once GM’s largest market, China has become a restructuring exercise. The Q4 writedown cleared some of the overhang, but ongoing losses in the region reduce consolidated profitability. Watch quarterly China segment losses for stabilization or continued deterioration.
5. EV transition capex competes with shareholder returns. GM is balancing investment in next-generation EVs with buybacks and dividends. If EV losses persist or expand, management faces a choice between growth spending and the capital return program that supports the current valuation thesis. Any signal that buybacks are being reduced to fund EV losses would pressure the stock.
How to Play This: Exact Zones and Position Sizing
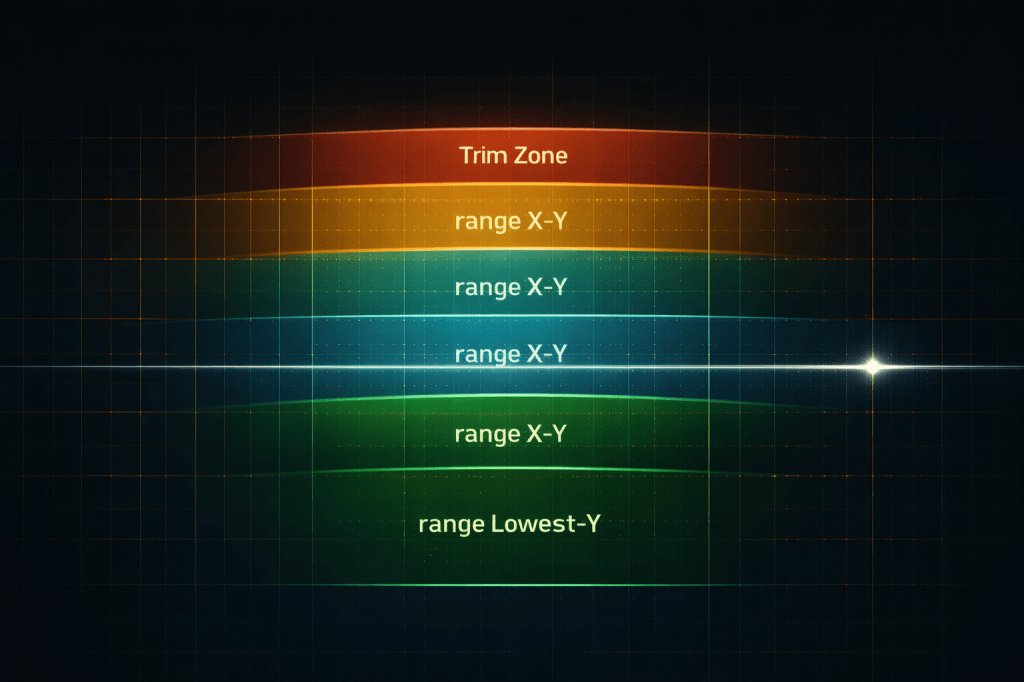
The Vulcan BFV-based action zones are built from the $104.70 probability-weighted anchor:
Buy zone (10% discount to BFV): $94.30 and below. This is where you initiate or add to a position with conviction. The current price of approximately $81 sits well inside this zone.
Strong buy zone (20% discount): $83.80 and below. At current prices, GM sits right at this threshold, which is why the conviction BUY rating applies here. You are buying a dollar of value for roughly 77 cents.
Very strong zone (30% discount): $73.30 and below. This is where you add aggressively if the thesis remains intact and no fundamental break has occurred.
Ultra zone (40% discount): $62.80 and below. This only happens in a recession or crisis. If it does, and the balance sheet holds, it is a generational entry.
Trim zone: $95 to $110. As the stock approaches fair value, scale out 10 to 20% of the position to recycle into higher-quality compounders or maintain dry powder for the next pullback.
Position sizing should reflect the cyclical nature: cap GM at 1 to 2% of a diversified portfolio. This is not a sleep-well-at-night compounder. It is a disciplined value trade with defined entry and exit points.
Invalidation trigger: if GM’s adjusted automotive FCF drops below $6 billion for two consecutive quarters without a clear temporary cause, the base case breaks and the position should be reassessed.
The Verdict
GM at $81 is a stock where the math works but the narrative does not cooperate. The forward P/E of 5.9x, the 8.2% buyback yield, and the 37% margin of safety are the kind of numbers value investors build careers around. The Altman Z-Score, the cyclicality, and the leverage are the kind of numbers that keep those same investors up at night.
The resolution is not to pick a side. It is to size the position for the risk, buy at disciplined levels, trim into strength, and let the buyback machine compound your per-share value while the market argues about EVs and tariffs. At current prices, you are being paid to own the controversy.
Rating: BUY | 12-Month Target: $105 | Buy Zone: $94.30 and below
Master Metrics Table
| Metric | Value | Source |
|---|---|---|
| Ticker | GM | — |
| Price (as-of) | $81.08 | Vulcan DB |
| BFV (SOTP, prob-weighted) | $104.70 | Vulcan-mk5 SOTP |
| Margin of Safety | 28.6% (vs BFV) / 37% (vs DB FV) | Vulcan-mk5 / DB |
| Fair Value (Vulcan DB) | $111.17 | Vulcan DB |
| Forward P/E | 5.9 | Vulcan DB |
| FCF Yield (TTM) | 14.83% | GNG |
| Buyback Yield | 8.2% | Vulcan DB |
| Altman Z-Score | 1.2 | Vulcan DB |
| Piotroski F-Score | 5 | Vulcan DB |
| Debt / Equity | 2.2 | Vulcan DB |
| Interest Coverage | 5.3x | Vulcan DB |
| ROIC | 1.6% | Vulcan DB |
| Net Margin | 1.5% | Vulcan DB |
| Gross Margin | 6.3% | Vulcan DB |
| Shares Outstanding | 904M | 10-K |
| 52-Week Range | $41.60 – $87.62 | Vulcan DB |
| 12M Return | +70.4% | MarketBeat |
| Quality Score | 45 | Vulcan DB |
| Value Score | 80 | Vulcan DB |
| Chowder Rule 5Y | 14.5% | Vulcan DB |
| Max Drawdown 5Y | -59.0% | Vulcan DB |
| Beta 3Y | 0.98 | Vulcan DB |
| EPS (TTM) | $3.33 | Vulcan DB |
| Avg EPS Est. Next Year | $13.80 | Vulcan DB |
| Buy Zone | ≤ $94.30 | BFV-derived |
| Strong Buy Zone | ≤ $83.80 | BFV-derived |
| Trim Zone | $95 – $110 | BFV-derived |
| Rating | BUY | Vulcan-mk5 |
| 12M Target | $105 | SOTP prob-weighted |
| Bear / Base / Bull | $58 / $84 / $165 | SOTP scenarios |
Analysis as of February 19, 2026. Not financial advice. Author holds positions discussed. All data from Vulcan-mk5 screening system, GNG Research, and public filings.


Leave a comment