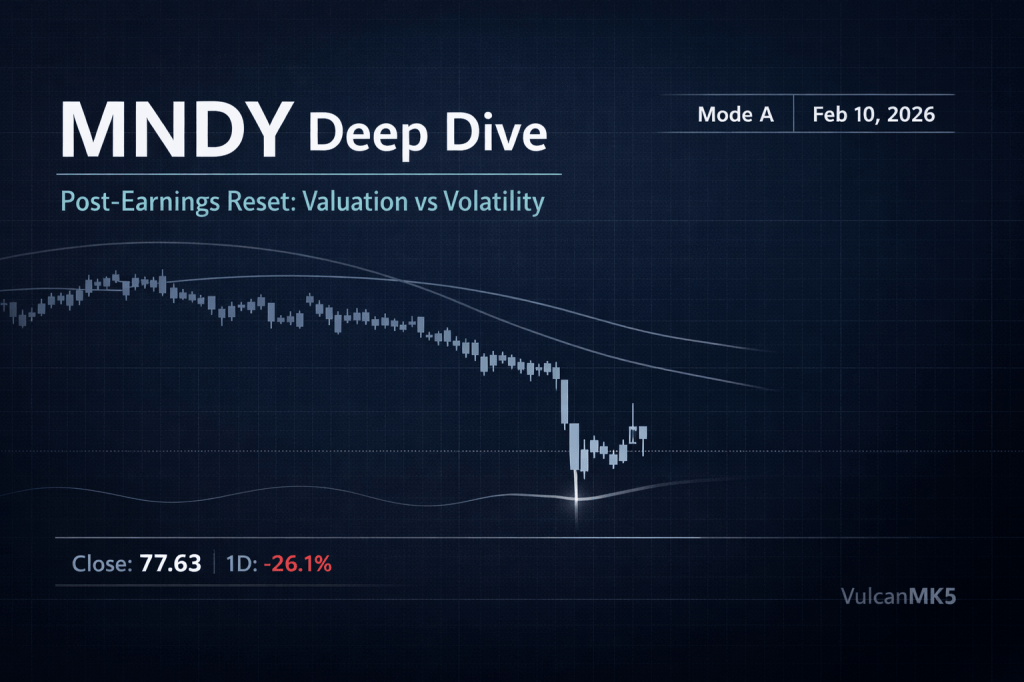
I watched Monday.com’s stock collapse 21% during Monday’s session on February 9th and did something that probably looks reckless: I started building a position.
Not because I’m brave. Because I’ve seen this movie before, and I know how it usually ends when a profitable software company with $1.67 billion in cash and securities gets priced like it’s headed for bankruptcy court.
Here’s what actually happened. Monday.com reported FY2025 revenue of $1.232 billion, up 27% year over year. Adjusted free cash flow hit $322.7 million, a 26% margin. Earnings per share of $1.04 beat estimates by nearly 15%. Enterprise customers spending over $100,000 annually hit a record, growing 45.5% year over year. By any rational standard, this was a strong quarter.
Then came the guidance. FY2026 revenue of $1.452 to $1.462 billion implies 18-19% growth, down from 27%. Management withdrew its previously communicated 2027 financial targets entirely. The company cited persistent challenges in no-touch SMB channels and a meaningful FX headwind from Israeli shekel appreciation.
Wall Street heard “growth is decelerating” and hit the eject button. The stock cratered from $98 to $77.63, punching through every technical support level on the chart like a bowling ball through tissue paper.
What the Panic Actually Created
Think of Monday.com as a toll bridge. Every company that routes its workflows, project management, and CRM through the platform pays a recurring toll. That toll bridge just reported 110% net dollar retention, meaning existing customers are spending 10% more each year. The bridge isn’t crumbling. Traffic is just growing at 18% instead of 27%.
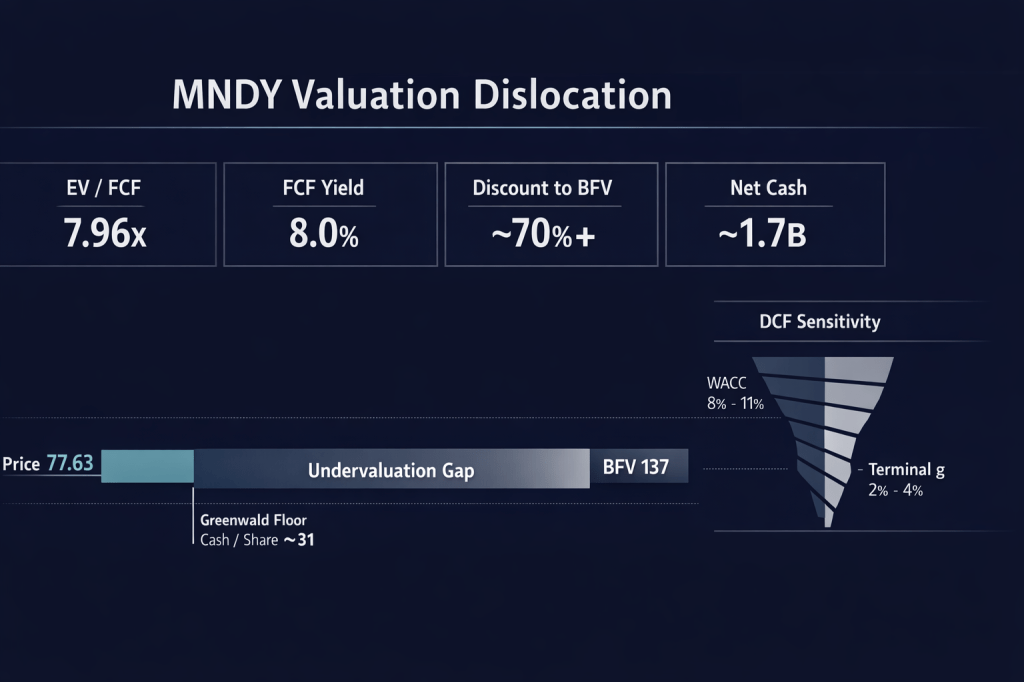
At $77.63 per share, here’s the math that matters. The company holds roughly $32 per share in cash and marketable securities. Strip that out, and you’re paying about $45 per share for a business generating north of $300 million in annual free cash flow. That’s an implied cash flow yield above 13% on a software company with 90% gross margins and zero meaningful debt.
The enterprise value sits around $2.4 billion against $322.7 million in trailing free cash flow. That’s roughly 7.5x EV/FCF for a company still 📊 growing revenues at nearly 20%. For context, Salesforce trades at roughly 14x, Atlassian around 17-23x depending on the measurement window, and ServiceNow at a premium to both. Monday.com is being priced like a value trap, but its unit economics scream compounder.
The Business Most Investors Don’t Understand
Monday.com isn’t just another project management tool competing with Asana and Trello. It’s evolved into what the company calls a “Work OS,” a platform layer that enterprises customize for everything from CRM to supply chain management. This matters because the switching costs are enormous once a company has built its workflows on the platform.
The numbers prove it. Customers spending over $50,000 annually now represent 41% of total ARR. Those large accounts show gross retention rates of 91% with renewal rates in the high 90s. Monday Vibe, the company’s AI-powered vibe-coding tool, hit $1 million in ARR in just 2.5 months, the fastest product adoption in the company’s history.
Remaining performance obligations grew to $839 million, up 37% year over year. That’s future revenue already contracted and waiting to be recognized. This is not a business in decline. It’s a business going through a growth normalization that the market is treating like an existential crisis.
[IMAGE 1 PLACEMENT: Business model / platform stickiness visualization]
The Counterintuitive Setup: Buying What Everyone Is Selling
Here’s what makes this setup genuinely compelling to me as a systematic investor. The reverse DCF tells us the market is pricing in negative cash flow growth for the next five years. Run the math with a 9.5% WACC and 3% terminal growth, and the implied 5-year FCF CAGR comes out to roughly negative 3% to negative 9% depending on your assumptions.
In plain English, the market believes Monday.com’s cash machine is going to shrink. Meanwhile, the company just guided for $275 to $290 million in FY2026 adjusted free cash flow, and that’s after deliberately increasing AI and R&D investment spending. Operating margin is compressing from 14% to 11-12% because management is choosing to invest, not because the business is deteriorating.
I’ve been doing this long enough to recognize the pattern. When a profitable software company trades below its zero-growth earnings power value (my estimate: roughly $93 per share), and the balance sheet carries enough cash to fund operations for years without external capital, the risk/reward skews heavily in favor of patient buyers.
My blended fair value triangulates to approximately $137, weighting a conservative DCF at 65%, peer multiples at 20%, and a Greenwald-style earnings power floor at 15%. At $77.63, that’s a margin of safety above 43%, with upside to fair value of roughly 76%.
Five Risks I’m Watching With Real Numbers
I don’t pretend this is a layup. The risks are specific and measurable.
First, AI disruption is real, not theoretical. Tools like Claude Code and other AI coding agents could reduce demand for workflow automation software. If Monday.com’s self-serve segment (smaller customers) continues deteriorating at the current pace, revenue growth could slip below 15% by FY2027, compressing the multiple further.
Second, share-based compensation is a silent tax. The gap between GAAP and non-GAAP operating income puts FY2025 SBC in the neighborhood of $175-180 million, roughly 14% of revenue. The company repurchased $135 million in shares, partially offsetting dilution, but the Vulcan database flags a 3.3% Compensation Yield, confirming the net dilution drag reduces true owner yield by several hundred basis points below headline FCF margins.
Third, geographic concentration creates binary risk. Approximately 55% of the company’s 3,155 employees are based in Israel. Geopolitical escalation could disrupt operations, increase costs, or trigger customer hesitancy. This is a tail risk, but it’s not zero.
Fourth, margin compression could be deeper than guided. Management projects gross margins declining from 90% toward the mid-to-high 80s in FY2026 due to AI compute costs. If AI infrastructure spending outpaces monetization, operating margins could compress below the guided 11% floor.
Fifth, the “guidance withdrawal” signal is concerning. Pulling previously communicated 2027 targets suggests management itself has limited visibility into medium-term growth trajectories. When management can’t forecast two years out, investors shouldn’t pretend they can either.
[IMAGE 2 PLACEMENT: Valuation / risk-reward visualization]
How I’m Playing This: Staged Entry With Discipline
This is a falling knife, and I treat it accordingly. Position sizing matters more than timing here.
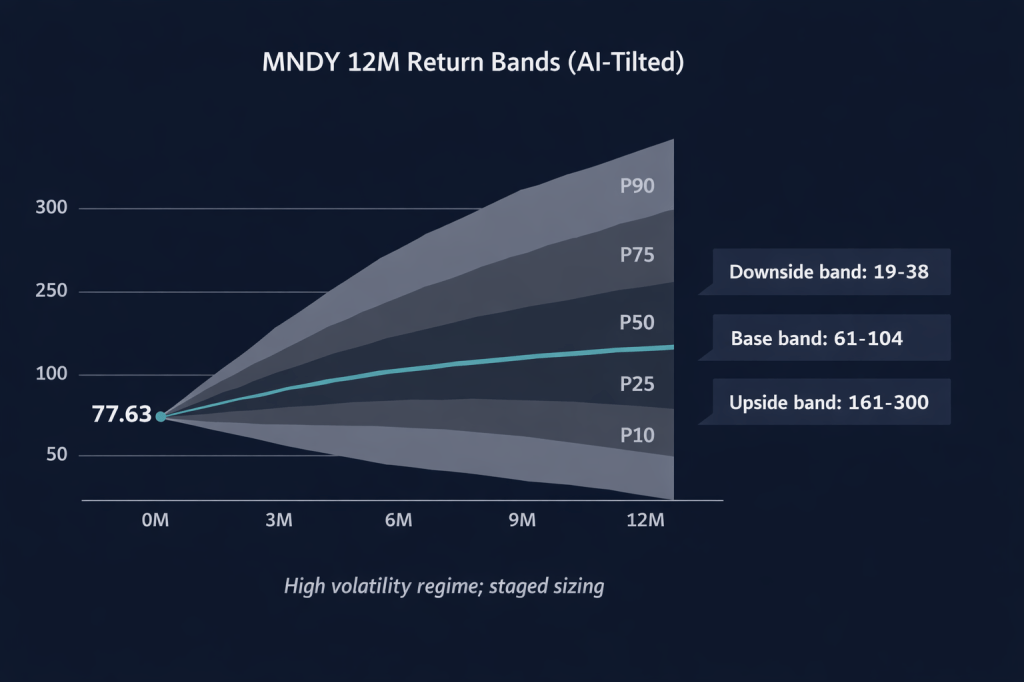
My plan uses a three-tranche entry. Tranche one: a starter position at current levels, sized at roughly 0.3-0.5% of portfolio. This respects the extreme volatility (1-year vol around 20%, max drawdown already exceeding 70% from highs) while getting skin in the game.
Tranche two triggers if the stock reclaims and holds $96-$100 for multiple sessions. That level represents prior breakdown support and would signal institutional buyers stepping in. I’d add to bring the position to roughly 0.8-1.0% of portfolio.
Tranche three activates on a break and hold above $110, near the 50-day moving average recovery zone. Full allocation target: 1.0-1.5% of portfolio, consistent with a high-conviction but high-volatility name.
The mental stop sits at $66, which represents a breach of the deep value floor. Below that level, the thesis is no longer about “cheap” but about “broken,” and I’d want to reassess the entire framework.
On the upside, my first trim zone begins near $137 (1x BFV). Heavier trimming near $160-$180 if momentum turns euphoric, which is plausible given the extreme compression in the current setup.
The Vulcan Systematic View
The Vulcan database scores Monday.com with a Quality Score of 59 and Growth Score of 80, reflecting the tension between current-state quality metrics (which suffer from the SBC drag and margin compression) and the still-robust growth trajectory. The Sentiment Score sits at a depressed 13, confirming the market’s extreme pessimism.
What the systematic screen highlights that most fundamental analysis misses: Monday.com’s Compensation Yield of 3.3% flags the dilution concern quantitatively. The Earnings Power Value of $15.95 per share from the database uses a more conservative methodology than my Greenwald estimate, but both point to the same conclusion, that the stock is trading well below any reasonable floor.
The Altman Z-Score of 4.7 and Piotroski F-Score of 6 both indicate a financially healthy company, not one approaching distress. The Beneish M-Score of -4.03 suggests no earnings manipulation. These are the signals I weigh when the price action is screaming “sell” but the fundamentals are whispering “buy.”
The Bottom Line
At $77.63, Monday.com is a profitable, cash-rich software platform being priced as if its business model is obsolete. It isn’t. Growth is normalizing, not evaporating. The balance sheet provides a genuine margin of safety. The reverse DCF implies expectations so low that even modest execution should generate positive returns.
I’m a buyer, but I’m a disciplined one. Starter tranche now. Patience for confirmation. Rules over conviction. The best trades I’ve ever made felt uncomfortable at entry.
Not investment advice. I hold a starter position in MNDY as of this writing.
Master Metrics Table
| Metric | Value | Source |
|---|---|---|
| Price (Feb 10, 2026) | $77.63 | Live |
| Market Cap | ~$4.0B | Calculated |
| Enterprise Value | ~$2.5B | Market Cap – Cash |
| Cash & Cash Equivalents | ~$1.5B (~$29/share) | CFO, Earnings Call |
| FY2025 Revenue | $1.232B (+27% YoY) | Company Filing |
| FY2025 Adj. FCF | $322.7M (26% margin) | Company Filing |
| FY2026 Revenue Guide | $1.452-$1.462B (+18-19%) | Company Filing |
| FY2026 FCF Guide | $275-$290M (19-20% margin) | Company Filing |
| EV/FCF (Trailing) | ~7.7x | Calculated |
| EV/FCF (FY26 Guide) | ~8.8x | Calculated |
| Gross Margin | 89-90% | Company Filing |
| Net Dollar Retention | 110% | Company Filing |
| Customers >$50K ARR | 4,281 (+33.7% YoY) | Company Filing |
| Customers >$100K ARR | 1,756 (+45.5% YoY) | Company Filing |
| RPO | $839M (+37% YoY) | Company Filing |
| SBC (FY2025, est.) | ~$175-180M (~14% of revenue) | GAAP/Non-GAAP Gap |
| Shares Repurchased (FY2025) | $135M / 884K shares | Company Filing |
| Buyback Authorization Remaining | $735M | Company Filing |
| Blended Fair Value | ~$137 | Vulcan Model |
| Margin of Safety vs BFV | ~43% (traditional) | Calculated |
| Earnings Power Value (Floor) | ~$93 | Vulcan Model |
| Vulcan Quality Score | 59 | Vulcan DB |
| Vulcan Growth Score | 80 | Vulcan DB |
| Vulcan Sentiment Score | 13 | Vulcan DB |
| Altman Z-Score | 4.7 | Vulcan DB |
| Piotroski F-Score | 6 | Vulcan DB |
| RSI (14) | ~16.8 | Technical |
| Buy Zone: Ultra Value | Below $82 | Vulcan Model |
| Buy Zone: Strong Buy | $96-$110 | Vulcan Model |
| Trim Zone | Above $137 | Vulcan Model |
| Invalidation Level | $66 | Vulcan Model |


Leave a comment