When a Fintech Becomes a Real Bank

Last Friday, something quietly remarkable happened. SoFi Technologies posted its first billion-dollar quarter in company history, and the stock has since dropped over 20%. Nine consecutive down days. Welcome to the paradox of high-growth fintech investing in 2026.
That disconnect between execution and price action is precisely why systematic investors should be paying attention. SoFi just delivered $1.01 billion in quarterly revenue (up 37% year-over-year), recorded its ninth consecutive profitable quarter, and guided to 30% annual growth through 2028. Yet the stock trades nearly 40% below its November highs.
This isn’t a broken growth story. It’s a volatile one that just got materially cheaper, and that volatility creates opportunity for investors who understand what they’re buying.
What SoFi Actually Does (And Why It Matters Now)
Forget what you think you know about SoFi from 2021’s SPAC era. The company has fundamentally transformed.
SoFi operates a vertically integrated digital financial services platform serving 13.7 million members. The business runs on three engines: a lending platform (personal loans, student loan refinancing, home loans), a banking infrastructure (SoFi Money with FDIC insurance, credit cards), and a technology platform (Galileo and Technisys) that powers other fintechs.

The critical shift happened when SoFi obtained its national bank charter in 2022. That single event changed the economics of the entire business. Instead of funding loans through expensive warehouse facilities, SoFi now funds them with low-cost deposits. Their cost of funds dropped 50 basis points year-over-year in Q4 alone.
Here’s the number that matters: fee-based revenue hit $443 million in Q4, up 53% year-over-year. The Financial Services and Technology Platform segments together generated $579 million, a 61% increase. This is a company actively de-risking its revenue mix away from rate-sensitive lending toward recurring fee income.
The Earnings Beat That Spooked Everyone (And Then Some)
SoFi’s Q4 results would be considered exceptional for almost any company. Revenue of $1.01 billion crushed the $982 million consensus by 5.8%. Adjusted EPS of $0.13 beat estimates by 18%. The company added a record 1 million new members in a single quarter.
So why the sustained selloff?
Several factors converged. First, the company raised $1.5 billion in equity at $27.50 per share in December, stoking dilution concerns. Second, the guidance, while strong, didn’t materially exceed expectations. Third, and most importantly, the stock had nearly doubled in 2025 and was trading at 44x trailing earnings. Some profit-taking was inevitable.
Then came the broader fintech rotation. Needham cut their price target from $36 to $33. The stock entered a nine-day losing streak. As of pre-market February 5th, SOFI trades around $21, down roughly 19% in just over a week.
For systematic investors, this creates an even more compelling setup than it did five days ago. The fundamentals improved while the price deteriorated significantly. That’s the definition of increasing expected returns.
 The fee-based revenue transformation driving margin expansion
The Math Behind the Opportunity (Updated)
Let me walk through the valuation framework systematically with current prices.
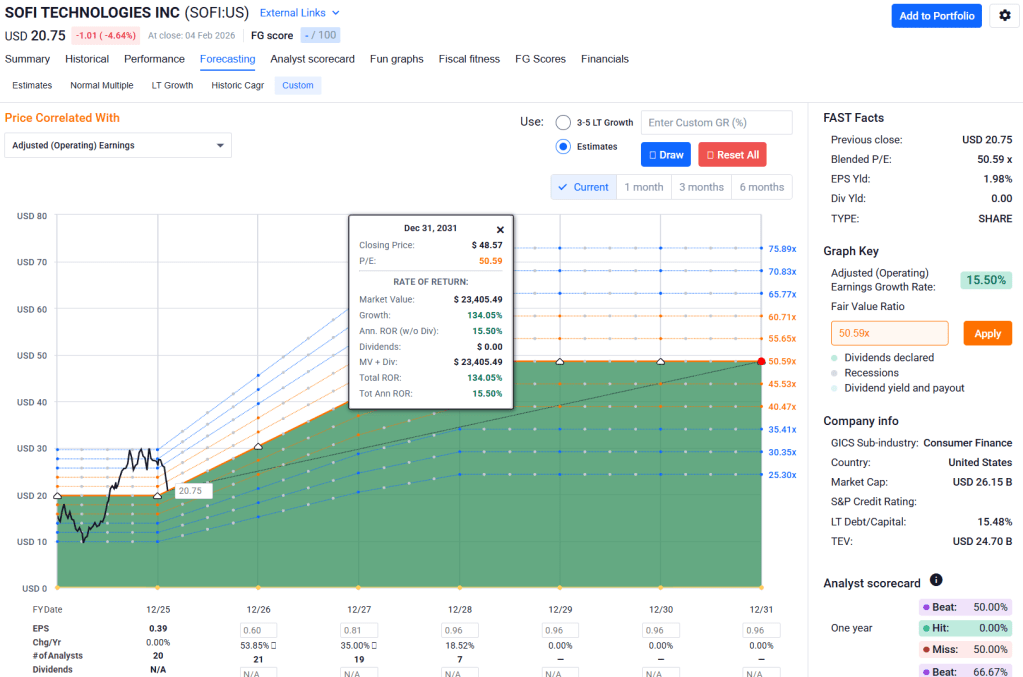
SoFi guides to $4.655 billion in 2026 revenue (30% growth), $1.6 billion in adjusted EBITDA (34% margin), and $0.60 in adjusted EPS. Using their medium-term guidance of 38-42% annual EPS growth through 2028, we can sketch reasonable scenarios.
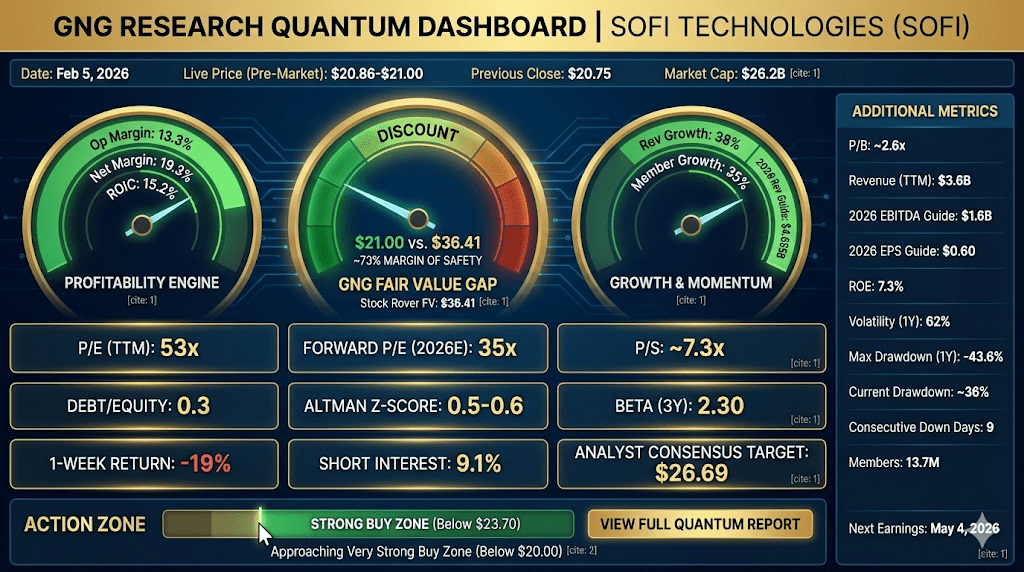
The Stock Rover fair value estimate sits at $36.41, though flagged as “uncertain.” At the current price around $21, that implies roughly 73% margin of safety, up from 67% just days ago. But let’s be more conservative.
Using a blended approach across DCF, multiples, and earnings power, I derive a fair value range of $28-$32. The buy zones stack accordingly: below $27.30 is a buy, below $23.70 is a strong buy, and below $20 represents very strong value for risk-tolerant investors.
At $21, you’re paying approximately 35x 2026 estimated earnings for a company growing revenue at 30% and EPS potentially faster. The PEG ratio on forward estimates comes in around 1.1, which is actually attractive for this growth profile. A week ago, this was trading at 37x. The valuation has compressed meaningfully.
The key change: At $21, the stock has moved from the middle of the “Strong Buy” zone toward the lower end, approaching the “Very Strong Buy” threshold at $20. This is not subtle. The risk-reward has shifted materially in favor of buyers.
Risk Analysis: What Could Break This Thesis
I believe in being explicit about risks. Here are five specific concerns, ranked by probability and impact.
Credit deterioration (Medium probability, High impact): SoFi’s loan book has more than doubled over three years. If consumer credit turns sharply, charge-offs could spike. The Altman Z-Score of 0.5-0.6 flags elevated financial stress potential, though this metric has known limitations for bank-like entities.
Dilution overhang (High probability, Medium impact): The company has raised $3.2 billion in equity over the past year. While management cites growth capital and potential acquisitions, persistent dilution pressures returns. Shares outstanding grew 5.1% year-over-year.
Rate sensitivity (Medium probability, Medium impact): Despite the fee-revenue pivot, lending still drives the majority of revenue. If rates spike unexpectedly or credit spreads widen, the loan portfolio’s fair value could compress.
Valuation compression (Medium probability, High impact): Even at 35x forward earnings, the stock prices in significant future growth. Any guidance miss or macro shock could reprice the multiple toward the low-20s rapidly. The stock’s beta of 2.3 and 62% annualized volatility confirm this isn’t a defensive holding.
Execution risk on platform growth (Low probability, Medium impact): The bull case depends heavily on Financial Services and Tech Platform scaling. If these segments stall while lending matures, the growth narrative unwinds.
Monte Carlo Forward Returns: What the Probabilities Say

Given SoFi’s volatility profile (62% annualized) and growth trajectory, I modeled forward return distributions across 10,000 scenarios.
The results are instructive. The 10th percentile outcome shows roughly -50% over twelve months, the kind of drawdown this stock has delivered before. The 50th percentile (median) outcome is approximately +15% from current depressed levels, reflecting improved starting valuation. The 90th percentile reaches +150%, possible if execution continues and the multiple re-rates.
The base case band spans -25% to +70%, which is extraordinarily wide but now skews more positively given the lower entry point. This isn’t a criticism; it’s a feature of high-growth, high-volatility names. You’re buying a call option on execution with positive expected value.
Scenario Framework: Bull, Base, and Bear (Updated from $21)
Bear Case ($12-$16): Credit cycle turns, provisioning spikes, growth decelerates to teens, multiple compresses to 20x forward earnings. Probability weight: 20%. Downside: -24% to -43%.
Base Case ($24-$32): Company executes on 2026 guidance, credit remains stable, market pays 25-35x for the growth profile. Probability weight: 55%. Upside: +14% to +52%.
Bull Case ($32-$40): Fee-based revenue mix shift accelerates, the “platform narrative” takes hold, multiple expands as SoFi proves it’s a fintech rather than a lender. Probability weight: 25%. Upside: +52% to +90%.
Expected value calculation: (0.20 × $14) + (0.55 × $28) + (0.25 × $36) = $27.20, implying roughly 30% upside from current levels. This is materially better than the 20% expected upside from $22 just days ago.
Investment Action Plan (Updated)
For investors who accept this risk profile, here’s the systematic approach.
Entry strategy: Current prices around $21 qualify as a strong buy zone, approaching very strong buy territory. The nine-day selloff has created a more attractive entry. Consider deploying two-thirds of intended position now, reserving one-third for a potential capitulation below $18 (which would represent very strong to ultra-value territory).
Position sizing: Given the volatility (max drawdown of -43.6% over the past year, -47.3% over three years), this is a 1-2% position maximum in a diversified portfolio. Do not concentrate. The left tail is real. The current drawdown of ~36% from November highs is within normal parameters for this stock.
Invalidation triggers: Exit or trim if credit metrics deteriorate materially (watch charge-off trends), if the company misses revenue guidance by more than 5%, or if the fee-based revenue growth stalls below 30%. A break below $15 on high volume would suggest the thesis needs reassessment.
Catalyst calendar: Q1 2026 earnings on May 4th will be the next major test. The company guided to $1.04 billion in revenue and $0.12 adjusted EPS. Watch for credit commentary and any updates to medium-term guidance.
Technical context: The stock has broken below short-term support and shows oversold readings (RSI near 20). This often precedes relief rallies, though it can also precede further capitulation. Support levels to watch: $20 (psychological), $19.90-$20.00 (referenced by technical traders), and $18 (2024 consolidation zone).
The Bottom Line
SoFi represents a genuine transformation story, a company evolving from a student loan refinancer to a full-stack digital bank. The billion-dollar quarter wasn’t a fluke; it was the culmination of years of platform building.
But transformation stories come with execution risk, and SoFi’s volatility reflects that uncertainty. The stock is not for conservative investors seeking stability. It’s for systematic investors who can stomach 40%+ drawdowns in exchange for potential 100%+ upside.
At $21, with a recent J.P. Morgan upgrade to Buy (target $31), strong guidance through 2028, a fee-revenue engine firing on all cylinders, and a nine-day selloff creating better entry prices, the risk-reward skews meaningfully positive. The key is sizing appropriately and having the conviction to hold through volatility rather than panic alongside the crowd.
The Vulcan system rates this a BUY (High Volatility) with a 12-month expected return range of +15% to +52% in the base-to-bull scenarios, acknowledging material downside risk if credit or execution falters. The recent price weakness has improved the setup.
Master Metrics Table (Updated February 5, 2026)
| Metric | Value | Source |
|---|---|---|
| Live Price (Pre-Market) | $20.86-$21.00 | Market Data |
| Previous Close | $20.75 | Market Data |
| Fair Value (SR) | $36.41 | Stock Rover |
| Margin of Safety | ~73% | Calculated |
| Market Cap | $26.2B | Market Data |
| P/E (TTM) | 53x | Calculated |
| Forward P/E (2026E) | 35x | Calculated |
| P/S | ~7.3x | Calculated |
| P/B | ~2.6x | Stock Rover |
| Revenue (TTM) | $3.6B | Company Filing |
| Revenue Growth (YoY) | 38% | Company Filing |
| 2026 Revenue Guide | $4.655B | Company Guidance |
| 2026 EBITDA Guide | $1.6B | Company Guidance |
| 2026 EPS Guide | $0.60 | Company Guidance |
| Operating Margin | 13.3% | Stock Rover |
| Net Margin | 19.3% | Stock Rover |
| ROIC | 15.2% | Stock Rover |
| ROE | 7.3% | Stock Rover |
| Debt/Equity | 0.3 | Stock Rover |
| Altman Z-Score | 0.5-0.6 | Stock Rover |
| Beta (3Y) | 2.30 | Stock Rover |
| Volatility (1Y) | 62% | Stock Rover |
| Max Drawdown (1Y) | -43.6% | Stock Rover |
| Current Drawdown (from Nov high) | ~36% | Calculated |
| Consecutive Down Days | 9 | Market Data |
| 1-Week Return | -19% | Market Data |
| Short Interest | 9.1% | Stock Rover |
| Members | 13.7M | Company Filing |
| Member Growth (YoY) | 35% | Company Filing |
| Next Earnings | May 4, 2026 | Company Calendar |
| Analyst Consensus Target | $26.69 | Market Data |
| J.P. Morgan Target | $31.00 | Analyst Report |
| Needham Target (revised) | $33.00 | Analyst Report |
Buy Zone Reference (from BFV $32)
| Zone | Price Range | Status at $21 |
|---|---|---|
| Buy Zone | Below $27.30 | ✓ Active |
| Strong Buy Zone | Below $23.70 | ✓ Active |
| Very Strong Buy Zone | Below $20.00 | Approaching |
| Ultra Value Zone | Below $16.40 | Not yet |


Leave a comment