
When Wall Street’s referee starts slimming down, smart money pays attention. Analysis done by Vulcan Engine and the GNG Research Team.
The 10% Gift Nobody Expected
Something unusual happened on February 3rd. S&P Global, the company that literally rates the creditworthiness of the entire financial world, announced a new brand name for its automotive data unit. Shares dropped 10% in a single session, from $527 to $470. As I write this on February 4th the price has dropped another 3.6%.
Let that sink in. One of the most boring, predictable announcements imaginable, a brand name change for a planned spin-off, triggered the worst single-day decline this company has seen in years.
This is the kind of disconnect between price action and fundamentals that systematic investors live for.
What SPGI Actually Does (And Why It Matters)
Think of S&P Global as the plumbing of financial markets. When a corporation issues bonds, SPGI rates them. When investors benchmark their portfolio against the S&P 500, SPGI collects licensing fees. When hedge funds need real-time commodity prices, SPGI provides the data. When institutional traders analyze companies, SPGI’s Market Intelligence platform powers their workflows.
This isn’t glamorous work. It’s better than glamorous, it’s essential.
The company operates five segments, though that number drops to four after the Mobility spin-off completes later this year. Ratings generates credit opinions that banks, insurance companies, and pension funds are legally required to consider. Indices manages the most recognized stock benchmarks on the planet, including the S&P 500 itself. Market Intelligence provides the terminals and data feeds that professional investors depend on daily. Commodity Insights delivers the pricing benchmarks for energy, metals, and agricultural markets.
And then there’s Mobility, the automotive data division best known for CARFAX. Useful, profitable, but awkwardly positioned next to the crown jewels.
The Separation Catalyst
On April 29, 2025, management announced plans to spin off Mobility into a standalone company now called Mobility Global. The separation should complete by late 2026, subject to regulatory approvals and an effective Form 10 filing with the SEC.
Why does this matter?
Mobility operates at structurally lower margins than the core financial data businesses. FY2024 segment operating profit was $312 million for Mobility versus $2.7 billion for Ratings alone. When you blend a 25% operating margin business with 55%+ margin businesses, the conglomerate multiple compresses. Analysts struggle to value the whole because the parts don’t belong together.
Post-spin, the remaining S&P Global becomes a cleaner story: credit ratings, benchmark indices, commodity data, and market intelligence. Four businesses that share customers, pricing power, and workflow integration. The market should reward that simplicity with a higher multiple.
The February 3rd selloff, triggered by nothing more than the Mobility Global branding announcement, created an entry point that didn’t exist a week ago.
The Numbers That Matter
Let’s triangulate fair value using multiple approaches.
SOTP Analysis: Using FY2024 segment operating profit and appropriate peer multiples, I get a base case per-share value around $468. Bear case is $396, bull case is $536. Current price sits almost exactly at base case SOTP, meaning you’re paying nothing for any improvement in 2025 earnings power or post-spin multiple expansion.
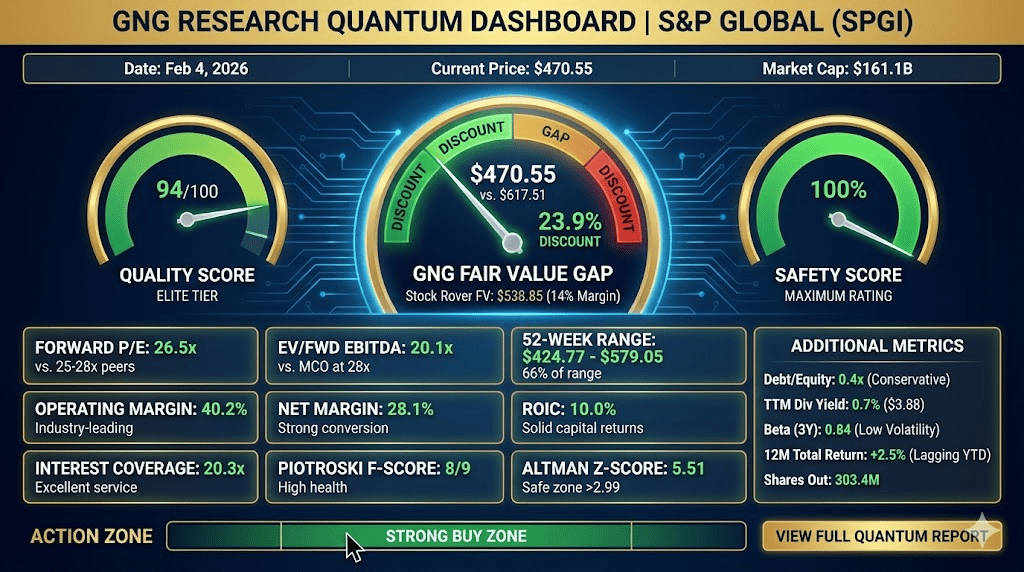
DCF Anchor: Stock Rover’s blended fair value model shows $538.85, implying 14% margin of safety at current prices. GNG Research’s proprietary model shows $617.51 fair value, suggesting nearly 24% discount to intrinsic worth.
Peer Comparison: Moody’s trades around 28x forward EV/EBITDA. MSCI commands mid-20s. SPGI at 20x represents a meaningful discount to its closest comparable peers, even before the cleaner post-spin structure.
Health Indicators: Piotroski F-Score of 8/9 (High), Altman Z-Score of 5.51 (Safe), and Beneish M-Score of -1.85 suggest this is a fundamentally sound business trading at a discount due to temporary execution noise, not structural deterioration.
Technical Context
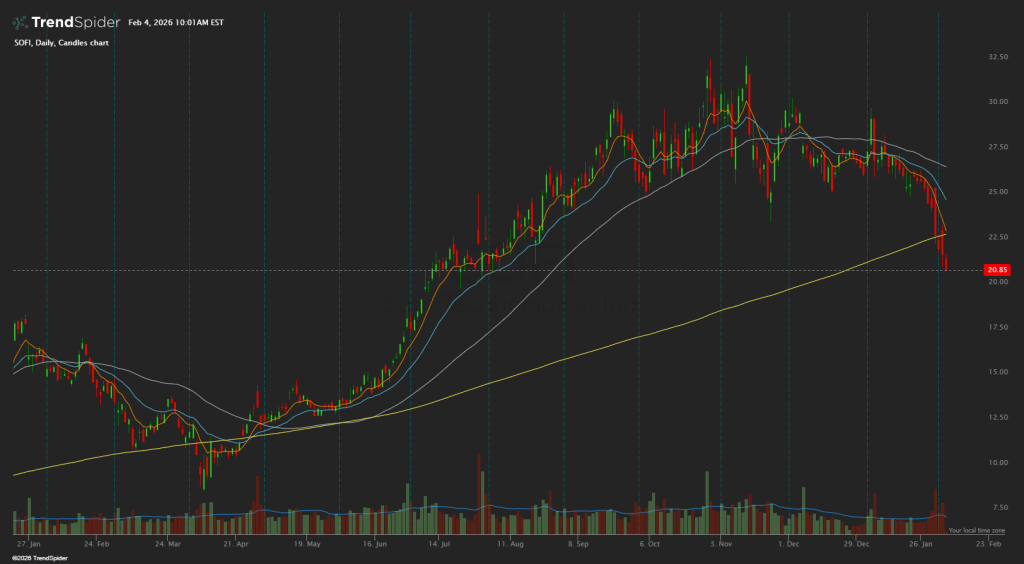
The chart shows SPGI broke below its 200-day moving average during the February 3rd selloff, currently testing support in the $468-$470 zone. This level corresponds to both the October 2025 lows and the current pivot point calculated at $527.70.
Key technical levels to watch include the S1 support at $523.10, S2 at $518.41, and S3 at $513.81. With RSI at 49.7 (neutral) and Williams %R at -71.5 (approaching oversold), momentum indicators suggest the selling pressure may be exhausting itself.
The 52-week range spans $424.77 to $579.05, putting current prices in the lower third of that range, roughly 66% of the way from the low to the high. For a Quality Score 94 business with this earnings visibility, that positioning creates asymmetric upside.
The Risk Map
No investment thesis survives contact with reality without understanding what can break it.
Ratings Cyclicality: When corporate bond issuance slows, Ratings segment revenue can compress quickly. The February 10th earnings call will provide critical commentary on 2026 issuance expectations.
Regulatory and Credibility Risk: The rating agencies have operated under regulatory scrutiny since 2008. Any new regulatory push or high-profile ratings failure could pressure the business model.
Spin Execution Risk: Timeline slippage, cost dis-synergies, or unexpected debt allocation between RemainCo and Mobility Global could disappoint investors.
Market-Level Exposure: Indices revenue correlates with AUM levels, and Market Intelligence subscription growth depends on financial services hiring. A broad market downturn affects multiple segments simultaneously.
Interest Rate Sensitivity: Higher rates compress bond issuance (Ratings) but can also support market activity (Market Intelligence). The directional impact depends on rate trajectory.
The Earnings Catalyst
Q4 and Full-Year 2025 results drop February 10, 2026, six days from now. This print is the next major catalyst for two reasons.
First, it confirms whether the strong 2025 guidance management maintained through Q3 actually materialized. They projected record adjusted EPS with 180 basis points of margin expansion and $2.5 billion in Q4 share repurchases. Verification matters.
Second, management should provide color on separation costs, timeline, and 2026 financial guidance for RemainCo. This is the first opportunity to model the post-spin business with real numbers rather than estimates.
The risk is that guidance disappoints or separation details create uncertainty. The reward is confirmation that the 10% selloff was noise, not signal.
Action Framework
Current Price: $470.55 (Feb 4, 2026)
Buy Zones:
- Good Buy: Below $494.01
- Strong Buy: Below $444.61
- Very Strong Buy: Below $395.20
- Ultra Value: Below $345.80
Trim Zone: Above $580
Position Sizing: This is a Quality Compounder, not a speculative turnaround. Size appropriately for core holdings, likely 1-2% of portfolio for diversified investors. The volatility around the spin creates opportunity but also near-term drawdown risk.
Invalidation Triggers: A break below $420 combined with deteriorating Ratings commentary or spin delays beyond 2026 would challenge the thesis. Below $395 warrants a full position review.
Pre-Earnings Posture: The current price offers favorable risk/reward, but adding ahead of the February 10th print requires conviction that execution will confirm guidance. Conservative investors may prefer buying half now and half post-earnings.
The Probability-Weighted View
I assign three scenarios for the next 12 months:
Bull Case (25% probability) | PT $600: Strong issuance cycle, clean Mobility separation with market-friendly terms, indices fee acceleration from AUM growth.
Base Case (55% probability) | PT $525: Steady subscription growth, normalized issuance, separation milestones progress without friction, valuation converges toward blended fair value.
Bear Case (20% probability) | PT $410: Issuance downturn persists, regulatory pressure on Ratings, spin execution drags with cost surprises.
Probability-Weighted 12-Month Target: ~$525 (+12% from current levels)
Forward 12-month return distribution from Bayesian/Monte Carlo modeling suggests downside of -22% to -8% at the 10th-25th percentile, base returns of +3% to +27% at the 40th-75th percentile, and upside of +27% to +47% at the 75th-90th percentile.
Final Verdict
Rating: BUY on pullbacks into the buy shelf
SPGI represents the rare combination: a franchise business with oligopoly characteristics trading at a discount due to temporary noise. The Mobility spin-off, far from being a distraction, is actually the catalyst that unlocks a simpler story and likely higher multiple.
The February 3rd selloff was a gift. Whether you take the gift depends on your conviction about separation execution and 2026 issuance trends.
I would not chase above $500. Below $470, the math gets increasingly attractive. Below $445, this becomes compelling for quality-focused portfolios.
Master Metrics Table
| Metric | Value | Context |
|---|---|---|
| Quality Score | 94/100 | Elite tier |
| Safety Score | 100% | Maximum rating |
| Piotroski F-Score | 8/9 | High financial health |
| Altman Z-Score | 5.51 | Safe zone (>2.99) |
| Forward P/E | 26.5x | vs. 25-28x peer range |
| EV/Forward EBITDA | 20.1x | vs. MCO at 28x |
| Operating Margin | 40.2% | Industry-leading |
| Net Margin | 28.1% | Strong conversion |
| ROIC | 10.0% | Solid capital returns |
| Interest Coverage | 20.3x | Excellent debt service |
| Debt/Equity | 0.4x | Conservative leverage |
| TTM Dividend Yield | 0.7% | $3.88 annualized |
| Beta (3Y) | 0.84 | Below market volatility |
| 12-Month Total Return | +2.5% | Lagging market YTD |
| Current Price | $470.55 | As of Feb 4, 2026 |
| Fair Value (GNG) | $617.51 | 23.9% discount |
| Fair Value (Stock Rover) | $538.85 | 14% margin of safety |
| 52-Week Range | $424.77-$579.05 | 66% of range |
| Market Cap | $161.1B | Large cap |
| Shares Outstanding | 303.4M | Float |
References
- S&P Global Investor Relations: Q4 2025 Earnings Announcement (Feb 10, 2026)
- S&P Global Press Release: Mobility Global Brand Identity (Feb 3, 2026)
- S&P Global 2024 Annual Report: Segment Operating Profit Data
- GNG Research Terminal: Proprietary Valuation Model
- Stock Rover Research Report: Fair Value and Quality Scoring
- Finbox: Peer EV/EBITDA Comparisons (MCO, MSCI, ICE)
- Nasdaq News: SPGI Stock Price Action (Feb 3, 2026)
Data as of February 4, 2026. This analysis represents systematic research, not personalized investment advice. Position disclosure: The author may hold positions in securities mentioned. Always conduct your own due diligence.


Leave a comment