
Vulcan-mk5 Deep Analysis powered by GNG Research.com | January 2026
The $4,600 Question Nobody’s Asking
When gold crossed $4,600 per ounce this week, most investors fixated on the headline number. The financial media ran predictable “gold at record highs” segments. Retail traders piled into mining stocks chasing momentum.
But the real story isn’t the commodity price. It’s what’s happening inside Newmont Corporation’s balance sheet that makes this cycle look different on balance-sheet discipline versus prior gold rallies.
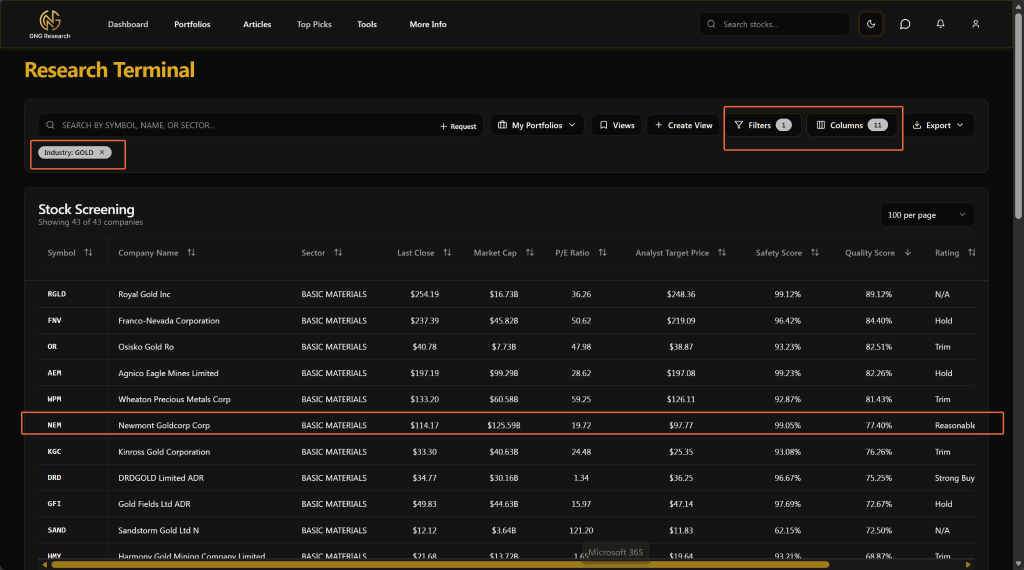
Newmont (NEM) posted $1.6 billion in free cash flow last quarter alone. That’s not a typo. In a single quarter, the world’s largest gold miner generated more cash than many S&P 500 companies produce annually. They’re sitting on $5.6 billion in cash with near-zero net debt. Their Piotroski F-Score hit a perfect 9, placing them in the 98.6th percentile of my entire 6000+ stock database.
This isn’t your grandfather’s gold mining company anymore. This is a cash flow machine that happens to dig yellow metal out of the ground.
The Transformation Story You Missed

Two years ago, Newmont looked like every other bloated mining conglomerate. Sprawling assets across dozens of countries. Inconsistent production. Margins that compressed whenever costs ticked up. The stock languished while gold prices rose.
Then management did something mining executives rarely do. They got ruthless.
The Newcrest acquisition in November 2023 wasn’t about getting bigger. It was about getting better. Newmont systematically shed non-core assets, exited marginal mines, and concentrated capital into what they call “Tier 1” properties. These are long-life, low-cost operations that print money at almost any gold price.
The Ahafo North project in Ghana represents this philosophy perfectly. It entered commercial production in late 2025 and is expected to add approximately 5% to Newmont’s annual output once fully ramped, at costs below company averages. When your new mine is designed to be both higher-volume AND lower-cost than your existing portfolio, you’re doing something right.
The numbers tell the story. Operating margins expanded to 43.5%. Net margins hit 33.4%. ROIC climbed to 19.2%, which is exceptional for a capital-intensive mining business. For context, most miners struggle to generate returns above their cost of capital. Newmont is earning nearly three times its 7.1% WACC.
Why Traditional Valuation Metrics Are Failing Here
Here’s where most analysis gets lazy. Analysts look at Newmont’s forward P/E of 14.1 and declare it “fairly valued.” Stock Rover’s model spits out a fair value of $111.78 versus the current $114.21 price, showing a negative 2% margin of safety.
But these models are anchored to assumptions that may already be obsolete.
Major banks are projecting gold at $4,800 to $5,000 per ounce by Q4 2026. J.P. Morgan expects central bank and investor demand to average 585 tonnes per quarter through 2026. Morgan Stanley published $4,800 targets. Goldman Sachs went to $4,900. Citigroup recently called for $5,000 by March.
If those forecasts prove correct, Newmont’s current earnings dramatically understate its run-rate profitability. As a simplified mine-level heuristic: at $4,600 gold with all-in sustaining costs around $1,630 per ounce, the spread is roughly $3,000 per ounce. If gold reaches $5,000, that spread widens to $3,370 per ounce, a 12% improvement with zero additional operational execution required. This isn’t accounting profit, but it illustrates the operating leverage embedded in the business.
The GNG Research terminal calculates fair value at $120.65, with a “Reasonable Buy” rating. That’s 5.6% upside from current levels even before accounting for further gold appreciation.
The Monte Carlo Reality Check
I ran two Monte Carlo simulations using different lookback periods to stress-test the thesis.
The 3-year lookback, which captures the current gold regime, projects a median outcome of 60% returns over the next year with only 11% probability of loss. Expected final value on a $100,000 position: $172,914.
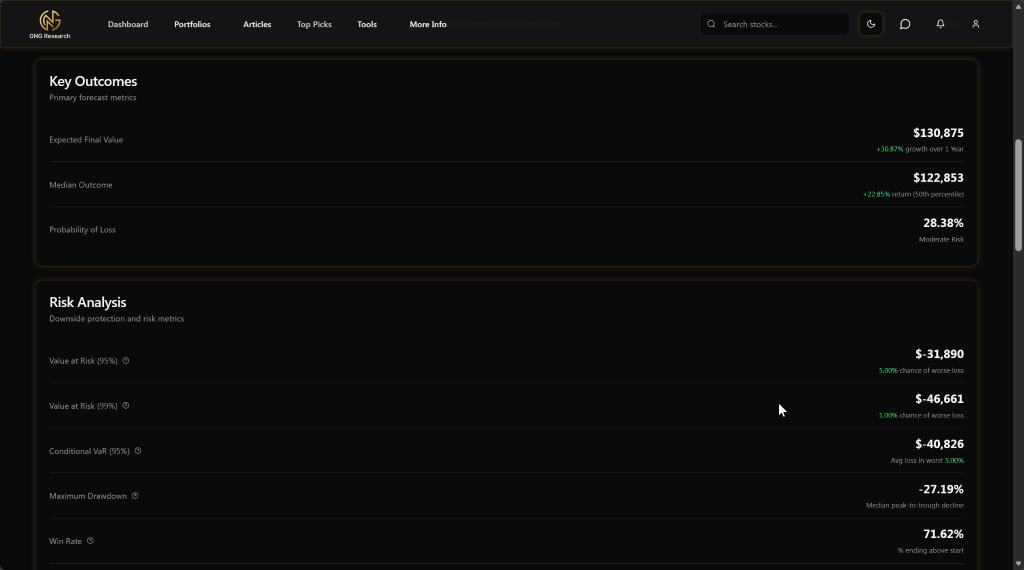
The 10-year lookback, which includes the 2015-2020 gold doldrums, shows more modest expectations. Median outcome of 23% returns with a 28% probability of loss. Expected final value: $130,875.
The divergence between these simulations tells you everything about what you’re betting on. If gold’s structural bid from central banks and inflation hedgers persists, the 3-year regime is more representative. If we mean-revert to historical patterns, the 10-year view applies.
My read: the truth lies somewhere between, but closer to the bullish case. De-dollarization isn’t a cyclical phenomenon. Central bank gold accumulation has persisted through multiple Fed policy cycles. The “floor” under gold prices appears structurally higher than any period in the past two decades.
Five Risks That Could Derail This Thesis
I’ve been burned by mining stocks before. Paid tuition on the lesson that commodity leverage cuts both ways. Here’s what keeps me sizing this position carefully:
1. Gold Price Mean Reversion The most obvious risk is also the most impactful. If gold retreats significantly from current levels, Newmont’s margins compress accordingly. The stock could retrace materially from current highs. Every gold rally eventually ends, and calling the top is impossible.
2. Cost Inflation Newmont guided to AISC around $1,630 per ounce for 2025. But rising labor costs, energy prices, and royalty payments could push that higher. Bank of America expects industry-wide AISC to rise 3% year-over-year in 2026. If costs rise faster than gold prices, margin expansion stalls.
3. Production Execution Risk 2026 guidance points to production at the lower end of the 4.0-4.2 million ounce range. Multiple mines are transitioning: Ahafo South declining as Ahafo North ramps, Cadia moving to next panel cave, Yanacocha concluding pit mining. Any execution hiccups create negative revisions.
4. CEO Transition Tom Palmer stepped down as CEO at year-end 2025, remaining as a strategic advisor through Q1 2026. Natascha Viljoen takes over as CEO. Leadership transitions always carry execution risk, especially when the prior CEO oversaw a major strategic transformation. The new team needs to prove they can maintain operational discipline.
5. Geopolitical Exposure Newmont operates in Ghana, Peru, Argentina, Papua New Guinea, and other jurisdictions where regulatory, tax, or social license issues can emerge suddenly. The company has navigated these well historically, but each asset carries tail risk.
The Actionable Framework
Based on my analysis, here’s how I’m approaching NEM:
Current Position: Small starter position (0.5% of portfolio)
Accumulation Zones:
- Primary buy zone: $100-105 (10% pullback from current levels)
- Strong buy zone: $90-95 (aligns with Stock Rover fair value area)
- Aggressive add: $85 (GNG “Strong Buy” threshold)
Position Sizing:
- Maximum allocation: 2% of portfolio at full position
- Scaling: Add 0.5% at each buy zone if triggered
- Volatility adjustment: Beta 0.57 allows slightly larger position than a typical 1% cap
Invalidation Triggers:
- Gold breaks below $4,000 sustainably (structural thesis damaged)
- AISC rises above $1,800 (margin compression concern)
- Production guidance cut more than 10% (execution failure)
- Any indication of balance sheet stress (current ratio below 1.5)
Trim Discipline:
- Begin trimming at $130 (GNG trim threshold $180 seems aggressive)
- Sell half if gold shows technical breakdown from $4,200 support
- Reevaluate entire thesis if CEO transition shows any operational disruption
The Bottom Line
Newmont isn’t just riding a gold rally. It’s a fundamentally transformed business with elite financial metrics, a strengthened asset base, and structural tailwinds from central bank gold accumulation.
The perfect Piotroski F-Score tells you the balance sheet is healthy. The 19.2% ROIC tells you management allocates capital well. The 36.1x interest coverage tells you there’s no financial stress. The 4.5 Altman Z-Score tells you bankruptcy risk is essentially zero.
Does the stock have 50% upside from here? Probably not unless gold moons to $6,000. But does it offer asymmetric risk/reward as a portfolio diversifier with genuine cash flow support? Absolutely.
I’m positioned small today and ready to add on any weakness. In a world of de-dollarization, fiscal expansion, and persistent inflation, owning the world’s best gold miner with a perfect financial health score isn’t speculation. It’s prudent portfolio construction.
The question isn’t whether to own Newmont. It’s how much.
Master Metrics Table
| Metric | Value | Percentile/Note |
|---|---|---|
| Price (Jan 16, 2026) | $114.21 | Near 52-week high |
| Market Cap | $125B | World’s largest gold miner |
| Forward P/E | 14.1 | Reasonable for growth profile |
| EV/EBITDA | 8.5 | Attractive vs. sector |
| Piotroski F-Score | 9 | Perfect score (98.6th percentile) |
| ROIC | 19.2% | 2.7x WACC |
| Operating Margin | 43.5% | Exceptional for miner |
| Net Margin | 33.4% | Demonstrates operating leverage |
| Debt/Equity | 0.2 | Conservative leverage |
| Interest Coverage | 36.1x | No debt stress |
| Altman Z-Score | 4.5 | Safe zone |
| Beta (3Y) | 0.57 | Lower volatility than market |
| Current Ratio | 2.0 | Strong liquidity |
| FCF as % of Sales | 28.5% | Excellent cash conversion |
| TTM Dividend Yield | 0.9% | Modest but growing |
| GNG Fair Value | $120.65 | 5.6% upside |
| SR Fair Value | $111.78 | Near current price |
| Safety Score (GNG) | 99.05 | Elite tier |
| Quality Score (GNG) | 77.40 | Strong |
| Analyst Consensus | Buy (17 Buy, 1 Sell) | Strong support |
| Price Target (Avg) | $112.95 | Modest upside embedded |
Disclosure: Author holds a small position in NEM and may add on weakness as described above. This analysis reflects my systematic process and is not personalized financial advice.
Data sources: Vulcan Stock Research database, GNG Research terminal, Stock Rover, Yahoo Finance, company filings.


Leave a comment