
Rating: Strong Buy
Price (Dec 27, 2025): ~$663
Blended Fair Value: ~$870
Margin of Safety: ~24%
Action: Own it here, add on pullbacks into $620-650, get aggressive if panic takes it to the low-$500s. Trim above $900.
The Counter-Intuitive Setup
Wall Street spent 2025 worrying about whether Mark Zuckerberg was burning cash too fast on AI dreams. META underperformed most of the Magnificent Seven, sitting roughly 17% below its August high while headlines screamed about $70 billion in capital expenditures. The stock looked wounded.
And that’s exactly why I’m interested.
Here’s what the worriers missed: while everyone debated whether the AI spend would pay off, META’s core ad business was quietly accelerating. Q3 2025 revenue hit $51.2 billion, up 26% year over year. Operating margins held at 40%. Net income for 2024 jumped nearly 60% versus 2023.
This isn’t a company praying AI saves them. This is a cash machine that chose to fund the future from a position of overwhelming strength.
The Business You’re Actually Buying

Strip away the metaverse jokes and AI hysteria for a moment. What are you actually putting money into?
Four billion people use Meta’s family of apps every month. Facebook, Instagram, WhatsApp, Messenger. Half the planet touches something Zuckerberg built at least once a month. That attention gets converted into advertising revenue at margins most companies would commit crimes for.
The numbers tell the story. 2024 revenue: $164.5 billion, up 22%. Net margin: nearly 38%. That’s not a tech company throwing spaghetti at the wall hoping something sticks. That’s a money printing operation disguised as a social network.
But here’s where it gets interesting. 📊 META isn’t just sitting on that cash pile, counting coins like a dragon on a hoard. They’re deploying it into the largest AI infrastructure buildout in the company’s history.
The Hyperion supercomputer. Data centers spanning continents. Custom silicon. A $27 billion private credit deal that made headlines as the largest of its kind on Wall Street.
Why? Because Zuckerberg believes whoever owns the AI infrastructure owns the next decade of computing. And META already has the distribution to put whatever they build in front of half the human population.
What the Market Is Charging You
Let’s talk about the bill they’re handing you.
At roughly $663 per share, you’re paying about 22x forward earnings for a company growing revenue in the mid-20s with operating margins at 40%. The trailing P/E sits around 29, which sounds expensive until you realize earnings grew 60% last year.
My blended fair value lands around $870. That number comes from triangulating three sources: a conservative DCF in the low $800s that assumes growth fades and margins compress modestly, an internal database snapshot closer to $945, and external analyst work clustering around $850.
Blending those gets you to $870, which puts today’s price at roughly a 24% discount to fair value.
Under my screening rules, anything below 0.8x fair value (around $700) qualifies as a Strong Buy zone. Current price of $663 sits comfortably inside that band. You’re not getting Ultra Value pricing here, which would require a drop to the low $500s, but you’re getting a quality premium business at a meaningful discount.
The Vulcan metrics confirm the setup. ROIC runs at 24.3%. Piotroski F-Score hits 7, solidly in healthy territory. Altman Z-Score clears 11, suggesting zero near-term bankruptcy risk. Interest coverage stands at an absurd 88x, meaning debt service is essentially a rounding error on this income statement.
This is fortress balance sheet territory, funding an aggressive capital cycle.
The Technical Picture
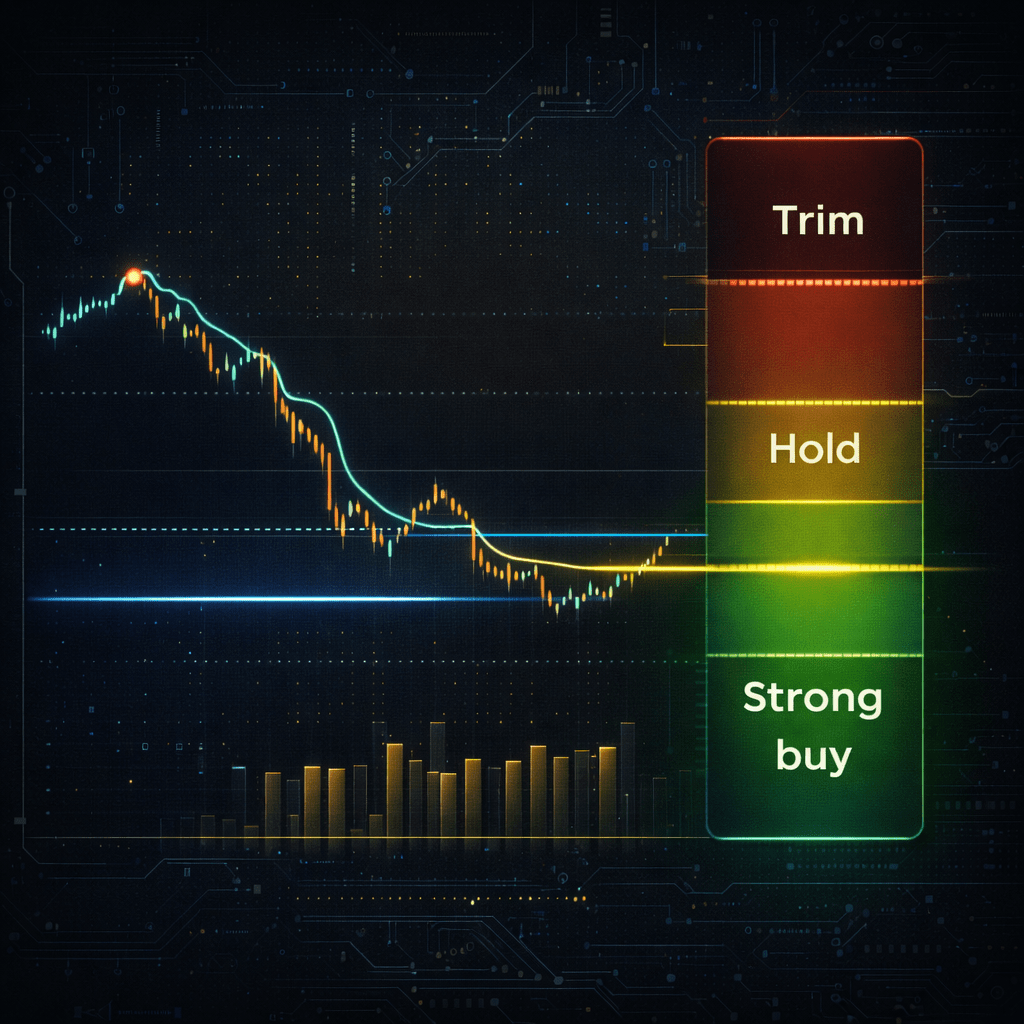
The charts show a stock that’s rallied off November lows but now tests a confluence of resistance.
Looking at the daily structure, META trades inside a down-sloping channel from its August peak around $796. The current rally has pushed price right into the upper half of that channel, where it collides with moving averages and a Fibonacci cluster in the $665-685 range.
The key levels to watch:
Near-term resistance: $670-680 (200-day moving average zone, Fib 0.382 cluster), $683-695 (prior swing rejection area), $711 (1.0 Fib level and prior swing high).
Near-term support: $655 (Fib 0.236 and local consolidation), $638-640 (November swing low), low $600s (channel midline and my primary buy zone).
My technical indicator panel flashes “Building Sell” with resistance flagged around $676. That doesn’t mean run for the exits, but it does argue against throwing all your capital at the stock directly into overhead supply.
The smarter play: scale your entries. Use today’s price to establish a starter position, reserve dry powder for pullbacks into $640-655, and keep a final slug ready if we get a true AI-spending panic or macro shock that drags us toward $600.
The Risk Map
I’m bullish, but not blind. Three risks sit at the front of my screen.
Risk One: AI Infrastructure That Doesn’t Pay Off
META has committed to $70-72 billion in 2025 capex, rising further in 2026. Most of that money flows into AI and data centers. If engagement doesn’t improve, ad pricing doesn’t lift, and new AI-powered products don’t move the needle over the next 2-3 years, the market will compress the multiple.
The line I’m watching: can they maintain operating margins in the mid-30s or better while growing revenue double digits? If margins slip into the low 30s and stick there for 4-6 quarters, I’d revisit the thesis.
Risk Two: Regulatory Friction
Italy just forced WhatsApp to remain open to rival AI chatbots. Europe continues pushing back on platform strategies that look too closed. The more META embeds its own AI assistant everywhere, the more friction they’ll face.
This won’t kill the company, but it adds compliance costs and limits some high-margin monetization paths. Watch for similar rulings spreading to other jurisdictions.
Risk Three: Competition for Attention
TikTok isn’t going away. Neither are concerns that META’s LLM capabilities trail the frontier. If users drift to competitors or advertisers decide rivals have better targeting, the cash machine loses some of its power.
The counter-argument: META’s scale and data moat are genuinely difficult to replicate. But complacency is always a risk at this size.
How I’d Actually Own This
Treat META as a core growth compounder with volatility, not a sleep-well-at-night bond proxy.
Position Sizing: For a diversified long-term portfolio, 3-5% at cost makes sense for investors comfortable with big-cap tech volatility.
Entry Plan:
- Put 1/3 to 1/2 of your intended position on now around $663
- Add another 1/3 on any pullback into $620-650
- Reserve the final 1/3 for a true panic (macro shock, AI spending scare) that takes us into the low $500s
Exit Plan:
- Trim zone starts above $900 if fundamentals haven’t improved
- If forward P/E expands into the high 20s without a growth step-up, start trimming regardless of absolute price
- Full invalidation if operating margins drop to sustained low 30s with no recovery path
The 12-Month Return Bands
Running Monte Carlo simulations with volatility in the mid-30s and drift anchored to a 10-12% total return assumption for a quality compounder, here’s what the math suggests:
Downside band (5th-25th percentile): -40% to -18%
Base band (25th-75th percentile): -18% to +35%
Upside band (75th-95th percentile): +35% to +90%
Translation: a 30-40% drawdown is absolutely on the menu if sentiment turns sharply against big-cap tech or AI spending narratives flip negative. But if execution stays solid and multiples don’t compress sharply, mid-teens to low-20s returns over 12 months are entirely realistic.
The tails are wide because this is a volatile, high-conviction name. Position sizing matters more than precise entry.
The Bottom Line
META today is not a distressed asset sale. It’s a dominant, cash-rich advertising empire that has chosen to fund an aggressive AI infrastructure buildout from a position of overwhelming financial strength.
At $663, you’re paying a low-20s forward multiple for:
- Revenue growing in the mid-20s
- Operating margins at 40%
- Net income up nearly 60% year over year
- A credible path to monetizing AI across feeds, commerce, messaging, and new devices
My blended fair value around $870 gives you a mid-20s margin of safety. The biggest risk isn’t that the core business collapses. It’s that AI spending takes longer to justify itself and the market gets impatient.
For capital with a 3-5 year horizon and willingness to live with volatility, I’m comfortable calling META a Strong Buy here. Clear buy zones, defined trim targets, and a risk framework that respects both the opportunity and the choppy road ahead.
Master Metrics Table
| Metric | Value | Interpretation |
|---|---|---|
| Current Price | ~$663 | Strong Buy zone |
| Blended Fair Value | ~$870 | DCF/multiples blend |
| Margin of Safety | ~24% | Above 20% threshold |
| Forward P/E | 22.3 | Reasonable for growth |
| Trailing P/E | 29.5 | Reflects earnings growth |
| ROIC | 24.3% | Elite capital efficiency |
| Operating Margin | 40% | Category-leading |
| Net Margin | ~38% | High-quality earnings |
| Revenue Growth (YoY) | 22-26% | Accelerating |
| Piotroski F-Score | 7 | Healthy fundamentals |
| Altman Z-Score | 11.2 | Zero bankruptcy risk |
| Interest Coverage | 88x | Fortress balance sheet |
| Debt/Equity | 0.3 | Conservative leverage |
| Volatility (1Y) | 37% | Expect swings |
| Beta (3Y) | 1.52 | Tech sector sensitivity |
| 52-Week Range | $480-$796 | Currently mid-range |
| Buy Zone | $620-700 | Scale in here |
| Trim Zone | $900+ | Revisit at premium |
| Position Size | 3-5% | For diversified portfolios |
Disclosure: I own META as a core holding. This analysis reflects my personal framework and is not personalized investment advice. Do your own due diligence.
Data as of December 27, 2025. Vulcan screening methodology v2025-09.


Leave a comment