
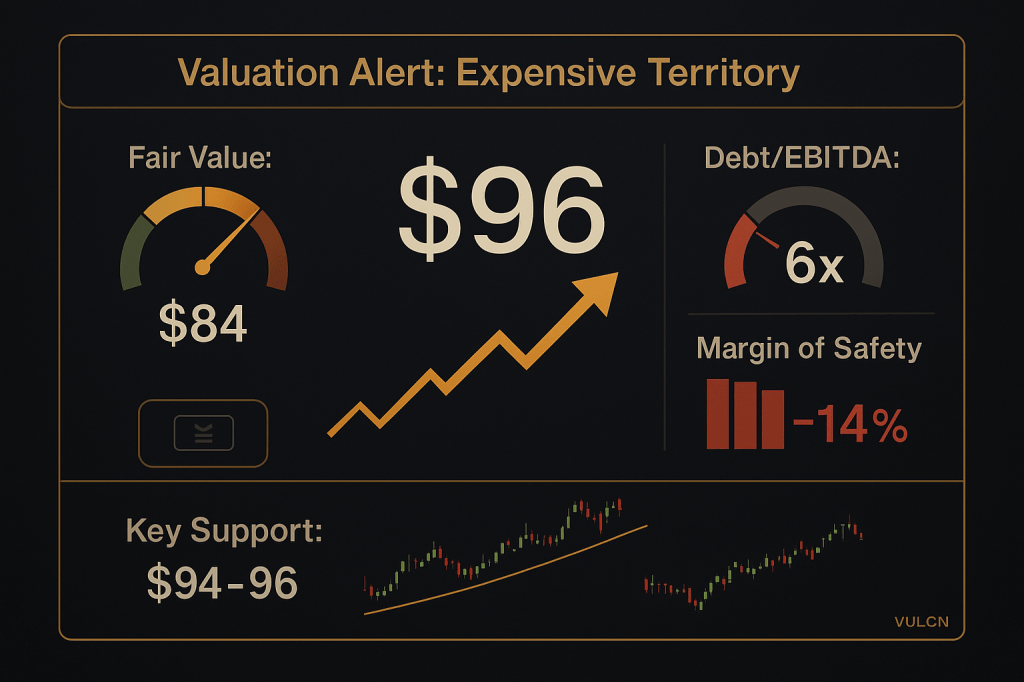
When an online furniture retailer doubles in twelve months and Wall Street starts whispering about “margin inflection,” most investors hear opportunity. I hear caution. Wayfair (NYSE: W) has delivered the easy money, repricing from survival question to growth story in record time. At roughly $96 per share as of December 3, 2025, the stock trades well above our blended fair value in the low-80s, sitting in a technical correction zone with no fundamental floor to catch it if sentiment turns.
Vulcan-mk5 Score: 4.6/10 (mid-pack, high risk)
- Value: 3.0/10
- Growth: 6.0/10
- Quality: 4.0/10
- Momentum: 7.5/10
- Safety: 2.5/10
This isn’t a short thesis. Wayfair has genuinely turned the corner on profitability, with adjusted EBITDA margins climbing from deeply negative territory to mid-single digits and free cash flow finally turning positive. But it remains what it’s always been: a thin-margin, highly leveraged online retailer with no economic moat and a history of violent drawdowns. At today’s price, you’re paying for perfection in a business where perfection is rare.
For systematic investors using our framework, W screens as a speculative momentum name where further upside depends entirely on continued execution and multiple tolerance. The risk/reward has flipped from “survival discount” to “valuation compression.” Position sizing, if any, belongs in a satellite trading sleeve with hard stops, not in core portfolios seeking compounders.
The Business: Asset-Light Marketplace With Platform Ambitions
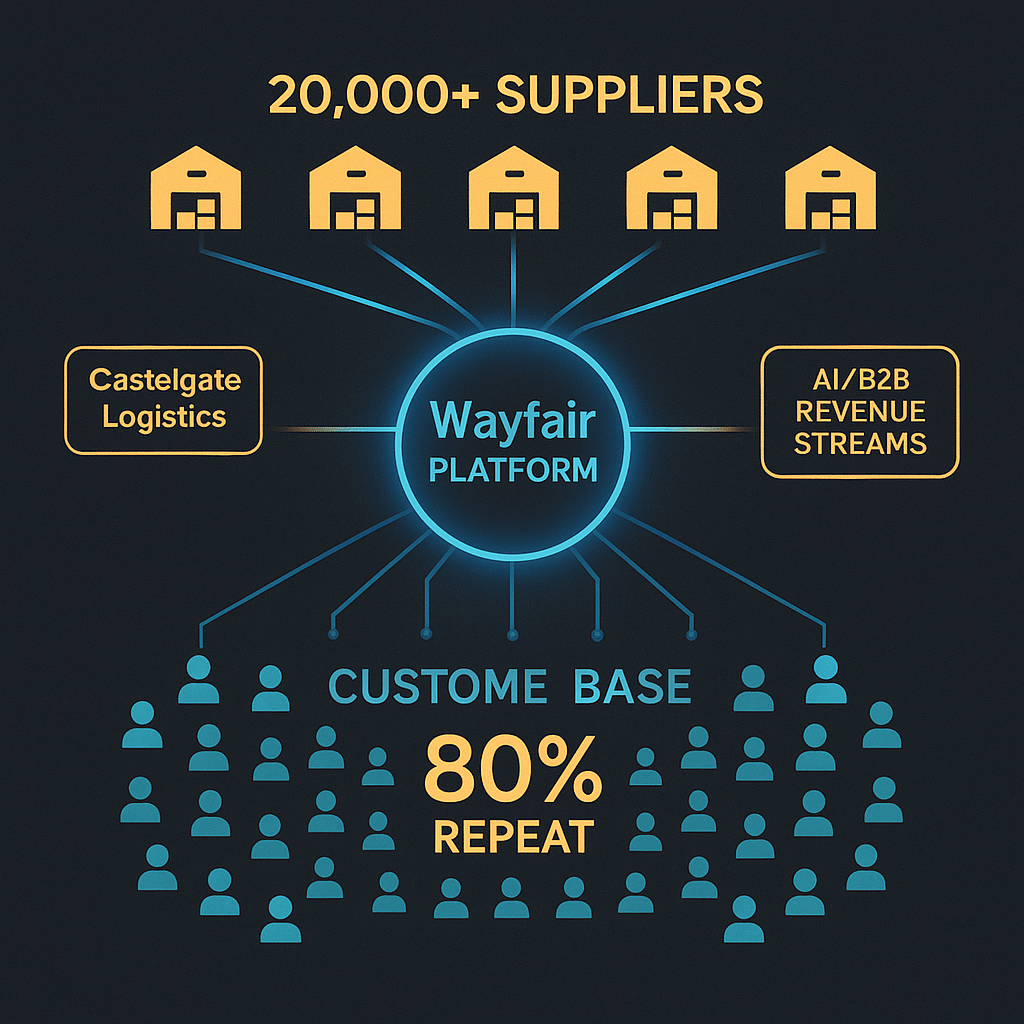
Wayfair operates as a pure-play online home goods retailer, primarily serving the U.S. market (about 88% of 2024 sales) with smaller operations in Canada, the UK, and Ireland. The company runs a marketplace model across several brands: Wayfair, Joss & Main, AllModern, Birch Lane, and Perigold, offering roughly 30-33 million SKUs from more than 20,000 suppliers.
The structural model carries some attractive features. Unlike traditional furniture retailers, Wayfair generally doesn’t take long-term inventory risk. Vendors hold inventory and set wholesale prices while Wayfair manages the assortment, take rate, and customer interface. The CastleGate logistics network, third-party forwarding, and growing B2B/advertising initiatives are revenue streams that tie suppliers more tightly to the platform and diversify away from pure consumer furniture demand.
Recent AI partnerships with OpenAI, Google, and Perplexity aim to build recommendation and conversational shopping experiences, positioning W for AI-driven product discovery. It’s an interesting strategic angle, but economically this remains a low-margin retail business with some platform-like features, not a high-margin software platform. Gross margins are expected to drift toward the low 30s, with operating margins stabilizing near 4% over the next decade. That keeps returns sensitive to both execution and macro cycles, and it’s why we can’t award W the quality scores that true compounder businesses command.
The Turnaround: Real Improvement, But How Much Was Easy?
After a brutal post-pandemic normalization, the fundamental inflection is undeniable. Revenue fell from about $14.1 billion in 2020 to $11.85 billion in 2024 as the COVID home-spending boom unwound. But 2025 revenue is forecast around $12.3 billion, roughly 3-5% growth, with similar average growth projected over the next five years. More importantly, Q3 2025 revenue grew 8.1% year over year to about $3.1 billion, the fastest quarterly growth since early 2021.
Profitability has inflected even more dramatically. Adjusted EBITDA moved from a $416 million loss in 2022 to positive $306 million in 2023 and $453 million in 2024, translating to a 3.8% margin. Consensus models see EBITDA margins in the mid-single digits in 2025-26 (around 5.7-6.3%) with a long-term goal of 10%+. Free cash flow to the firm turned positive in 2024 at roughly $300 million, with projections of $338 million in 2025 and $492 million in 2026, rising further as capex and working capital normalize.
Unit economics are also moving in the right direction. Customer acquisition costs have trended down for two consecutive quarters, while net revenue per active customer and average order value are rising. Repeat customers represent roughly 80% of orders, indicating a loyal installed base even as total active customers remain below the pandemic peak of 33 million.
This underpins the bull case: the worst of the post-pandemic hangover is over, and incremental revenue now drops through to EBITDA and FCF far more efficiently than in 2021-22. The problem? The market has already priced most of that improvement. Operating EPS estimates show a sharp turn from near-zero EPS in 2024 to about $2.61 in 2025 and $3.42 in 2026, but at $96 per share you’re paying roughly 28-37x those forward earnings for a business with modest single-digit revenue growth and razor-thin margins.
Balance Sheet: Leveraged, But Improving
Leverage and solvency represent the core risk levers in any high-beta retailer. As of 2024, Wayfair carried roughly $2.9 billion of net debt, down slightly from $3.1 billion the prior year, with about $1.3 billion of cash and approximately $1.9 billion in total liquidity including an undrawn revolver. Net debt to adjusted EBITDA sits high at about 6.3x on 2024 numbers, but is expected to fall as EBITDA ramps. Consensus forecasts net debt to EBITDA falling from about 6x in 2025 to 4.4x in 2026 and toward the low-2s by decade’s end.
Interest coverage (EBITDA to net interest) is currently modest but projected to move from around 5x in 2025 to more than 10x as margins improve. That’s credible deleveraging, assuming no macro hiccup derails the plan.
From a conservative valuation perspective, the asset floor is weak. There’s little in the way of tangible asset backing; the economic value is in customer relationships and the platform, which are hard to recover in a breakup scenario. The earnings-power value floor is equally low. If we normalize free cash flow at $400-500 million on midcycle margins and capitalize at a high single to low double-digit discount rate, the implied equity value after debt sits far below today’s $13-14 billion market cap.
That’s the fundamental problem. W’s price trades far above any plausible earnings-power floor and is heavily dependent on continued growth and margin expansion. If sentiment turns or execution stumbles, there’s no tangible value floor to arrest the decline.
Valuation: Modestly Overvalued With Wide Uncertainty
Multiple valuation anchors converge in the low-80s per share. Stock Rover’s fair value sits around $73-74, implying a negative margin of safety of roughly 24% at the current price near $96. Morningstar’s fair value estimate is $80 with a “None” moat rating and “Very High” uncertainty; at $96 the stock trades roughly 20% above this anchor. EV/EBITDA looks extreme on trailing numbers (about 150x), but falls into the high-teens on forward estimates as EBITDA ramps. Price-to-sales is roughly 1x, in line or slightly below many e-commerce peers but on much thinner margins.
Blending a conservative DCF (which, using consensus FCF profiles but slightly more generous long-run margins, lands near $90) with Morningstar’s $80 fair value using appropriate uncertainty weighting yields a blended fair value around $84 per share. On that basis, W is modestly overvalued today.
Using our systematic buy-zone algorithm with blended fair value around $84 and Very High uncertainty, we get approximate zones:
- Strong Buy: Below $38
- Primary Buy: $61-81
- Fair/Hold: $81-87
- Trim: $89-96
- Too Expensive: Above $96
At a spot price around $96, W sits right at the lower edge of “Too Expensive,” just outside the trim band. That doesn’t make it an automatic sell for existing holders who bought much lower, but it makes it a clear “no new money” decision point for fresh capital.
Technical Picture: Correction In Progress, Key Support At Risk
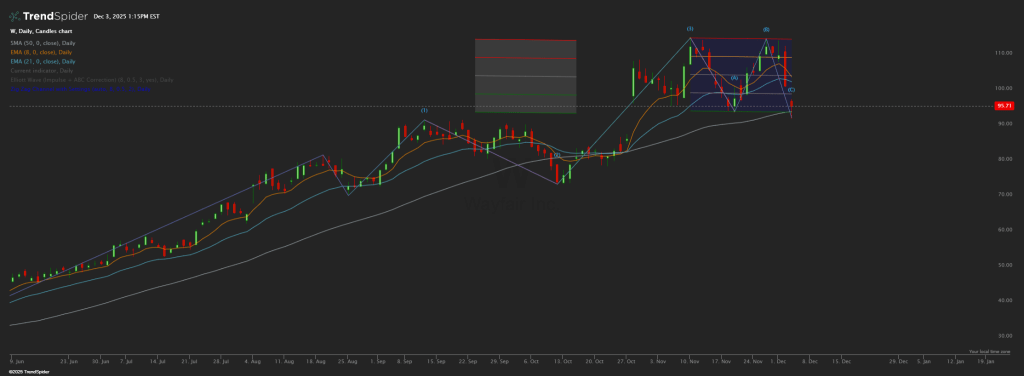
The daily chart shows W still in a strong primary uptrend since June, but the near-term structure is corrective rather than “fresh breakout.” Price has stair-stepped higher in a rising channel, riding above the 50-day SMA (currently in the low-80s) and mostly respecting the 8/21-day EMAs. The 50-day SMA is still rising and well below price, confirming an intact intermediate uptrend, but also highlighting how far price has stretched above mean reversion support.
Elliott Wave structure on the chart shows a clean impulse higher into the recent $114-115 high, followed by a textbook A-B-C corrective pattern. Wave (A) dropped from ~$114 into the mid-90s, wave (B) bounced back toward the upper-100s, and wave (C) is testing back down toward the bottom of the consolidation box. That ABC sits above the prior wave (2) low in late October and above the rising 50-day, which is structurally what you want to see in a wave-4 consolidation within a bigger uptrend.
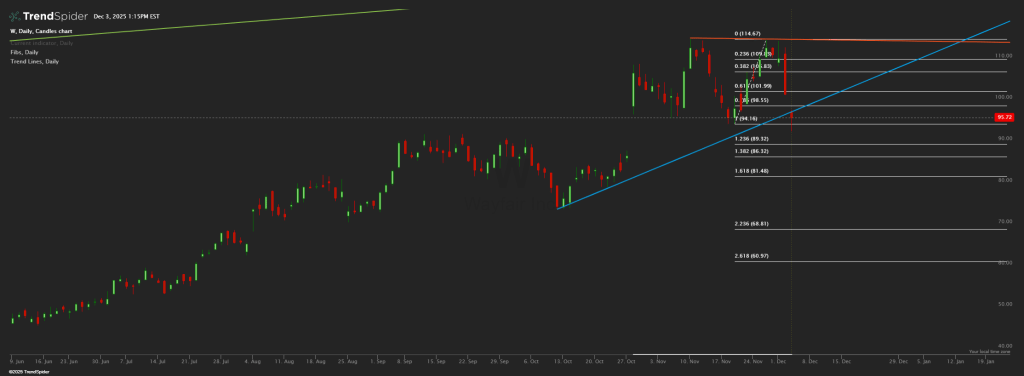
Fibonacci levels off the recent swing provide a clean roadmap:
- Swing high: $114.67
- Swing low: $94.16
- Key retrace levels: 23.6% at ~$109.5, 38.2% at ~$106.8, 61.8% at ~$102.0, 78.6% at ~$98.6
- Fib extensions below: 1.236 at ~$89.3, 1.382 at ~$86.3, 1.618 at ~$81.5, 2.236 at ~$68.8
A rising daily trendline from the October low runs right through the current price zone around $94-96. That creates a critical confluence “decision area”: price is sitting between the 78.6% retrace (~$98.5) and the 100% leg low (~$94.2), right on the rising trendline. If buyers defend this band (roughly $94-99), the ABC correction can complete and price can attempt another run at $105-110. If price breaks decisively below both the trendline and the $94-95 area, the chart opens up to the extensions around $89, $86, and potentially $81-82.
Notably, that 1.618 extension near $81.5 lines up almost perfectly with the bottom of our Primary Buy band from the fundamental work. That’s meaningful confluence: a deeper correction into the low-80s would be both a technical and fundamental “better spot” versus today.
Actionable Trading Zones (Technical + Fundamental Synthesis)
For systematic traders, the chart and DCF work finally align at specific price levels:
Short-term resistance / trim zones:
- $101-103: 61.8% retrace area and mid-box resistance. Good place for short-term traders to take partial profits if they bought the mid-90s.
- $106-110: 38.2-23.6% retrace band plus visible prior congestion. This aligns with our fundamental “Trim” band; for existing holders who rode the move from much lower, this is a logical place to lighten up.
- $114-115: Prior swing high. If price revisits this quickly without a reset, we’re deep into overextension territory relative to both technicals and fundamentals.
Near-term support / decision zones:
- $94-96: Current price, prior swing low, and rising trendline. As long as daily closes hold above this band, the bullish wave-4-style consolidation remains intact.
- $89-90: First fib extension cluster. A break to here signals a deeper correction, but still within a reasonable pullback given the prior run. This is a candidate “tactical nibble” zone for aggressive traders with tight risk controls.
- $81-82: 1.618 extension and alignment with the bottom of our Primary Buy band. This is where the chart and the DCF finally rhyme; if price bleeds into this area while fundamentals remain on track, risk/reward improves substantially.
Structural failure / “step aside” zone:
- A sustained break below the low-80s (through the 1.618 extension and toward $69-61) would mark a major failure of the current uptrend. At that point the move starts to look more like a full trend reversal than a correction, and the name would need re-underwriting from scratch.
Scenario Analysis: Bull, Base, and Bear Cases
Using a standard three-scenario framework with reasonable probability weights:
Bear case (25% weight): Macro or housing softens, consumer demand wobbles, and the market decides mid-single-digit EBITDA margins on 3-4% revenue growth deserve a lower multiple. On this path, W could re-rate back toward the high-50s to low-70s, for roughly -30% to -40% total return from current levels.
Base case (50% weight): Execution stays on track, EBITDA and FCF progress roughly as expected, and the multiple drifts toward our blended fair value range as growth normalizes. Price ends up somewhere in the mid-70s to low-90s, implying roughly -10% to +10% total return from today’s level.
Bull case (25% weight): Wayfair executes well, margins move faster toward high single digits, B2B/advertising and AI-driven initiatives surprise to the upside, and the Street maintains a premium multiple. Price moves toward the $115-120 Street target cluster, implying around +20% to +35% total return.
Mapping that into standard 12-month bands:
- Downside band (5th-25th percentile): -35% to -20%
- Base band (25th-75th percentile): -10% to +10%
- Upside band (75th-95th percentile): +20% to +35%
Given the high volatility (beta around 2.5), the distribution here is wide. Probability of a 30% drawdown is non-trivial, but so is the probability of a further 20-30% pop if the growth narrative stays intact. For risk-averse investors, that’s not an attractive setup at current prices.
Portfolio Fit and Risk Management
Inside our systematic framework, Wayfair doesn’t fit any of the core mandates:
Not an Income candidate: No dividend, and volatility and leverage are far beyond Income engine safety filters.
Not a Core Quality holding: No moat, thin margins, high uncertainty, and still-elevated leverage keep the Quality pillar subscale.
Potentially eligible as a small tactical position in a growth or momentum sleeve, but only:
- At or below the upper end of the Primary Buy band (roughly sub-$80s)
- With strict position size caps (1-2% max)
- And hard risk controls (stops or trim rules on breaks below support or loss of fundamental momentum)
For diversified long-only investors, W at today’s price is more “trade around a thesis” than “buy and forget.” It’s attractive for traders comfortable with double-digit drawdowns and wanting exposure to an improving e-commerce story. It’s misaligned with capital-preservation mandates or low-volatility, retirement-oriented portfolios.
Risk Triggers and Invalidation Criteria
Set hard alerts at these levels and fundamentals:
Price-based invalidations:
- Daily close below $94: Trendline broken, correction likely deepening toward $89-82
- Two consecutive daily closes below $89: Wave structure compromised, reassess entire thesis
- Any spike above $120 on no fundamental news: Likely blow-off top, trim aggressively
Fundamental invalidations:
- Q4 2025 or Q1 2026 EBITDA margin contracts below 5%: Signals execution stumble
- Net debt/EBITDA moves above 7x in any quarter: Deleveraging story stalls
- Active customer count falls below 28 million: Customer acquisition engine broken
- Any announcement of significant equity dilution: Destroys per-share value thesis
Macro/external triggers:
- 30-year mortgage rates spike above 8%: Housing turnover freezes
- Consumer confidence index drops below 95: Discretionary spending at risk
- Fed signals prolonged higher rates: Multiple compression across all e-commerce
The Call: Respect The Rally, Wait For The Reset
Wayfair has become a much better business than it was in 2022. The profitability inflection is real, the balance sheet is healing, and the management team has executed well through a difficult normalization. But at $96 per share, the equity market has already priced most of that improvement and then some.
For new capital, this is a clear “wait for a better pitch” setup. The technical chart is in mid-correction, sitting right on key support with no clear catalyst for a break higher. The fundamental valuation offers no margin of safety, with our blended fair value in the low-80s and no tangible asset floor to arrest a decline if sentiment turns. The scenario analysis shows symmetric risk, but with a slight tilt toward downside given how far we’ve already come.
Existing holders who bought in the $40s-60s during the panic have legitimate gains to protect. Consider staged trims at $101-103 and again at $106-110, with a hard stop below $94 to lock in most of the win. Let the position breathe if it holds support, but don’t let a double turn into a loss.
For those watching from the sidelines: add W to your watchlist, set alerts at $82 and $76, and wait. If the business continues executing and the stock corrects into our Primary Buy band in the low-80s, you get both technical and fundamental alignment for a tactical trade. Until then, there are better risk/reward setups elsewhere.
Master Metrics Table (Wayfair, as of December 3, 2025)
| Metric | Value | Notes |
|---|---|---|
| Price (intraday) | ~$96.10 | Stock Rover and FinancialContent quotes |
| Market cap | ~$13.3-13.6B | Based on current shares outstanding |
| 52-week range | $20.41 – $114.92 | Very high volatility, >5x off lows at peak |
| 1-year total return | ~+100% | Roughly a double year-over-year |
| YTD total return | ~+110% | Large re-rating in 2025 |
| Sector / Industry | Consumer Cyclical / Internet Retail | Stock Rover classification |
| Revenue 2024 | $11.85B | Morningstar model |
| Revenue 2025E | $12.3B | ~3-5% growth vs 2024 |
| Adj. EBITDA 2024 | $453M (3.8% margin) | Profitability inflection |
| Adj. EBITDA 2025E | ~$750-800M (6% margin) | Morningstar and CFRA consensus |
| FCF 2024 | ~$302M | Morningstar FCFF |
| Net debt | ~$2.9B | As of 2024 |
| Net debt / EBITDA | ~6x (2024-25) | Forecast to fall over time |
| Stock Rover Value score | 52/100 | Slightly better than industry but not cheap |
| Stock Rover Quality score | 27/100 | Reflects thin margins and leverage |
| Stock Rover Growth score | 45/100 | Mixed history, improving forward profile |
| Stock Rover Sentiment score | 97/100 | Very strong factor and momentum setup |
| Morningstar fair value | $80 | No moat, Very High uncertainty |
| Stock Rover fair value | $73.40 | Margin of safety ~-24% |
| CFRA 12-month target | $121 | Hold rating |
| Vulcan blended fair value | ~$84 | Internal DCF blended with Morningstar |
| Beta 3Y | ~2.5 | Very high volatility vs market |
| Piotroski F-Score | N/A | Not provided in base data |
| Altman Z-Score | N/A | Not provided in base data |
Trailing Performance Snapshot
| Period | Approx Total Return | Notes |
|---|---|---|
| 1 month | ~-7% | Post-earnings consolidation |
| 3 months | ~+20-25% | Strong but moderating trend |
| 6 months | ~+120% | Big move off mid-year lows |
| YTD | ~+110% | Large re-rating in 2025 |
| 12 months | ~+100% | Roughly a double year-over-year |
Forward 12-Month Return Bands (Vulcan-mk5, Illustrative)
| Band | Percentile Range | Price Range (Approx) | Total Return vs ~$96 | Commentary |
|---|---|---|---|---|
| Downside | 5th-25th | $55-75 | -35% to -20% | Macro or execution stumble; multiple compresses |
| Base | 25th-75th | $75-100 | -10% to +10% | Fundamentals track expectations; valuation drifts to fair value |
| Upside | 75th-95th | $115-130 | +20% to +35% | Strong margin beats; market awards premium multiple |
References and Data Sources
- FinancialContent – Wayfair Inc. Class A Common Stock (NY:W) live quotes
- TipRanks – W Stock | Wayfair Price, Quote, News & Analysis
- Wayfair Investor Relations – Q3 2025 earnings release
- Barchart.com – W Performance Report for Wayfair Stock
- MarketBeat – Wayfair
 Stock Chart and Price History 2025
 - Stock Rover – Comprehensive equity research report (Dec 3, 2025)
- Morningstar – Equity research report (Nov 21, 2025)
- CFRA Research – Equity analysis and target price
- TrendSpider – Daily chart technical analysis with Elliott Wave and Fibonacci overlays


Leave a comment