
How America’s investing toll road just posted record profits while most people argued about meme stocks
The Setup You Didn’t See Coming
Two years ago, Twitter predicted Schwab’s death. The regional banking panic of March 2023 sent its stock tumbling 30% in a week as armchair analysts warned of deposit flight, balance sheet implosion, and the end of the zero-commission dream. Schwab looked like the next domino.
Fast forward to October 2025: Schwab just posted record revenue of $6.1 billion, earnings up 67%, and client assets hitting an all-time high of $11.6 trillion. The stock has more than doubled from its panic lows. The lesson? Markets reward those who can distinguish temporary problems from permanent damage.
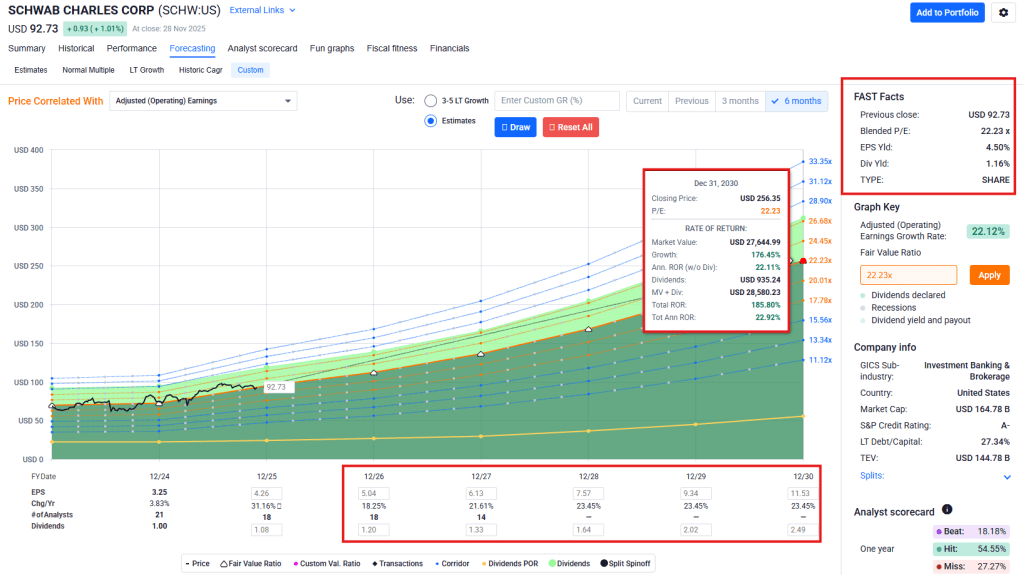
Today, Schwab trades around $91, roughly 17% below Morningstar’s $109 fair value estimate. The company carries a wide moat rating with medium uncertainty. The question isn’t whether Schwab is a quality business. It’s whether the remaining discount offers enough upside for patient capital.
The Toll Road You’re Already Using

Think of Schwab as America’s financial highway system. If you have a brokerage account, an ETF, an IRA, or a workplace 401(k), there’s a decent chance your money travels on Schwab’s infrastructure. The company touches 38 million active brokerage accounts and custodies assets for thousands of independent financial advisors.
Schwab makes money three ways. First, they earn interest on idle cash and lending against client portfolios. This “net interest income” drives about half of revenue and expanded 37% year-over-year in Q3. Second, they collect fees on ETFs, mutual funds, and managed portfolios. Advisory solutions grew 40% as more clients pay for professional guidance. Third, they generate trading revenue when people buy and sell securities, though this represents the smallest slice after zero commissions became standard.
The brilliance of the model? Each dollar of new client assets compounds through multiple revenue streams. More assets mean more cash to sweep, more AUM for fee products, and more trading activity. Schwab added $137.5 billion in net new assets last quarter alone, a 44% increase from the prior year. They’re gaining market share even as competitors fight for scraps.
The result? A 17.7% revenue CAGR over five years. That’s not “boring financial” growth. That’s faster than most software companies.
Why The Skeptics Got It Wrong
The 2023 bear case centered on interest rate sensitivity. Schwab’s bank holds a large portfolio of long-dated securities purchased when rates were near zero. When rates spiked, those holdings showed paper losses. Combined with deposit outflows to higher-yielding alternatives, the math looked ugly.
What critics missed was Schwab’s funding advantage. Unlike regional banks dependent on flighty depositors, Schwab’s cash comes primarily from brokerage clients who keep money parked between trades. This “transactional sweep” cash proved stickier than expected. It bottomed at 9.5% of assets in November 2024 and has since recovered to around 10.5%.
Management executed a disciplined paydown of expensive emergency borrowing. The “Bank Supplemental Funding” that spooked investors in 2023 dropped from over $25 billion to under $15 billion by Q3 2025. Net interest margin expanded to 2.86%, up 78 basis points from a year ago. The crisis narrative evaporated as execution delivered.
Here’s a stat that should have ended the debate: Schwab’s earnings predictability ranks in the 97th percentile of all stocks. This isn’t volatile speculation. It’s one of the most consistent earnings machines in the market.
The Numbers That Matter
Schwab’s Q3 2025 results tell the story of a franchise firing on all cylinders.
Revenue reached $6.1 billion, up 27% year-over-year. Adjusted earnings per share hit $1.31, beating estimates by 6 cents and jumping 70% versus the prior year. Pre-tax margin expanded to 51.3%, an improvement of over 10 percentage points. Return on tangible equity climbed from 31% to 38%.
These aren’t “beat by a penny on lowered expectations” results. Schwab is demonstrating genuine operating leverage as scale economics kick in. Revenue grew 27% while expenses rose just 5%. That’s the hallmark of a well-managed platform business reaching inflection.
The balance sheet transformation continued with $2.7 billion in share repurchases during the quarter alone. Year-to-date capital return across all forms reached $8.5 billion. When a company buys back this much stock at these prices, management is signaling conviction in the valuation gap.
What Could Go Wrong
Honest risk assessment requires naming specific scenarios, not vague disclaimers.
First, rapid rate cuts could compress margins faster than expected. If the Fed panics and slashes rates aggressively, the spread Schwab earns on its balance sheet would narrow before its securities book reprices higher. A 150-basis-point emergency cut cycle could knock 15-20% off earnings power temporarily.
Second, another trust shock remains possible. The 2023 episode proved that even a fundamentally sound institution can trade like it’s failing if social media decides to target it. A major cyber incident, trading platform outage, or renewed banking fears could trigger deposit volatility regardless of underlying strength.
Third, competitive pressure grinds relentlessly. Schwab battles Fidelity, Vanguard, Interactive Brokers, and the big banks for every dollar of client assets. If competitors force higher cash yields or lower fees, margins will erode. The zero-commission war already claimed profits; the next front may be cash sweep rates.
Fourth, the securities book takes years to fully reprice. Even in a normalized rate environment, Schwab’s below-market securities will roll off gradually through 2027-2028. Patience is required.
Fifth, regulatory risk lurks. Changes targeting the cash sweep model, payment for order flow, or broker-bank capital requirements could structurally impair economics. Washington remains unpredictable.
The Forward-Looking Math
Vulcan’s scenario analysis suggests asymmetric upside from current levels.
In the downside case (25% probability), rapid Fed easing compresses NIM faster than expected while equity markets stall. EPS undershoots consensus, the multiple compresses to 13-14x forward earnings, and the stock trades to the $70-80 range. Total 12-month return: roughly negative 20% to negative 5%.
In the base case (50% probability), measured rate cuts proceed alongside continued asset growth. Fee revenues expand, the multiple holds at 16-17x, and price reaches $95-105. Total 12-month return: approximately 5% to 15%.
In the upside case (25% probability), supportive markets drive elevated trading volumes while advisory adoption accelerates. EPS surprises 5-10% above consensus, the multiple expands toward 18x, and price reaches $110-120. Total 12-month return: roughly 15% to 30%.
The distribution skews modestly positive. More paths lead to mid-teens returns than to significant losses, though meaningful downside exists if rate policy or market sentiment turns sharply negative.
How To Own It
Schwab belongs in portfolios as a core financial compounder, not a trading vehicle.
Position sizing should reflect the volatility profile. A 2-4% allocation works for diversified equity portfolios. Investors already heavy in financials should scale toward the lower end.
Risk context matters. Despite the 2023 panic, Schwab’s beta sits at 0.90 with volatility in the 21st percentile. It’s actually less jumpy than most stocks. The 24.8% payout ratio also means the 1.2% yield has room to grow if management shifts from buybacks to dividends.
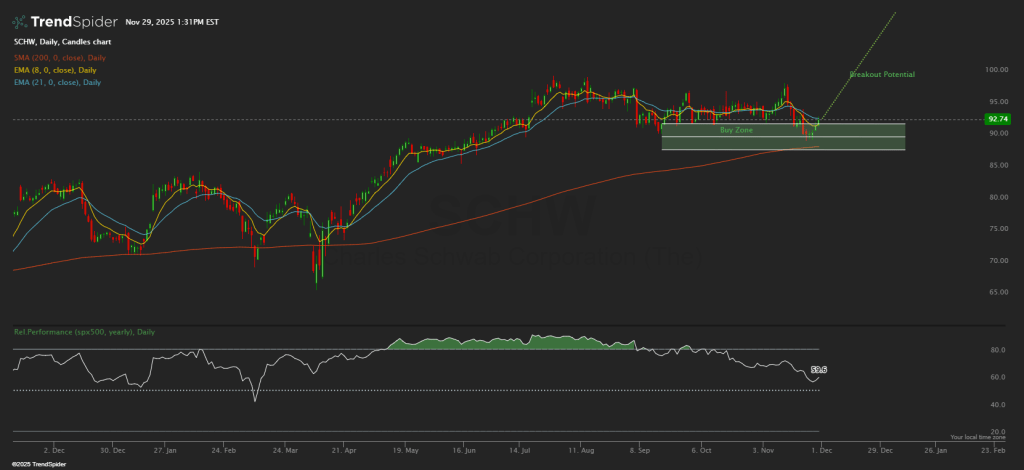
The accumulation zone sits between $88-92, aligning with the November swing low and technical support. Current prices around $91 represent a reasonable entry point for investors willing to add on any weakness.
Trim consideration begins at $98-105. If the stock reaches the high-90s quickly without fundamental acceleration, reducing by 20-30% and redeploying elsewhere makes sense. The thesis doesn’t require holding through frothy valuations.
Invalidation would require a clean weekly close below $88 accompanied by negative fundamental news, not just routine volatility. Absent deteriorating earnings power or renewed balance sheet stress, the wide moat deserves patience.
Time horizon matters. Expect 2-3 years minimum for the thesis to fully play out. Short-term traders will find cheaper volatility elsewhere. Long-term compounders will appreciate Schwab’s combination of quality economics and discounted entry.
The Bottom Line
Schwab isn’t a get-rich-quick story. It’s a high-quality financial platform trading below fair value after market memories of a crisis that didn’t happen. The business generates 50%+ margins, 20%+ ROE, and attracts record asset flows. Morningstar grants it a wide moat for good reason.
At $91 with a $109 fair value target, the setup offers mid-teens expected returns with manageable downside. That’s not spectacular. It’s exactly what patient capital should accept from a core holding in a market where most quality trades at a premium.
The boring highway keeps collecting tolls while everyone argues about the next meme. Sometimes boring wins.
Master Metrics Table
| Metric | Value | Source/Note |
|---|---|---|
| Price & Valuation | ||
| Current Price | ~$91 | Late November 2025 |
| 52-Week Range | $65.88 – $99.59 | |
| Market Cap | ~$161 billion | |
| Morningstar Fair Value | $109 | Wide moat, Medium uncertainty |
| Vulcan BFV Band | $100-110 | Greenwald blend |
| Forward P/E | 16.1x | Vulcan DB |
| TTM P/E | ~21x | |
| PEG Fwd | 1.3 | |
| Earnings Power Value | $41.99 | Vulcan DB |
| Mean Analyst Target | $112.30 | 17 analysts, Buy consensus |
| Growth Metrics | ||
| Revenue 5Y CAGR | 17.7% | Vulcan DB |
| 5Y EPS Growth Est | 13.9% | Vulcan DB |
| Dividend 5Y CAGR | 8.4% | Vulcan DB |
| EPS 1Y Change | +66.8% | Q3 2025 surge |
| Profitability | ||
| ROIC | 15.6% | Vulcan DB |
| ROE | ~20% | |
| ROTE | 38% | Up from 31% YoY |
| Net Margin | 35.9% | Vulcan DB |
| Operating Margin | 46.2% | Vulcan DB |
| Pre-Tax Margin | 51.3% | Q3 2025, +1,000 bps YoY |
| Risk Metrics | ||
| Beta 3Y | 0.90 | Slightly below market |
| Volatility 1Y | 25% | 21st percentile (low) |
| Max Drawdown 1Y | -17.2% | |
| Max Drawdown 3Y | -44.5% | 2023 banking panic |
| Piotroski F-Score | 5/9 | Neutral |
| Debt / Equity | 0.6 | |
| EPS Predictability | 97th pctl | Highly predictable |
| Dividend | ||
| TTM Yield | 1.2% | |
| Payout Ratio | 24.8% | Room for growth |
| Operating Metrics | ||
| Q3 2025 Revenue | $6.1 billion | +27% YoY, record |
| Q3 2025 Adj. EPS | $1.31 | +70% YoY |
| Total Client Assets | $11.59 trillion | +17% YoY, record |
| Core Net New Assets (Q3) | $137.5 billion | +44% YoY |
| Net Interest Margin | 2.86% | +78 bps YoY |
| Active Brokerage Accounts | 38 million | +1M new/quarter |
Vulcan Audit Footer
Model: Vulcan-mk5 Full Deep with Greenwald Mode ON Data Sources: Schwab Q3 2025 Earnings Release, Morningstar Equity Research (November 2025), Yahoo Finance, Reuters, company filings Scenario Priors: Normal regime (Bull 0.30, Base 0.55, Bear 0.15) adjusted for stabilizing macro Price Anchor: $91.12 verified November 26, 2025
Disclosure: This analysis is for educational purposes only and does not constitute investment advice. Always conduct your own research and consult qualified professionals before making investment decisions.


Leave a comment