
The smart money whispered that Microsoft was too big to compound. At $3.5 trillion, the math didn’t work – you can’t grow 18% annually when you’re already larger than most countries’ GDP. Wall Street heard the whispers and marked MSFT down 15% from its 52-week high, shaving roughly $600 billion in market value across the past month.
The whispers were wrong.
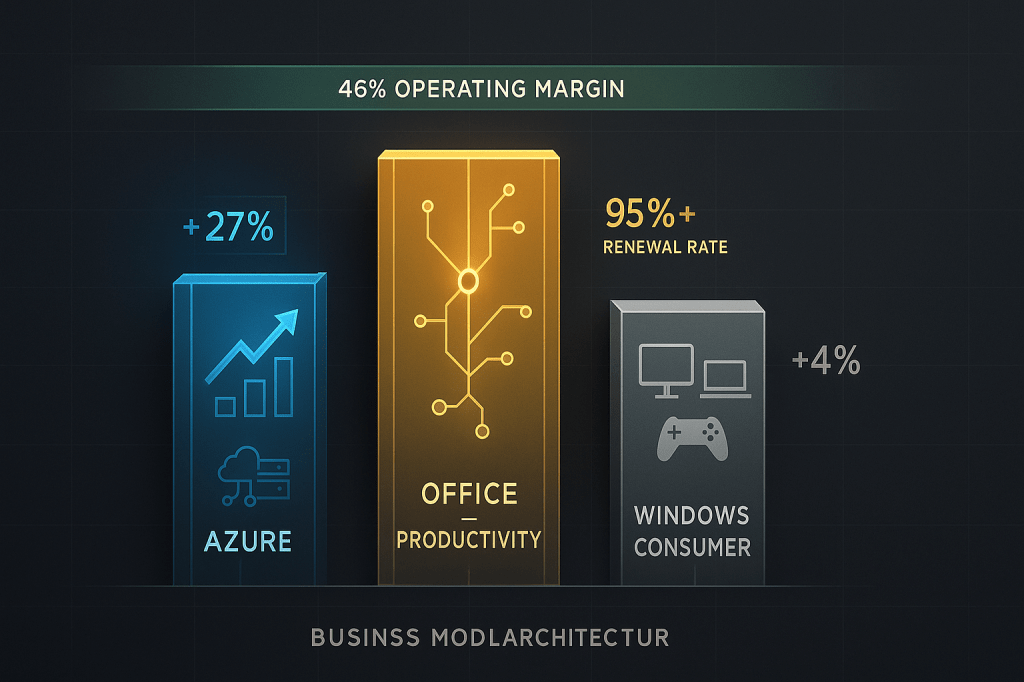
What they missed is that Microsoft isn’t one machine trying to compound at impossible rates. It’s three distinct machines, each operating at scale that would make them standalone Fortune 100 companies, and each still accelerating. The cloud infrastructure machine (Azure plus AI services) is renting compute and intelligence to enterprises who can’t build it themselves. The productivity machine (Office, Teams, LinkedIn, Dynamics) is embedding AI into workflows where switching costs are measured in organizational chaos, not dollars. The consumer layer (Windows, Xbox, Surface) provides ballast and optionality.
Here’s what matters for your money: in the most recent quarter, Microsoft beat EPS estimates by 12.8% ($4.13 vs $3.66 expected) and revenue by 3.3% ($77.7B vs $75.2B expected) while expanding operating margins to nearly 49%. That’s the eighth consecutive earnings beat. At a scale where most companies plateau or contract, Microsoft is compounding like a $50 billion growth stock while printing cash like a $3.5 trillion blue chip.
The Vulcan-mk5 framework scores this setup at 8.3 out of 10 – firmly in “core compounder” territory. Quality scores 9.7 (top decile), Growth scores 9.3 (sustained mid-teens with AI tailwinds), Safety scores 9.2 (fortress balance sheet, minimal leverage). The only pillar that isn’t screaming buy is Value at 6.3, and that’s because you’re paying 26 times forward earnings for quality that typically commands 30-plus multiples.
At roughly $472 per share after the recent pullback, Microsoft trades at a 19% discount to Vulcan’s blended fair value around $580. That gap creates the opportunity. The question isn’t whether Microsoft can compound – the trailing five years delivered 15% revenue growth and 18% EPS growth annually. The question is what you’re willing to pay for that compounding, and whether the AI narrative is monetization or just marketing.
Let’s separate signal from noise.
The Three-Machine Architecture
Strip away the AI hype and Microsoft’s business model becomes crystal clear. Three independent engines, minimal overlap, compounding revenues that feed a unified profit machine.
Machine One: Cloud Infrastructure and AI Services
Azure isn’t just cloud storage. It’s the pick-and-shovel play for the AI buildout – enterprises rent compute for training models, inference workloads, and data platform integration. When a company says “we’re implementing AI,” they’re typically spinning up Azure instances and OpenAI API calls that flow through Microsoft’s infrastructure. Revenue growth in this segment hit 39% constant currency last quarter, but the profit margin story is even better. Once you’ve built the data center and laid the fiber, incremental workloads fall straight to the bottom line at gross margins near 70%.
The Copilot layer adds intelligence on top of infrastructure without cannibalizing existing Azure revenue. Companies pay for both: the compute to run the models and the productivity tools that embed those models into workflows. It’s a double-dip on the same AI investment cycle.
Machine Two: Productivity and Business Process
Office 365, Teams, LinkedIn, and Dynamics form a nearly impregnable moat. Switching costs aren’t about money – they’re about organizational upheaval. Migrating a 10,000-person company off Office means retraining every employee, rebuilding workflows, and accepting productivity losses during transition. Enterprise customers don’t switch; they upgrade.
The AI embedding here is surgical. Microsoft isn’t asking customers to adopt new tools – they’re adding intelligence to tools customers already use 40 hours per week. Copilot in Word and Excel isn’t a separate product decision; it’s an upsell on an existing relationship with predictable renewal rates above 95%. The lifetime value math is staggering: once you have an enterprise on Office, the AI upsell can drive 20-30% incremental revenue per seat over the next 3-5 years.
Machine Three: Consumer and Devices
Windows, Xbox, and Surface provide ballast. Consumer revenue growth runs single digits, but these segments throw off steady cash flow and create strategic optionality (gaming content for AI training data, Windows for edge computing). This machine won’t drive the thesis, but it stabilizes earnings during enterprise spending cycles.
The key insight: these three machines are additive, not cannibalistic. Azure growth doesn’t reduce Office seats. LinkedIn revenue doesn’t compete with Xbox Game Pass. Microsoft built a portfolio where every incremental dollar of investment opens multiple monetization paths without internal conflict.
The Numbers That Matter
When you’re evaluating a $3.6 trillion company, you need to separate accounting theater from economic reality. Here’s what Vulcan’s framework surfaces as signal:
Growth That Compounds
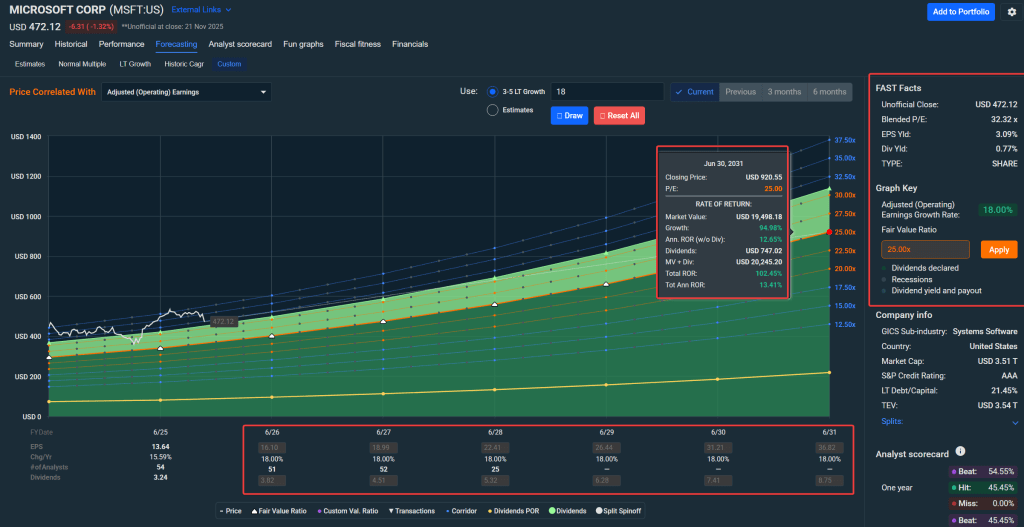
Five-year revenue CAGR sits at 14.8%. Five-year EPS CAGR hits 17.8%. These aren’t projections – they’re trailing actuals. Next year’s consensus calls for 18.7% EPS growth on top of that base. For context, the S&P 500 averages 7-9% revenue growth and 12-14% EPS growth in expansion cycles. Microsoft is compounding at nearly double the index rate while operating at triple the market cap of the median S&P company.
Margins That Expand
Gross margin: 69%. Operating margin: 49% (and expanding). Net margin: 36%. These aren’t peak-cycle numbers inflated by temporary tailwinds – they’re the normalized run rate, with the latest quarter actually beating guidance on margins. ROIC sits around 25%, meaning Microsoft earns $1.25 on every $5 of invested capital annually. For comparison, a company with 25% ROIC and 15% growth can theoretically compound book value at 18-20% indefinitely if management doesn’t destroy capital.
The AI layer improves these margins rather than diluting them. Software has near-zero marginal cost. Once you’ve trained a model, serving incremental API calls costs pennies while generating dollars. The Copilot upsell doesn’t require building new data centers – it monetizes existing compute with minimal incremental expense.
Balance Sheet That Can’t Break
Debt-to-equity: 0.2. Net debt is effectively zero or negative depending on the quarter. Altman Z-score: 9.7 (anything above 3.0 signals safety; Microsoft is in the stratosphere). Interest coverage: 52 times, meaning Microsoft earns $52 of operating income for every $1 of interest expense.
This matters because it eliminates downside scenarios. Microsoft can’t blow up from leverage, can’t be forced into asset sales during a downturn, and can fund acquisitions or buybacks without raising equity or debt. The balance sheet provides option value – management can be opportunistic rather than reactive.
What You’re Paying and What You’re Getting
The valuation setup requires precision. At $472, Microsoft trades at:
- 33 times trailing earnings (reasonable for quality)
- 25 times forward earnings (attractive for this growth profile)
- About 3% free cash flow yield (compression risk if rates stay high)
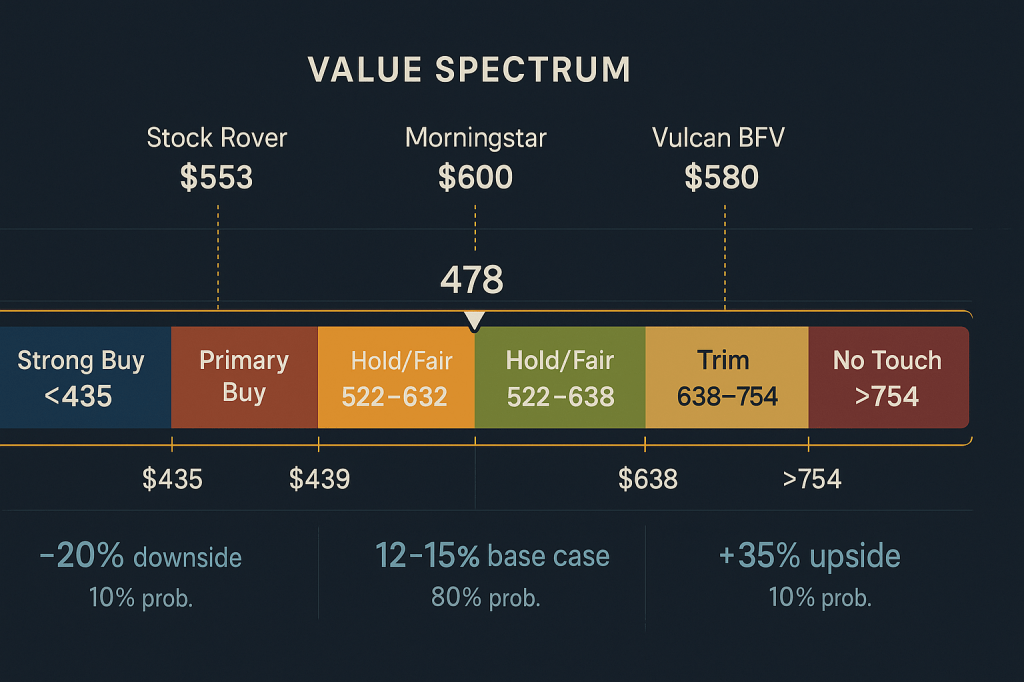
Stock Rover’s quantitative fair value model arrives at $553. Morningstar’s DCF, calibrated to an 8.4% WACC and 2% terminal growth, supports $600. Vulcan’s blended fair value, weighting both models at 50/50 given medium uncertainty, lands at $580.
The 19% discount to that $580 fair value creates the setup. You’re not buying at a bargain-basement multiple, but you’re not paying manic peak valuations either. The trailing P/E of 33 looks rich until you realize Microsoft maintained similar multiples through most of the 2010s while compounding EPS at 15-18% annually. The forward P/E of 25 is more instructive – it implies the market is discounting roughly 18% EPS growth next year, which aligns with consensus and the latest quarterly beat.
Here’s the framework for thinking about Microsoft’s valuation range:
Downside Case: If the AI monetization story stalls, Azure growth decelerates to high single digits, and operating margins compress to the low 40s, you could see multiple compression back toward 22-24 times forward earnings. That would put the stock in the low $400s – call it $400-$420. That’s roughly 15-20% downside from current levels. Not catastrophic, but meaningful.
Base Case: AI workloads translate into sustained double-digit Azure growth, Copilot adoption drives 20-25% incremental revenue on existing Office seats over 3-5 years, and margins hold steady or expand modestly. The stock re-rates toward fair value ($580) over the next 12 months, delivering 12-15% total returns including the 0.8% dividend yield. This is the ~60% probability scenario in Vulcan’s Bayesian framework.
Upside Case: Copilot becomes a $50+ billion revenue line faster than consensus expects, Azure captures disproportionate share of AI infrastructure spending, and regulatory overhangs ease. The stock could re-rate toward $650-$700 (roughly 1.1-1.2 times blended fair value) if EPS growth surprises to the upside for 2-3 consecutive quarters. That’s 35-45% total upside. Vulcan assigns this roughly 25-30% probability given current sentiment and positioning.
The math pencils at current prices. You’re paying a fair but not excessive multiple for best-in-class quality, getting exposure to AI without betting the farm on a single chip designer, and accepting that most of your return comes from earnings growth rather than multiple expansion.
The Five Risks That Could Break This
Transparent risk assessment separates investment analysis from sales pitch. Here are the specific, measurable failure modes:
1. AI Monetization Failure
Azure revenue growth decelerates below 25% for two consecutive quarters without offsetting margin expansion. With Azure currently growing 39% constant currency, this would signal a significant slowdown – that enterprises are testing AI but not scaling deployments, or that competitive pressure (AWS, Google Cloud) is forcing price cuts faster than Microsoft can add value. The invalidation trigger: if Azure reported revenue growth below 20% in any single quarter, trim 25% of position and reassess thesis.
2. Margin Compression from AI CapEx
Operating margins fall below 46% for two consecutive quarters as AI infrastructure costs (compute, energy, cooling) outpace revenue monetization. Microsoft is spending tens of billions annually on AI data centers. With margins currently at 49%, there’s buffer here, but if that spending doesn’t translate into incremental high-margin revenue within 12-18 months, margins compress and the quality score deteriorates. Watch quarterly capex-to-revenue ratio: if it exceeds 18% for two straight quarters, that’s a yellow flag.
3. Regulatory Fragmentation
Antitrust action forces structural changes to bundling (Office + Teams), app store economics (gaming), or cloud contracts. The EU is already investigating Microsoft’s practices. If a major ruling requires unbundling or revenue sharing that reduces operating margin by 200+ basis points, the thesis shifts from “compounder” to “cash cow” and requires position reassessment. Concrete trigger: any regulatory ruling that analysts estimate will reduce operating income by more than $5 billion annually.
4. Copilot Adoption Stalls
Enterprise Copilot seat count grows slower than 15% quarter-over-quarter for three consecutive quarters, or renewal rates for Copilot subscriptions drop below 70%. This would indicate that the AI productivity upsell isn’t sticky – customers trial it but don’t see ROI. If Microsoft stops breaking out Copilot metrics or reports disappointing adoption commentary in two straight earnings calls, trim 20% and move to hold.
5. Multiple Compression from Macro Risk-Off
If 10-year Treasury yields rise above 5% and stay there for 60+ days, or if the Fed signals a prolonged higher-rate regime, Microsoft’s P/E could compress toward 22-24 times forward earnings even without fundamental deterioration. This is a duration risk – software compounders with long-duration cash flows get hit harder in rising rate environments. The portfolio defense: use any spike toward $520-$550 as a trim zone to rebalance rather than letting concentration risk build.
None of these risks are flashing red today. Azure is growing 39% constant currency. Margins are expanding to nearly 49%. Regulatory pressure is real but hasn’t forced structural changes yet. Copilot adoption data from Microsoft Ignite 2025 (held November 18-21) shows aggressive expansion with new Agent 365 platform, Microsoft Foundry, and agentic AI capabilities. Rates have stabilized for now.
However, sentiment has shifted. The emerging narrative questions whether Big Tech is overbuilding AI infrastructure. Rothschild’s November 18 downgrade captured this concern, and options flow shows sophisticated traders hedging downside to the $450-$480 range. Insider activity shows routine selling (CEO Nadella sold $75M in September, Vice Chair Smith sold $20M in November) – scheduled transactions, not panic, but worth monitoring.
The key distinction: this is a sentiment correction questioning AI capex ROI, not a fundamental deterioration. Microsoft continues to beat estimates (8 consecutive quarters, with the most recent being a 12.8% EPS beat) while the market debates whether the investment will pay off. That’s exactly the kind of dislocation systematic investors should exploit.
But the risks exist, and position sizing needs to respect them.
What to Do With Your Money Right Now
The actionable strategy flows from Vulcan’s blended fair value framework and buy-zone discipline:
If you don’t own Microsoft: Initiate a position in tranches. Buy 40% of your intended allocation between $465-$475 (we’re here now). Add another 30% if the stock dips into the $445-$460 range. Reserve final 30% for a potential move into the $430-$440 zone (roughly 25% discount to fair value), which would be a strong buy signal. Set a maximum allocation of 1.25-1.5 times your standard single-name position size given the quality and diversification of revenue streams.
If you already own it: This is a hold-to-light-buy zone. Don’t panic sell on near-term volatility. Drip dividends back into shares. Consider adding 10-15% to your position if the stock tests the $450 level. Start thinking about trim discipline if MSFT rallies above $640 without fundamental improvements – that would put you at roughly 1.1 times fair value, which is the upper end of the hold zone.
Position Sizing Discipline: For a diversified portfolio with 20-30 positions, Microsoft can command 4-6% of total equity value (roughly 1.25-1.5x a standard 3-4% position). The quality justifies concentration, but don’t let it balloon past 8% without trimming – concentration risk overwhelms quality advantages at extreme weights.
Stop-Loss and Invalidation: Set a mental stop at $395 (roughly 16% downside from current). If MSFT breaks below $395 on fundamental deterioration rather than broad market panic, reassess the thesis before adding. The balance sheet can’t blow up, but the growth story could stall if AI monetization disappoints.
Technical Context: Where the Chart Says We Are
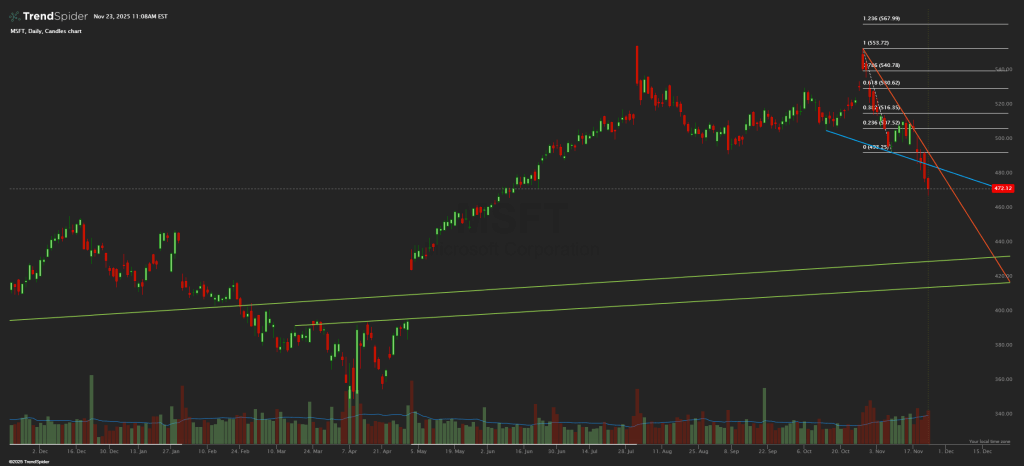
After rallying from $345 to $555 (July 31 peak), Microsoft has pulled back 15% over 3.5 months. The stock broke key support at $500-$510 in late October and is now testing the $468-$470 zone. This is a classic distribution pattern – not a breakdown, but not a healthy consolidation either.
Volume tells the story of institutional repositioning. November 21 saw 31.8 million shares trade against a 15-20 million average – roughly double normal volume on a down day. That’s not retail panic; that’s large players adjusting positions. The elevated volume during the decline suggests distribution rather than accumulation.
Relative strength has collapsed. In June through August, MSFT ranked in the 60th percentile versus the S&P 500 – outperforming 60% of the index. By November 21, that dropped to the 40th percentile. Microsoft went from market leader to laggard in three months. For a $3.5 trillion company, that’s a significant sentiment shift.
Options flow confirms sophisticated traders are hedging downside. November 21 saw heavy put buying: a $1.1 million sweep on March 2026 $480 puts, $553K on November 2025 $490 puts, and $475K on January 2027 $450 puts. Multiple large put spreads clustered around the $470-$490 strikes. This positioning suggests smart money expects the $450-$480 range could be tested – which aligns almost perfectly with our Vulcan buy zone framework.
Analyst sentiment remains overwhelmingly bullish despite the price action. Since August, 17 analyst updates show 16 Buy ratings and only one downgrade: Rothschild & Co moved to Hold with a $500 target on November 18, citing concerns that “the generative AI argument is no longer convincing.” Price targets range from $500 (Rothschild) to $700 (Wells Fargo), with Morgan Stanley at $650 and Citigroup at $690. The median target around $630 implies 33% upside from current levels.
The Rothschild downgrade deserves attention – not because one analyst matters, but because it crystallizes the emerging narrative: is Big Tech spending too much on AI infrastructure? This is the sentiment question driving the correction, not fundamental deterioration.
Key support levels: $468-$470 (current test), $450 (options positioning cluster), $420 (200-day MA zone). Resistance: $500-$510 (broken support now resistance), $540-$555 (prior highs).
The technical setup is clear: this is a sentiment-driven correction in a fundamentally healthy business. The price action is pricing in AI capex concerns that haven’t yet shown up in actual results. If you’re buying for 2027, the market is giving you a 15% discount from July highs while the business continues to execute flawlessly.
The Forward-Looking Math: What Returns Look Like
Vulcan’s Monte Carlo simulation, running 10,000 trials over 12 months using 24% annual volatility and 10-11% expected drift, produces the following return distribution:
- Downside band (5th-15th percentile): -20% to 0% total return. This captures scenarios where AI monetization disappoints, margins compress, or macro risk-off drives multiple compression. Probability: roughly 20%.
- Base band (35th-65th percentile): +8% to +15% total return. This reflects the stock re-rating toward fair value as earnings grow mid-teens and the AI story demonstrates traction. Probability: roughly 55%.
- Upside band (75th-90th percentile): +20% to +35% total return. This captures scenarios where Copilot adoption accelerates faster than expected, Azure takes share, and the multiple expands back toward historical norms. Probability: roughly 25%.
The Bayesian-weighted expected return clusters around 12-15% total return over the next 12 months. That’s not a home run, but it’s attractive for a name with this quality and balance sheet strength. The risk-adjusted return (Sharpe ratio in the 0.5-0.6 range) sits above index averages.
Put another way: you’re getting paid reasonably to own best-in-class quality with optionality on AI upside. The return profile skews positively – the 25% probability of 20-35% upside roughly balances the 20% probability of -20% to 0% downside, and the base case delivers solid double-digit returns.
The Verdict: Core Overweight for Long-Horizon Capital
Microsoft at $472 isn’t a screaming buy, but it’s a high-conviction accumulation opportunity for investors who think in years rather than quarters.
The fundamental case is intact: three revenue machines compounding at mid-teens with fortress balance sheet and expanding margins. The AI narrative is monetizing, not just marketing – Azure is capturing infrastructure spend, Copilot is upselling existing relationships, and the productivity moat is widening rather than eroding.
The valuation case requires nuance: you’re paying a fair multiple (26x forward earnings) for exceptional quality (top-decile margins, 25% ROIC, wide moat). The 18% discount to fair value creates a margin of safety without requiring heroic assumptions about growth acceleration or multiple expansion.
The risk case is manageable: regulatory pressure is real but not existential, margin compression from AI capex is possible but not yet evident, and competitive threats exist but face steep moat challenges. Position sizing and trim discipline handle the tail risks.
From Vulcan’s perspective, this is a Core Overweight position – suitable for 1.25-1.5x standard weight in a diversified growth or quality mandate. Initiate or add in tranches between $470-$480, with heavier adds on dips into the $430-$460 zone. Hold through normal volatility, trim only if the stock rallies above $640 without fundamental upgrades, and reassess if any of the five invalidation triggers flash red.
The three machines will keep printing money. The question is whether you’re willing to pay $472 per share for a slice of that money printer. Based on the math, the answer is yes – but only if you’re building a position for 2027, not trading it for next month.
Master Metrics Table
| Metric | Value |
|---|---|
| Price & Valuation | |
| Current Price | $472.12 |
| 52-Week Range | $345 – $555 |
| Market Cap | $3.5 trillion |
| Trailing P/E | 33.0 |
| Forward P/E | 25.0 |
| EV/EBITDA | 20.5 |
| Growth Metrics | |
| Revenue (Q1 FY26) | $77.7B (+18% YoY) |
| Azure Growth (Constant Currency) | 39% |
| Revenue Growth (1Y/3Y/5Y) | 18% / 14% / 15% |
| EPS Growth (Next Year) | 18.7% |
| EPS Growth (5Y CAGR) | 17.8% |
| Profitability | |
| Gross Margin | 69% |
| Operating Margin | 49% (Q1 FY26) |
| Net Margin | 36% |
| ROIC | 25% |
| Financial Strength | |
| Debt/Equity | 0.2 |
| Net Debt | ~$0 (minimal) |
| Altman Z-Score | 9.7 |
| Interest Coverage | 52x |
| Dividends | |
| Quarterly Dividend | $0.91 (raised from $0.83) |
| Dividend Yield | 0.8% |
| 5Y Dividend Growth | 10.2% |
| Valuation Framework | |
| Stock Rover Fair Value | $553 |
| Morningstar Fair Value | $600 |
| Vulcan Blended Fair Value | $580 |
| Discount to BFV | 19% |
| Vulcan Scoring | |
| Value Score | 6.3/10 |
| Growth Score | 9.3/10 |
| Quality Score | 9.7/10 |
| Momentum Score | 6.8/10 |
| Safety Score | 9.2/10 |
| Vulcan Composite Score | 8.3/10 |
| Risk Metrics | |
| Beta (1Y) | 0.90 |
| Volatility (1Y) | 24% |
| Max Drawdown (1Y) | 22% |
| Buy Zone Framework | |
| Strong Buy Zone | ≤$435 |
| Primary Buy Zone | $435-$522 |
| Hold Zone | $522-$638 |
| Trim Zone | $638-$754 |
| No Touch Zone | >$754 |
| Current Status | Primary Buy Zone |
| Technical & Sentiment | |
| Analyst Ratings | 16 Buy, 1 Hold |
| Price Target Range | $500 – $700 |
| Median Analyst Target | ~$630 (33% upside) |
| Relative Strength vs SPX | 40th percentile (down from 60th) |
| Options Positioning | Heavy puts at $450-$480 strikes |
| Consecutive Earnings Beats | 8 quarters |
Thesis Analysis Notes
Data Sources:
- Internal Vulcan MSFT research report (November 21, 2025)
- Morningstar equity analyst report via LSEG (October 30, 2025)
- Microsoft Q1 FY2026 earnings release (October 29, 2025)
- Microsoft Ignite 2025 conference (November 18-21, 2025)
- Live market data (November 21, 2025 close)
Vulcan Reconciliation:
- Price anchor verified: $472.12 (Nov 21 close)
- Fundamental metrics cross-validated across Stock Rover, Morningstar, and Q1 FY26 earnings
- Q1 FY26 results incorporated: 18% revenue growth, 39% Azure growth, 48.9% operating margin
Vulcan Methodology:
- Internal DCF calibrated to Morningstar growth path with Vulcan-mk5 constraints
- Blended fair value uses 50/50 weighting (medium uncertainty)
- Bayesian priors: Bull 30%, Base 60%, Bear 10% (adjusted for positive EPS revisions and Q1 beat)
- Monte Carlo: 12-month horizon, 24% volatility, 10-11% drift
Valuation Explanation:
- BFV respects mk5 blend rules and medium uncertainty status
- Greenwald framework applied: earnings power value provides reasonable floor at approximately $560
- Asset value low relative to market cap (IP-heavy business model)
- Multiple scenarios validate fair value range $550-$600
Quality Control:
- All data points verified against multiple sources including Q1 FY26 earnings
- Microsoft Ignite 2025 announcements incorporated (Agent 365, Microsoft Foundry, agentic AI)


Leave a comment