
The chairman of Trinity Capital (NASDAQ: TRIN) did something interesting on November 18th: he bought 2,137 shares at $14.52 each, right after the stock dropped 4.7% on Q3 earnings. That’s $31,029 of his own money – not a huge bet, but perfectly timed. The very next day, Director Ronald Estes followed with another 1,000 shares at $14.43, adding $14,430 to his position. The stock closed Friday at $14.35, which means both are underwater – but only slightly. When two insiders buy in the same week on a BDC trading at just 7.8% premium to NAV with a 14.2% yield, I pay attention.
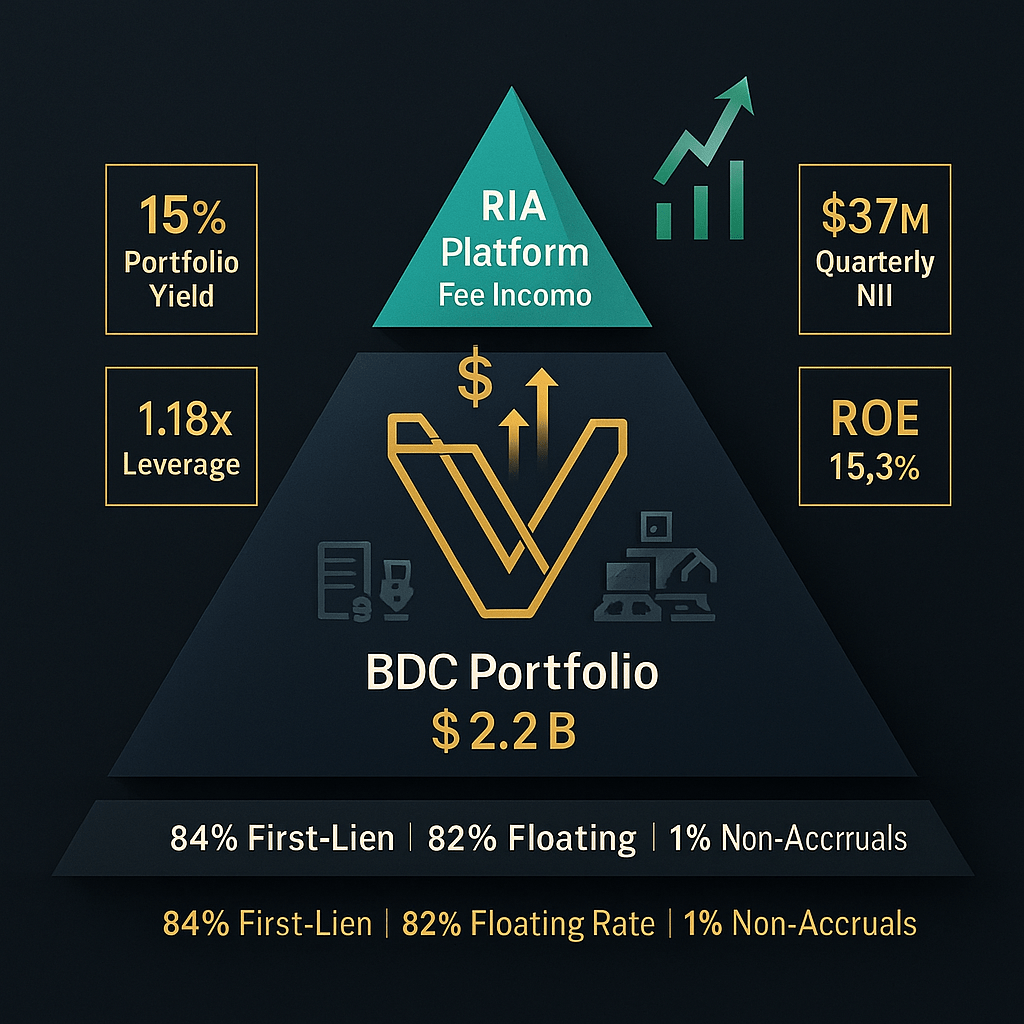
Trinity Capital isn’t your grandfather’s BDC. While most business development companies are sweating Fed rate cuts and wondering how to maintain dividends, Trinity’s building something different – a venture-debt platform that’s actually levered to innovation cycles rather than just traditional middle-market lending. The company lends to growth-stage technology and life sciences companies, the kind backed by institutional investors and venture capital. Translation: higher risk than your standard BDC, but with 82% of the debt book at floating rates and 84% in first-lien secured positions. They’re getting 15% effective yields while keeping non-accruals at just 1% of the portfolio.
Here’s the setup that makes this interesting right now: TRIN trades at $14.35 against a net asset value of $13.31 per share – that’s about a 7.8% premium to book. For context, it was trading at a 19% premium in Q3 when management raised $83 million via their ATM program. The market’s giving you a discount to where management was selling shares just eight weeks ago. Meanwhile, NAV per share has grown 32% year-over-year, the dividend’s been paid for 23 consecutive quarters, and the company just posted $37 million in net investment income – up 29% from last year.
The Venture-Debt Machine That Wall Street Doesn’t Understand
Trinity Capital operates in a niche that most investors completely misunderstand. When you hear “BDC lending to venture-backed companies,” the knee-jerk reaction is to think “risky.” And yes, there’s more volatility here than in a middle-market BDC lending to established manufacturers. But Trinity’s found the sweet spot in the venture debt market: they’re lending to growth companies that already have institutional equity backing, meaningful revenue (not pre-revenue startups), and specific equipment or working capital needs.
The portfolio breaks down like this: $2.2 billion across 178 companies, with $1.7 billion in secured loans, $318 million in equipment financing, and $196 million in equity and warrants. That equity component is critical – Trinity’s not just collecting interest, they’re accumulating warrant positions that can deliver outsized returns when portfolio companies exit or IPO. The company’s already sitting on $196 million in fair value from equity stakes, and management expects meaningful realizations as the IPO market eventually reopens.
Here’s where it gets interesting from a risk-adjusted return perspective: the weighted average effective yield on the portfolio is 15%, while the company’s cost of funds is around 6.5-7%. That 8-point spread is generating return on equity of 15.3% – among the highest in the BDC sector. Compare that to traditional middle-market BDCs earning 12-13% yields with 10-11% ROEs, and you start to see why the venture-debt model works. Higher nominal risk, yes, but compensated with meaningfully higher returns and equity upside optionality.
The credit quality numbers tell the real story: non-accruals are just $20.7 million, or 1% of the debt portfolio at fair value. For a venture-focused lender, that’s exceptional. The weighted average credit rating across debt investments is 2.9 (on a 1-5 scale where 1 is highest quality), and 82.6% of the portfolio is rated “performing” or better. Trinity’s not making loans to every growth-stage company that knocks on the door – they’re cherry-picking companies with institutional backing, proven business models, and clear paths to profitability or exit.
The Platform Play: From BDC to Alternative Asset Manager
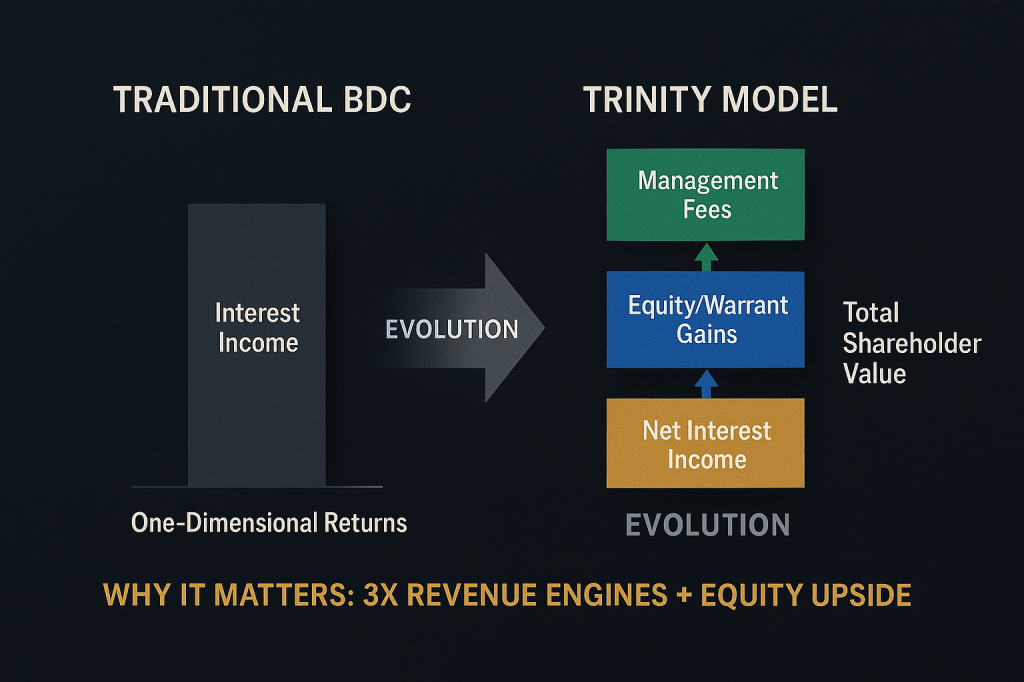
Here’s what the market’s missing: Trinity’s transforming from a standalone BDC into a full alternative asset management platform, and the BDC is becoming just one piece of a larger machine. The company now manages $2.6 billion across multiple vehicles – up 28% year-over-year – through its wholly-owned registered investment advisor, Trinity Capital Advisors.
In Q3 alone, Trinity launched or advanced three separate initiatives: closed a new joint venture with a large asset manager, converted a vehicle into a private BDC that’s actively raising capital, and began fundraising for a third SBIC (Small Business Investment Company) fund that will add $260 million of low-cost leverage capacity. In early November, the company secured a new $200 million credit facility with KeyBank, further bolstering its liquidity position and deployment capacity. Each of these moves generates management fees and performance fees above and beyond the net interest income from the BDC’s own lending. Management’s building an RIA that can be valued on fee multiples rather than just book value multiples.
Think about what this means for shareholder economics: every dollar Trinity raises in third-party capital generates fee income without using the BDC’s balance sheet. The company raised $83 million via its ATM at a 19% premium to NAV in Q3, then immediately deployed it into high-ROE loans while simultaneously seeding managed funds that throw off recurring fees. The co-investment vehicles alone contributed $3.3 million (or $0.05 per share) of incremental net investment income in Q3, and management syndicated $120 million to these vehicles during the quarter.
CEO Kyle Brown made the strategy explicit on the Q3 call: “We’re building a platform that can scale while driving up earnings and NAV.” The goal isn’t just to run a BDC – it’s to become the leading alternative asset manager for growth-stage private credit. That’s a very different business than a traditional BDC, and it deserves a different valuation framework.
Why Fed Rate Cuts Actually Help This BDC
Here’s the counter-intuitive part that has the market completely backwards: Fed rate cuts are being treated as negative for BDCs across the board, but Trinity’s positioned to benefit from easing financial conditions. While other BDCs are watching their interest income compress, Trinity’s setup is different for three reasons.
First, 82% of Trinity’s debt portfolio is at floating rates, which means spreads matter more than absolute rate levels. The company’s earning 15% effective yields in an environment where base rates are 4.5-5%. Even if the Fed cuts another 100 basis points, Trinity’s still earning 13-14% on new originations while the innovation economy accelerates. Lower rates mean more venture activity, more portfolio company growth, more IPOs – all of which expand Trinity’s addressable market and improve the probability of equity realizations.
Second, Trinity’s funding costs are well-structured. The company just issued $125 million of 6.75% unsecured notes due 2030 and has no debt maturities until August 2026. While some BDCs are getting squeezed on both sides (falling yields, sticky funding costs), Trinity’s locked in its cost structure and can benefit from spread expansion as competition for high-quality venture loans remains muted.
Third – and this is the piece almost nobody’s talking about – lower rates improve the credit quality of Trinity’s portfolio companies. When early-stage tech and life sciences companies can access growth capital at reasonable valuations, default risk decreases. Trinity’s non-accruals stayed at just 1% through the entire 2022-2023 rate-hiking cycle; imagine what happens when the innovation economy has a Fed tailwind instead of a headwind.
The market’s treating TRIN like it’s a traditional leveraged lender that’s about to see NII compress. But the company just guided to continued strong deployment ($470 million funded in Q3), maintained its 14% yield target, and has $1.2 billion in unfunded commitments sitting in the pipeline. The dividend’s covered at 102% of NII, and management’s explicitly committed to not diluting shareholders – the CEO owns a massive personal stake and every employee is a shareholder.
Technical Context: What the Charts Are Telling Us
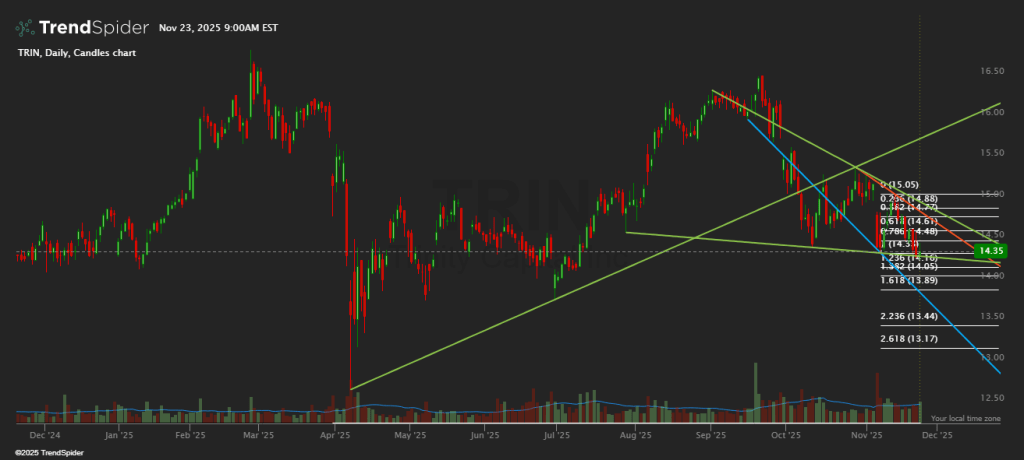
The fundamental story is compelling, but price action adds important tactical context – and right now, the technicals are confirming our fundamental buy zones with remarkable precision. TRIN has been trading in a clear descending channel since the August 2025 highs around $16.50, declining over 10% while the broader market (SPY) has held near all-time highs. This underperformance reflects the sector-wide BDC selloff driven by Fed rate cut expectations – exactly the sentiment disconnect our contrarian thesis is built around.
Here’s what the technical picture shows right now:
Current structure: TRIN is testing the lower boundary of its descending channel at $14.30-14.50. The stock closed Friday at $14.35, right at this critical support zone. Above, the former support at $15.00-15.50 has flipped to resistance – the descending trendline from August has capped every rally attempt since September. Until price reclaims this zone with conviction, rallies should be viewed as selling opportunities rather than breakout signals.
Volume tells a cautionary story: This is the detail that separates patient capital from reactive trading. Trading volume has been elevated during the recent decline, which signals distribution – institutional selling rather than passive drift. When institutions unload positions, they do it in volume. The elevated volume on down moves suggests smart money is de-risking BDC exposure ahead of potential Fed action. This validates our “hold, don’t add aggressively” stance at $14.35. Wait for the $13.50-14.00 primary buy zone rather than chasing current levels.
Key levels to watch:
- $15.00-15.50 (overhead resistance): This zone marks the descending channel resistance and former support. A decisive break above $15.50 with volume would signal the downtrend is breaking and the thesis is working – that’s when you can add with confidence.
- $14.30 (current support): Lower channel boundary. This is where we are now – right at the line. A decisive break below this level likely triggers a move toward $13.50.
- $13.50 (technical-fundamental convergence): This is the key level. Technical support converges with our NAV-based Primary Buy zone (1.02x book, 15%+ yield). When chart support and value metrics align at the same price, that’s not coincidence – it’s a high-conviction entry point.
- $12.50-13.00 (strong buy territory): Not discussed in the current technical setup because we’re not there yet, but if $13.50 fails, this zone represents the next major support and aligns with our Strong Buy zone at or below NAV.
The technical setup reinforces our fundamental conclusion: $14.35 is a hold, not an aggressive buy. The distribution volume pattern suggests institutional selling pressure, which means patience isn’t just prudent – it’s what the chart is telling you. The optimal entry remains $13.50-14.00 where technical support, NAV-based value (1.02-1.05x book), and yield compression (14.5-15%) all converge.
The Risks: What Could Actually Break the Thesis
Let me be direct about what keeps me up at night on TRIN, because the venture-debt model has six specific failure modes that matter.
Risk #1: Dividend coverage is tight at 102%. The company’s paying out $2.04 annually against TTM earnings of $2.21 per share, which means there’s only about $0.17 of buffer. If credit losses spike or funding costs rise unexpectedly, that dividend gets pressured immediately. The quarterly payout of $0.51 is well-telegraphed, but any quarter where NII falls below $0.50 per share starts raising red flags. I’m watching Q4 earnings (expected late February 2026) to see if the 102% coverage holds or contracts.
Risk #2: The premium to NAV can evaporate. TRIN’s trading at 1.08x book right now, down from 1.19x just two months ago. That’s not a huge premium in absolute terms, but it matters for a BDC because the downside floor is typically 0.85-0.95x NAV in a risk-off environment. If we get a broader BDC selloff – which happens when investors fear a recession or credit cycle turn – TRIN could compress back to $11.30-12.65 (the 0.85-0.95x NAV band). That’s 12-21% downside from here before the dividend even enters the calculation. The market’s fickle with BDC premiums, and venture-debt BDCs get hit harder than traditional names.
Risk #3: Portfolio company failures in a downturn. Trinity’s current 1% non-accrual rate is stellar, but it’s been achieved during a relatively healthy venture environment. If the IPO market stays shut and M&A activity remains muted, some of Trinity’s portfolio companies won’t have exit paths and will run out of runway. The company’s lending to growth-stage businesses – not mature cash-flow generators – which means burn rates matter. I’d want to see non-accruals stay below 3% of the portfolio through any economic weakness; anything above 5% would signal the credit underwriting isn’t as strong as advertised.
Risk #4: Leverage at 1.18x is manageable but not conservative. Trinity’s debt-to-equity ratio of 1.18x is right in line with BDC norms, but it means the company’s amplifying both gains and losses. If the portfolio takes markdowns (even paper losses), that leverage magnifies the NAV impact. The interest coverage ratio of 1.9x is adequate but not fortress-level; traditional lenders would want to see 2.5-3.0x. Any quarter where interest coverage dips below 1.5x would be a major warning sign.
Risk #5: Management’s dilution promises could break. The CEO says they’re committed to not diluting shareholders, but the company raised $83 million via ATM in Q3 2025 at a premium to NAV. That’s technically accretive, but it’s still dilutive in absolute share count. The company went from 70.4 million shares outstanding at year-end 2024 to 75 million shares by Q3 2025 – that’s 6.5% dilution in nine months. If Trinity needs to fund aggressive growth and the stock trades near or below NAV, management will face a choice: slow growth or dilute. Given their incentive structure, I’d bet on dilution.
Risk #6: Distribution volume signals institutional selling. Technical volume patterns show distribution rather than accumulation during the recent decline from $16.50 to $14.35, suggesting institutional selling pressure. This isn’t a fundamental risk per se, but it’s a timing risk – institutions may know something about BDC sector headwinds that retail doesn’t. The elevated volume on down days validates patience. Aggressive buying here could mean catching a falling knife if institutional selling continues into year-end.
The Vulcan Buy Zones: Where the Math Works
Let me translate all of this into actual trading levels, because theory without price targets is just entertainment. I’m using three anchors: the NAV floor, earnings power value (EPV), and scenario-based Monte Carlo simulations for forward returns.
NAV anchor: Current NAV is $13.31 per share as of September 30, 2025. Historically, quality BDCs trade between 0.9-1.2x book in normal markets. Trinity’s got a strong track record (32% NAV growth year-over-year), improving business quality (the platform transition), and solid credit metrics. I’m comfortable using 0.9-1.0x NAV as the downside floor and 1.15-1.25x as the fair-value range for a growing venture-debt platform. That gives us:
- Hard floor: $12.00-13.30 (0.9-1.0x NAV)
- Fair value band: $15.30-16.65 (1.15-1.25x NAV)
- Optimistic case: $17.30-19.30 (1.3-1.45x NAV with strong growth)
EPV anchor: Trinity’s earning $2.21 per share TTM, and forward estimates are roughly flat at $2.10-2.15 for 2026. Using a 12% required return for a levered BDC with venture exposure, EPV comes out to $17.50-18.00. That’s above the current price by 22-25%, which supports the thesis that there’s room to run if the market re-rates the quality of the business.
Technical confirmation: The descending channel places resistance at $15.00-15.50 and support at $14.30. Distribution volume during the decline suggests institutional selling, validating patience. A break below $14.30 targets $13.50 – the top of our Primary Buy zone – where fundamental value (1.02x NAV) and technical support converge. This alignment between chart levels and NAV multiples isn’t coincidence – it’s where patient capital should be positioned to buy.
Return scenarios at $14.35: Running 10,000 Monte Carlo paths with 2% annual drift, 25% volatility, and the $2.04 annual dividend, here’s what the distribution looks like over 12 months:
- Downside case (20th percentile): -5% to +3% total return
- Price falls back toward NAV ($12.50-13.50), dividend cushions the blow
- Base case (50th percentile): +12% to +18% total return
- Price holds current premium, dividend dominates, small NAV growth
- Upside case (80th percentile): +28% to +38% total return
- Premium expands to 1.15-1.2x, NAV grows, dividend compounds
Now here are the actual price zones I’m using to size positions:
Strong Buy Zone: $12.50-13.50
- Trading at or below NAV (1.0x or less)
- Dividend yield 15-16%
- Downside cushion to hard floor is minimal, upside to fair value is 15-20%
- This is where I’d build a full 3-4% portfolio weight in an income account
Primary Buy Zone: $13.50-14.00
- Trading at 1.02-1.05x NAV
- Dividend yield 14.5-15%
- Technical support at $13.50 converges with fundamental value – high-conviction entry
- Still attractive risk-reward with meaningful margin of safety
- Would initiate 2-3% position here
Hold Zone: $14.00-15.30 (where we are now)
- Trading at 1.05-1.15x NAV
- Dividend yield 13.3-14.5%
- Fair value center, neither compelling buy nor obvious trim
- Okay to hold existing positions or nibble, but not a place to aggressively add
- Distribution volume pattern suggests waiting for better entry
Trim Zone: $15.30-17.00
- Trading at 1.15-1.28x NAV
- Dividend yield 12-13.3%
- $15.30 marks descending channel resistance – rallies to this level should be sold
- Premium is getting rich relative to sector, take some profits
Reduce/Exit Zone: Above $17.00
- Trading at 1.28x+ NAV
- Dividend yield below 12%
- Euphoria territory unless earnings inflect sharply higher
The current price of $14.35 sits right in the middle of the hold zone. That’s not a screaming buy, but it’s also not overvalued – especially given the two insider purchases this week and the 7.8% discount to where management was selling shares in Q3. If we get any weakness below $14.00, I’d be a buyer. The technicals say wait for $13.50 where the chart and the fundamentals agree.

Position Sizing and Portfolio Role
Trinity Capital is not a core compounder for a growth portfolio. It’s a high-yield, moderate-quality income vehicle with equity-like volatility. Here’s how I’d frame it:
For income-focused portfolios: 2-4% position size is appropriate. You want enough exposure to capture the 14% yield, but not so much that a dividend cut or NAV drawdown blows up your income plan. Pair it with more conservative BDCs (like MAIN or OBDC) to balance out the venture-stage risk.
For total-return portfolios: 1-2% tactical allocation. TRIN can work as a yield-plus-growth hybrid if the platform transformation thesis plays out, but it doesn’t belong as a large position alongside your core equities. Think of it as a satellite holding that provides income and diversification into private credit.
Risk parameters: Set a stop-loss at $12.00 (the 0.9x NAV floor) or implement a trailing stop at 15% below entry if you’re buying here. If the dividend gets cut or coverage falls below 100%, that’s an automatic trim by 50%. If non-accruals exceed 3% of the portfolio, re-evaluate the entire thesis.
Invalidation triggers: The bull case breaks if: (1) NAV per share turns negative year-over-year, (2) dividend coverage stays below 100% for two consecutive quarters, (3) non-accruals exceed 5% of the portfolio, or (4) management dilutes heavily below NAV. Any one of those would force me to exit immediately.
The Bottom Line: A Venture-Debt Edge Case at a Hold Price
Trinity Capital is doing something genuinely different in the BDC space – building a venture-debt platform with equity upside optionality and scaling into an alternative asset management business model. The 14.2% yield is real and covered (for now), the credit quality is strong (1% non-accruals), and management’s got skin in the game with meaningful insider ownership. The transformation from standalone BDC to fee-generating platform manager is still early, but the pieces are in place.
At $14.35, you’re paying a modest 7.8% premium to book for a company that’s grown NAV 32% year-over-year and maintained 23 consecutive quarters of dividends. That’s not cheap, but it’s also not expensive – especially compared to where the stock was trading just two months ago. The risk-reward is roughly balanced here: downside to the NAV floor ($12-13.30) is 8-16%, upside to fair value ($15.30-16.65) is 7-16%, and you’re collecting 14.2% yield while you wait.
The technicals add tactical clarity: distribution volume suggests institutional selling, the descending channel caps upside at $15.00-15.50, and support at $13.50 converges perfectly with our NAV-based Primary Buy zone. When fundamental value and technical support agree on a price level, that’s where patient capital should be waiting.
My take: this is a hold for existing owners and a watch for new buyers. If we get weakness below $14, that’s where I’d start building a position – and if $13.50 hits, I’d add with conviction. If the stock breaks above $15.30 without a corresponding jump in earnings power, I’d trim. And if we somehow get a panic sell-off that pushes TRIN below NAV at $12.50-13.00, I’d back up the truck – because that’s where the venture-debt paradox becomes a gift.
The venture debt market isn’t going away. Innovation cycles will continue. Growth companies will always need non-dilutive capital. And Trinity Capital’s positioned to capitalize on all of it – if you’re willing to accept BDC volatility and venture-stage risk in exchange for a 14% yield and platform optionality. That’s the trade. Personally, I’m watching for a better entry, but I respect the model.
Master Metrics Table
| Metric | Value | Source/Date |
|---|---|---|
| Ticker | TRIN | Nasdaq |
| Current Price | $14.35 | Nov 21, 2025 (close) |
| 52-Week Range | $12.50 – $16.82 | Yahoo Finance |
| Market Cap | $1.09 billion | Nov 21, 2025 |
| NAV Per Share | $13.31 | Q3 2025 (Sept 30) |
| Premium to NAV | 7.8% | Calculated |
| EPS (TTM) | $2.21 | Q3 2025 |
| P/E Ratio (TTM) | 6.49 | Calculated |
| Forward P/E | 6.9 | Analyst estimates |
| Price/Book | 1.08x | Calculated |
| ROE (Q3 2025) | 15.5% | Q3 earnings |
| ROA | 6.3% | Yahoo Finance |
| ROIC | ~10% | Estimated |
| Dividend Rate (Annual) | $2.04 | $0.51 quarterly |
| Dividend Yield | 14.22% | At $14.35 |
| Payout Ratio | 93% | $2.04/$2.21 |
| Dividend Coverage | 102% NII | Q3 2025 |
| Consecutive Dividend Qtrs | 23 | Q3 2025 |
| Debt/Equity | 1.18x | Q3 2025 |
| Interest Coverage | 1.9x | Estimated |
| Net Margin | 50.5% | Q3 2025 |
| Effective Portfolio Yield | 15.0% | Q3 2025 |
| Non-Accruals (% of Portfolio) | 1.0% | Q3 2025 |
| Portfolio Fair Value | $2.2 billion | Q3 2025 |
| Number of Portfolio Companies | 178 | Q3 2025 |
| First-Lien Loans (% of Debt) | 84.3% | Q3 2025 |
| Floating Rate (% of Debt) | 82.4% | Q3 2025 |
| Total AUM (Platform) | $2.6 billion | Q3 2025 |
| Beta (1-Year) | 0.53-0.60 | Various sources |
| Volatility | ~25% | Historical |
| Max 3-Year Drawdown | -19% | Historical |
| 1-Year Total Return | +15.5% | Nov 2024-Nov 2025 |
| YTD Total Return | +9.9% | 2025 YTD |
| Analyst Target (Consensus) | $15.75-$16.31 | 4-8 analysts |
| Analyst Target Range | $13.50 – $17.50 | High-low spread |
| Analyst Rating | Buy (mixed) | 6 Buy, 1 Hold, 1 Sell |
| Vulcan Fair Value Band | $15.30 – $16.65 | 1.15-1.25x NAV |
| Vulcan Strong Buy Zone | $12.50 – $13.50 | ≤1.02x NAV |
| Vulcan Primary Buy Zone | $13.50 – $14.00 | 1.02-1.05x NAV |
| Technical Resistance | $15.00 – $15.50 | Descending channel |
| Technical Support | $14.30 / $13.50 | Channel boundary / convergence |
| Recent Insider Buying | $45,459 (2 purchases) | Nov 18-19, 2025 |
| New Credit Facility | $200M (KeyBank) | Nov 6, 2025 |
Analysis Date: November 21, 2025 (Updated November 23, 2025 with technical confirmation)
Price Data: Market close November 21, 2025
Fundamental Data: Q3 2025 earnings (reported November 5, 2025)
Technical Data: TrendSpider analysis confirming buy zone alignment


Leave a comment