
The world’s largest alternative asset manager is hiding in plain sight, trading 20% below fair value while compounding capital at rates that would make most hedge funds envious. Blackstone ($BX) sits at $146.64, yet the math suggests it should command at least $183—a disconnect that reflects market confusion, not business reality.
Here’s the paradox: Blackstone manages $1.24 trillion in alternative assets and generated $6 billion in fee-related earnings over the past year, yet the market treats it like a macro-sensitive cyclical rather than the fee-collecting annuity it has become. This is the story of how the firm that revolutionized private equity transformed itself into something Wall Street still hasn’t figured out how to properly value.
The Cash Machine Hidden Behind the PE Label
Think of Blackstone as owning the toll booths on every major road in the alternative investment universe. Real estate. Private equity. Credit. Infrastructure. The firm doesn’t just invest—it collects perpetual fees from $906 billion in fee-earning assets while sitting on another $188 billion in dry powder waiting for opportunities.
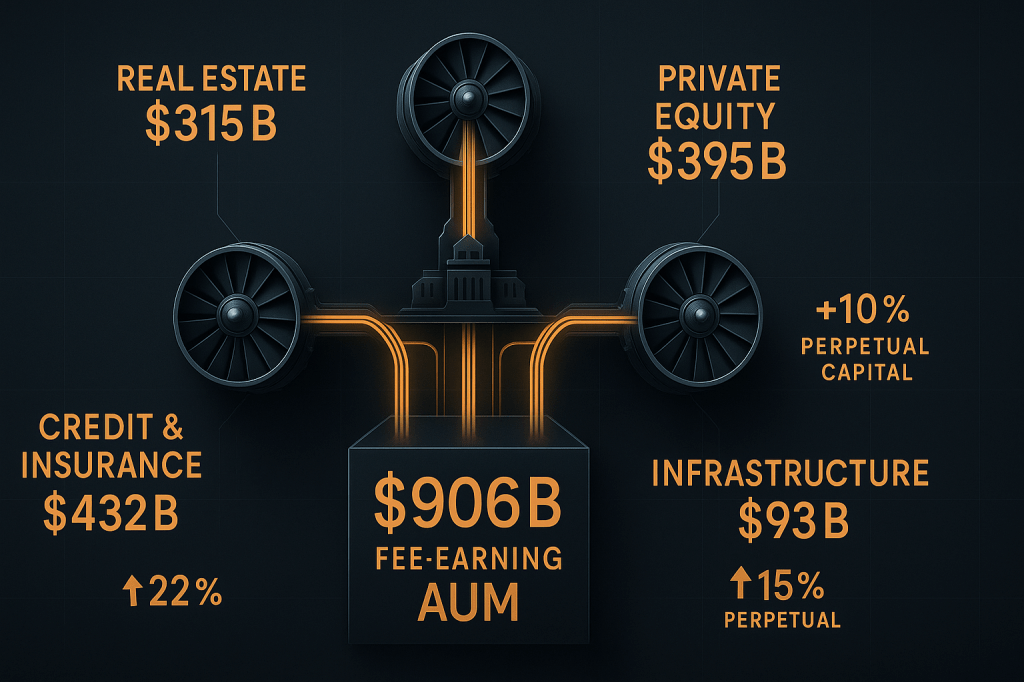
The economics are stunning: In Q3 2025 alone, Blackstone generated $1.52 in distributable earnings per share, with fee-related earnings of $1.20—a 25% year-over-year jump. That’s $4.92 per share in annual run-rate fee income before considering the carried interest that kicks in when investments perform. This isn’t a business model dependent on market timing; it’s a compounding machine that prints fees regardless of exit windows.
The firm’s competitive moat isn’t just scale—it’s the flywheel effect of perpetual capital. With $500.6 billion now locked in perpetual vehicles (up 15% year-over-year), Blackstone has transformed from a traditional PE shop subject to redemption risk into a capital fortress. Think of it like this: Traditional asset managers rent their capital; Blackstone increasingly owns the relationship.
The Credit Engine No One’s Pricing In
While everyone obsesses over Blackstone’s private equity heritage, the firm’s Credit & Insurance division has quietly become a $432 billion powerhouse—the largest segment by AUM and growing 22% year-over-year. This isn’t your grandfather’s leveraged loan book. This is an integrated platform linking direct lending, asset-backed finance, and insurance capital in ways that generate 72% higher fee-related performance revenues than a year ago.
The beauty of the credit business: It thrives in higher-rate environments. Every Fed pause extends spreads and deepens margins. Every credit cycle creates distressed opportunities where Blackstone’s $50+ billion credit dry powder becomes offense rather than defense.
The insurance angle adds another layer most investors miss. By partnering with insurance companies desperate for yield, Blackstone effectively gained a permanent funding source that pays management fees to deploy capital. It’s the financial equivalent of being paid to go shopping with someone else’s money.

Real Estate: The Misunderstood Recovery Play
Yes, commercial real estate remains challenged. Office valuations are down. Regional banks are stressed. But Blackstone’s real estate book ($315 billion, 26% of total AUM) isn’t your local REIT portfolio. The firm front-ran the remote work trend by rotating into logistics, data centers, and life sciences—sectors with structural tailwinds measured in decades, not quarters.
The Q3 data tells the story: While opportunistic real estate funds showed -1% year-over-year growth, the firm generated $10.8 billion in private equity inflows. Management isn’t frozen—they’re rotating. The $30.6 billion in realizations over the past year provided liquidity to fund the next cycle while demonstrating that exit markets, though selective, remain open for quality assets.
Here’s the contrarian angle: Real estate weakness is already priced in at a 22× forward P/E multiple. But the market isn’t pricing in the optionality that comes when rate cuts arrive and real estate valuations stabilize. With property values 20-30% below peak in commercial sectors, Blackstone’s war chest becomes a call option on the next decade of infrastructure build-out.
The Math That Makes This Obvious
At $146.64, Blackstone trades at 27× trailing earnings but only 22.6× forward estimates—a meaningful compression that reflects expected growth in fee-related earnings as assets scale and performance fees monetize. The Vulcan quality score of 85/100 ranks in the 88th percentile for growth stocks, supported by 15.7% net margins and A+ credit rating with stable outlook.
But the real story is in the cash generation: $6.5 billion in net accrued performance revenues sits on the books—that’s $5.30 per share in already-earned but not-yet-distributed income. When exit markets normalize, this embedded carry converts to realized cash, funding both dividend growth (25% expected forward growth rate) and opportunistic buybacks.
The balance sheet provides additional comfort: $11.1 billion in cash and net investments, 14× interest coverage, and manageable 1.6× debt-to-equity ratio. This isn’t a levered bet on market timing—it’s a fortress balance sheet supporting an annuity revenue stream.
Why the Market Gets This Wrong
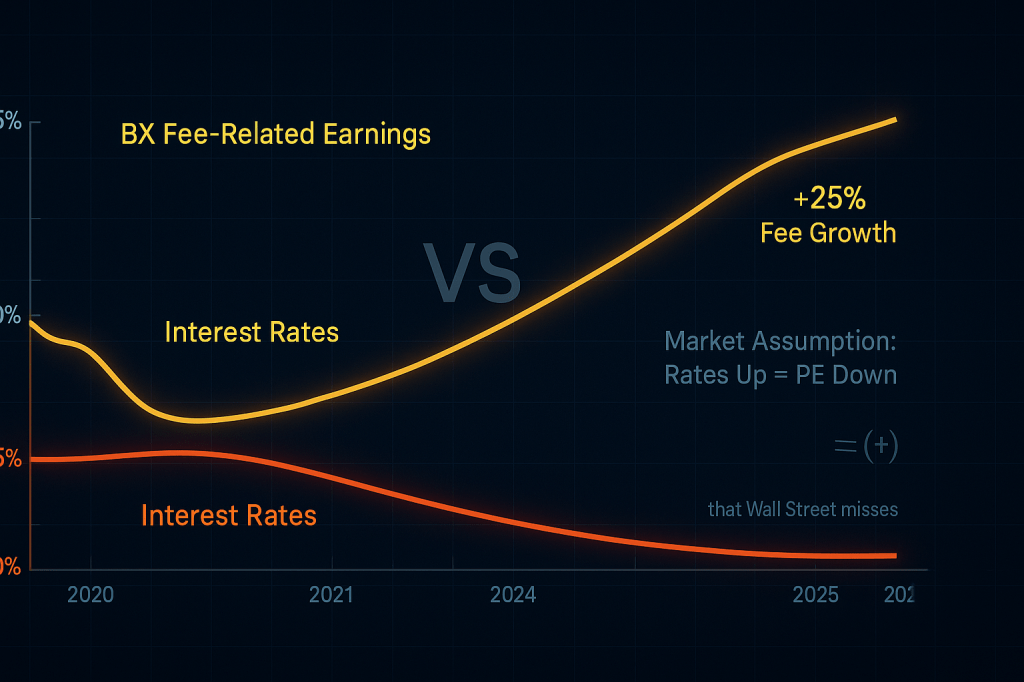
Most investors still treat Blackstone as a “rates proxy”—assuming higher yields automatically compress PE multiples and kill deal flow. The data disagrees. In higher-rate environments, Blackstone’s credit spreads widen (good for returns), insurance partners increase allocations (good for AUM growth), and competition from leveraged buyers diminishes (good for purchase pricing).
The firm’s performance in 2022-2023 proved this: Even as rates spiked from 0% to 5%, fee-earning AUM grew 10%, fee-related earnings climbed 25%, and the business demonstrated pricing power through management fee increases on mature funds.
The second misunderstanding: Assuming PE exits drive the business model. Reality check—fee-related earnings (the stable, recurring piece) now exceeds $6 billion annually and grows independent of carry timing. The performance fees are upside optionality, not the base case.
The Five Risks That Could Derail This Thesis
1. Extended Exit Market Freeze (Probability: 30%)
If IPO and M&A windows stay shuttered beyond mid-2026, portfolio companies age without monetization. This pressures IRRs and potentially slows fundraising for new vehicles. The invalidation trigger: Two consecutive quarters of declining fee-earning AUM or LP redemption requests exceeding 5% of perpetual capital base.
2. Regulatory Overreach on Fee Disclosure (Probability: 20%)
The SEC continues examining performance fee structures across alternative managers. A rule change requiring delayed recognition or enhanced disclosure could create near-term earnings volatility. Watch for: Any SEC rulemaking proposals specifically targeting carried interest accounting or management fee transparency.
3. Private Credit Blow-Up Contagion (Probability: 15%)
While Blackstone’s credit portfolio shows minimal stress, a broader private credit market dislocation could trigger redemptions and reputational damage across the asset class. The early warning sign: Credit spread widening beyond 700bps on BB-rated corporate debt or significant NAV write-downs at peer firms.
4. Real Estate Value Trap Deepens (Probability: 25%)
If office space remains structurally impaired and suburban retail follows, real estate AUM could face persistent negative flows beyond 2026. Monitor: BREIT redemption requests and real estate fund return rankings falling below 30th percentile vs. peers for three consecutive quarters.
5. Permanent Shift in Institutional Allocations (Probability: 10%)
Though unlikely, pension and endowment mandates could pivot away from alternatives toward public markets if 60/40 portfolios sustainably outperform. The tell: Three years of negative organic AUM growth despite positive market performance.
The Tactical Game Plan for Accumulation
Conservative Entry: $141-$146 zone (Current)
This represents the 20% discount to Vulcan fair value estimate of $183.45. Start with 3-5% portfolio weight for quality-growth allocations.
Aggressive Entry: $125-$135 on macro panic
If broader market selloff drags BX down with financials sector (despite uncorrelated business model), scale to 7-10% position across taxable and tax-advantaged accounts.
Invalidation Level: $115 or sustained break of $120
Below this level, either the thesis is broken (unlikely given cash generation) or a better opportunity emerged. Reassess if fee-related earnings guide below $4.50/share annually or AUM growth turns negative for two straight quarters.
Trimming Zones:
- First trim: $185-$195 (fair value achieved, take 20-30% profits)
- Second trim: $210+ (25% premium to fair value, consider reducing to 5% core holding)
- Never sell entirely: The compounding and dividend growth support a perpetual 3-5% allocation
Position Sizing Philosophy:
This is a 5-7% core holding in a diversified portfolio, not a 15-20% concentration bet. The business quality justifies overweight vs. typical single-name exposure, but the financial sector label means it moves with credit cycles whether or not fundamentals justify it. Size accordingly.
The Next 12 Months: Three Scenarios
Bull Case (30% probability): +28-35% total return
Exit markets reopen as yields stabilize. Performance fees monetize $2B+ of accrued carry. Fee-earning AUM grows 12%+ as private wealth channels scale. Multiple expands to 26-28× forward as market recognizes recurring revenue quality. Target: $205-210.
Base Case (55% probability): +15-20% total return
Moderate exit activity supports steady carry realization. Fee-earning AUM grows 7-9% through institutional reallocations. Dividend increases 20-25% annually. Multiple holds at 23-25× forward. Target: $180-190.
Bear Case (15% probability): -8-12% total return
Macro shock freezes deal activity. Credit stress emerges in pockets of portfolio. Fee growth slows to mid-single digits. Multiple contracts to 19-21× on uncertainty. Target: $135-145.
Weighted expected return: ~18% with 4.5% downside protection from current dividend yield growing at mid-20% clip. The asymmetry favors long-term holders.
Why This Matters Beyond the Ticker
Blackstone represents a meta-shift in how capital gets allocated. As public markets shrink (fewer IPOs, more take-privates), alternatives become the new public markets. Pension funds, endowments, and increasingly retail investors need access to these return streams. Blackstone built the pipes.
The firm isn’t just riding a trend—it’s creating the infrastructure for the next generation of wealth building. Every data center powering AI workloads. Every logistics hub enabling e-commerce. Every insurance pool seeking yield. Blackstone’s business model monetizes the intersection of capital formation and structural change.
At $146 per share with $6 billion in recurring fee earnings and $7 billion in distributable cash flow, the market is offering access to this flywheel at a 20% discount to intrinsic value. The opportunity exists because Wall Street still thinks “private equity = cyclical.” The reality: Blackstone became an annuity that looks like a PE firm.
For investors building portfolios designed to compound across decades rather than quarters, this disconnect between perception and reality is the definition of opportunity. The business prints cash. The moat deepens annually. The dividend compounds. The only question is whether you’re willing to look past the sector label and see the quality underneath.
Master Metrics Table
| Metric | Value | Interpretation |
|---|---|---|
| Current Price | $146.64 | Below fair value |
| Fair Value Estimate | $183.45 | 20% upside to intrinsic value |
| Vulcan Quality Score | 85/100 | Strong (88th percentile) |
| Vulcan Growth Score | 88/100 | Excellent AUM/fee growth trajectory |
| Vulcan Safety Score | 53/100 | Moderate (financial sector vol) |
| Total AUM | $1.24T | Largest alternative manager globally |
| Fee-Earning AUM | $906B | +10% YoY, drives recurring revenue |
| Perpetual Capital | $500.6B | +15% YoY, stickiest capital base |
| Net Margin | 15.7% | Strong profitability vs. peers |
| ROIC | 12.9% | Solid capital efficiency |
| Forward P/E | 22.6× | Attractive vs. 27× trailing |
| Dividend Yield | 2.9% TTM | 3.2% forward with 25% growth |
| Credit Rating | A+ Stable | Investment grade fortress |
| Interest Coverage | 14× | Ample cushion on debt service |
| Beta (3-year) | 2.0 | Elevated correlation to financials |
| Expected Total Return (12M) | +18% | Risk-adjusted with dividend |
Source Data: Vulcan-mk5 Unified Database (Zen Research Terminal 2025-11-02), Stock Rover Research Report (Nov 1, 2025), CFRA Research Report (Nov 1, 2025), Live Market Data (Nov 2, 2025)
Last Updated: November 6, 2025, Prices for analysis from November 2nd.
Next Review Trigger: Q4 2025 earnings (late January 2026) or sustained move below $140


Leave a comment