
While private credit headlines shout about defaults and “BDC meltdowns,” Blue Owl Capital is quietly compounding cash flow behind the noise. At $15.77 as of October 31, 2025, the stock trades like another over-levered credit story—yet the math tells a different tale. Blue Owl now runs nearly $295 billion in assets, collects recurring fees from permanent capital, and pays a ~5.7 percent dividend that’s well covered by rising Distributable Earnings. Fear says walk away. Math says the business still compounds quietly in the background.
This disconnect creates opportunity. When market panic creates a 40 percent gap between price and intrinsic value, patient investors who understand the underlying cash-generation model can build positions at yields that won’t be available once sentiment normalizes. The question isn’t whether Blue Owl will survive—it’s whether you’ll recognize the opportunity before the crowd does.
The Business Behind the Cash Flow
Blue Owl is one of the largest alternative-asset platforms in North America, but that label undersells what the company actually does. Think of it as three separate but interconnected income engines, each feeding the others with data, capital, and cross-selling opportunities.
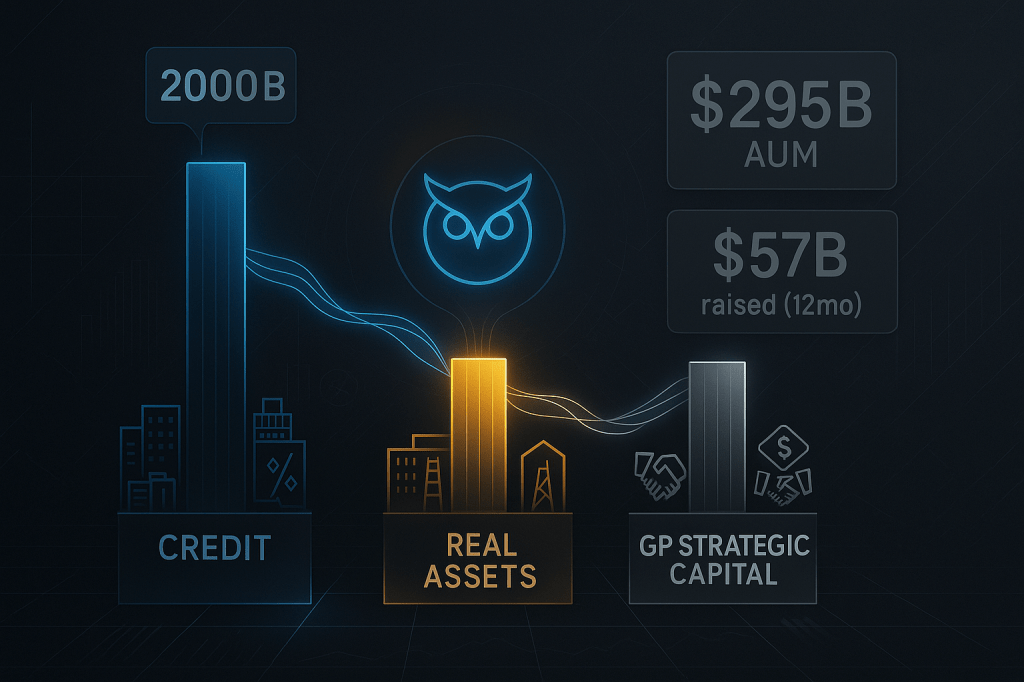
The Credit arm makes senior loans to middle-market companies—businesses too small for the syndicated loan market but too large for traditional bank lending. These loans typically range from $50 million to $500 million, carry floating rates tied to SOFR, and sit at the top of the capital structure. When you lend to a software company expanding through acquisition or a healthcare services provider building new facilities, you’re earning 9-12 percent yields with downside protection through seniority and covenants. That’s the core of Blue Owl’s Credit business, and it’s grown from tens of billions to nearly $200 billion in AUM since the 2021 merger that created the modern company.
The Real Assets platform operates differently. Instead of lending against cash flows, Blue Owl finances physical infrastructure with long-term contracted revenues. Think data centers with 15-year power agreements, cell towers with multi-year carrier contracts, or distribution facilities under triple-net leases to investment-grade tenants. These assets throw off predictable income, often with inflation escalators built into the contracts. The recent $27 billion joint venture with Meta to finance its Hyperion AI data center project exemplifies this strategy—Blue Owl is effectively becoming a financier for the AI infrastructure buildout, earning steady fees on capital that’s locked up for a decade or more.
The third leg—GP Strategic Capital—is the most misunderstood. Blue Owl takes minority stakes in private equity and venture capital managers themselves, not just the funds they manage. When you own 10-20 percent of a growing PE firm, you participate in both the management fees that firm collects and the carried interest it earns when investments pay off. This creates a second layer of fee income that compounds as those GP partners raise larger funds and expand into new strategies. It’s a bet on the private capital industry itself, not just individual deals.
Together, these three platforms create something rare: a diversified fee stream that doesn’t correlate perfectly with public markets. When credit spreads widen, Real Assets can still close infrastructure deals. When M&A slows, GP Strategic continues collecting fees from existing fund commitments. This structural diversification is why Blue Owl weathered the 2022 rate shock and 2023 banking crisis without cutting its dividend—the model was built for resilience, not maximum upside.
A Quiet Run of Execution
Fundraising momentum tells the story better than any press release. The company raised $14 billion in new capital during Q3 2025 and $57 billion over the last twelve months—proof that institutional and insurance allocators still want private credit exposure even as public markets fret about defaults. For context, that $57 billion run rate would rank Blue Owl among the top five asset managers globally by gross fundraising, despite being less than four years old in its current form.
AUM has scaled almost six-fold since the 2021 Owl Rock and Dyal merger, from roughly $50 billion to $295 billion today. More importantly, the mix has improved. Permanent capital—assets that can’t be redeemed on short notice—now represents more than 60 percent of the total, up from under 50 percent at formation. This permanent capital base allows Blue Owl to co-invest alongside its funds, earning both management fees and a share of investment returns, without the liquidity risk that plagues traditional fund managers during market stress.
The company continues to add strategies and distribution channels, broadening beyond institutional clients into high-net-worth and retirement markets. Recent partnerships with insurance companies and 401(k) platforms are opening access to billions in retail savings that have historically been locked out of private markets. This distribution expansion matters because it diversifies the funding base and reduces reliance on the larger institutional clients who might pull back during macro uncertainty.
Despite higher rates pressuring corporate borrowers, management reports no spike in defaults across the $200 billion credit portfolio. The lending book skews toward senior, floating-rate exposure that actually benefits from elevated base rates—each 100 basis point increase in SOFR translates directly to higher interest income on the portfolio. Portfolio credit quality metrics remain stable, with non-accruals under 1 percent and weighted-average loan-to-value ratios in the mid-50s. These aren’t heroic assumptions; they’re disclosed portfolio statistics that anyone can verify in the quarterly supplements.
Why It Matters Now
Blue Owl’s evolution into a multi-franchise fee engine means it can monetize the same balance sheet several ways. A corporate loan generates management fees, servicing income, and potential upside from equity co-investments. An infrastructure asset creates acquisition fees, ongoing asset management income, and portfolio company board fees. A GP stake compounds through both base management fees from that partner’s funds and carry participation when their deals succeed.
That combination makes OWL less cyclical than its “credit fund” label suggests. Investors willing to look past the noise are effectively buying a growing infrastructure-style income stream at a financial-sector multiple. The business isn’t immune to recession—credit losses would rise and deal flow would slow—but it’s far more durable than the current valuation implies.
Recent strategic moves reinforce this thesis. The Meta AI data center joint venture isn’t just a large transaction; it’s a proof point that Blue Owl can finance decade-long infrastructure projects at institutional scale. These aren’t speculative venture bets—they’re contracted revenue streams backed by the largest technology companies in the world. As AI infrastructure spending accelerates from tens of billions to hundreds of billions over the next decade, Blue Owl is positioning itself as the financier of choice for developers and hyperscalers who need capital but want to preserve their own balance sheets for core operations.
The Math of Valuation

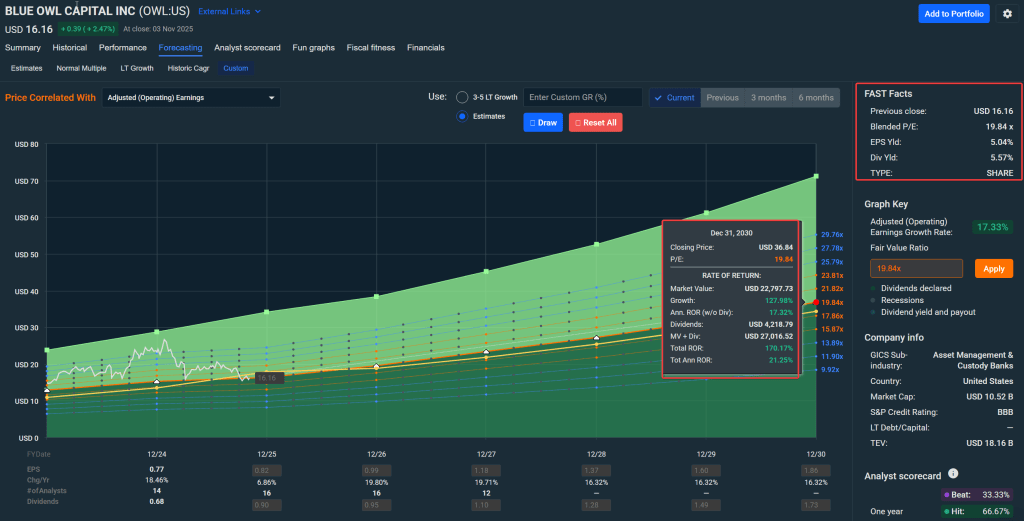
At $15.77, OWL trades around 16 times forward earnings and roughly 11 times fee-related earnings before performance fees. For context, Blackstone trades at 20x, Apollo at 19x, and KKR at 17x—all for similar business models with comparable growth profiles. Blue Owl’s discount likely reflects two factors: its shorter public track record (less than four years) and the recent sector-wide selloff in private credit names. Neither reflects the underlying economics.
A conservative discounted cash flow model anchored to management’s 10-15 percent Distributable Earnings growth guidance yields fair value near $22—roughly 40 percent upside to current prices. That DCF assumes no multiple expansion, no acceleration in fundraising, and no benefit from the Meta JV or other large deals in the pipeline. It’s a pure “business continues as-is” case, and it still produces mid-20s fair value within 18 months.
On a free-cash-flow yield basis, the stock offers 4-5 percent based on trailing twelve-month cash generation, rising to 5-6 percent as new fund commitments season and begin generating steady fees. That yield advantage matters in a market where the S&P 500 yields under 2 percent and investment-grade bonds offer 5-6 percent with no equity upside. You’re getting paid to wait while the business compounds.
Street consensus mirrors this math: 16 analysts rate the shares “Buy” or “Strong Buy” with an average target around $22.70. The highest targets reach $28-30, assuming accelerated fundraising and multiple expansion as the private credit cycle normalizes. Even the bears aren’t predicting disaster—the lowest published target sits at $19, still 20 percent above today’s quote. This isn’t a controversial call; it’s a consensus view that the market is temporarily mispricing long-term value.
The Dividend Floor
Unlike most alternative managers that chase performance fees and pay erratic dividends, Blue Owl leads with yield. The quarterly dividend of $0.225 represents a 5.7 percent yield at current prices—higher than most REITs, twice the S&P 500 average, and well above investment-grade bond yields for comparable duration.
That payout rose more than 20 percent over 2024, supported by a 22 percent increase in Distributable Earnings to $1.13 billion. Management’s stated policy is to pay out approximately 100 percent of DE each quarter, providing full visibility into the sustainability of the distribution. There’s no retained earnings cushion, but there’s also no risk of the dividend being cut to fund growth investments—those are funded from the permanent capital base and asset-level debt.
With a payout ratio near 100 percent of current-year DE, further dividend growth depends entirely on AUM expansion and fee margin improvement. The visibility here is unusually high for a financial stock. Management has disclosed $40 billion of near-term Real Assets deals in late-stage due diligence, another $15 billion of Credit commitments awaiting funding, and several GP Strategic opportunities that could add $500 million-plus to annual fee run rate. Each of these converts into Distributable Earnings with 60-70 percent incremental margins, meaning even modest AUM growth translates directly to higher payouts.
The dividend also creates a natural floor under the stock. At $14-15, the yield approaches 6 percent—a level that historically attracts income-focused buyers in size. During the September 2024 private-credit panic, OWL briefly touched $14.50 before stabilizing as dividend investors stepped in. That pattern matters for risk management: there’s a known base of support from yield-seeking capital that limits downside even if growth concerns persist.
Sentiment vs. Substance
The market still prices Blue Owl as if it were a 2022 credit risk story. After peaking above $26 in early 2025, the stock fell 40 percent as private-credit fears spiked following several high-profile defaults at unrelated BDCs and direct lenders. The selloff was indiscriminate—anything with “credit” or “BDC” in the description got hit, regardless of actual credit quality or business model differences.
Yet the underlying fundamentals never cracked. During the worst of the August-September drawdown, Blue Owl reported record quarterly fundraising, stable portfolio metrics, and raised full-year guidance. Analysts at several major banks, including Goldman Sachs, Morgan Stanley, and Barclays, published notes describing the name as “significantly undervalued” and reiterating Buy ratings. The disconnect between business performance and stock price reached levels not seen since the 2020 COVID panic—and in both cases, those willing to lean into the fear were rewarded over the following 12-18 months.
Investor sentiment remains fragile, but the operating data argue for patience. Capital continues to flow into alternative platforms at record pace. Default metrics across the private credit industry remain well below historical norms despite rising rates. Fee income grows each quarter, supported by both new fundraising and seasoning of older vintages. The narrative is slowly shifting from “when will defaults surge” to “when will the stock reflect the actual business performance.”
Recent catalysts have begun to move sentiment. The Meta AI data center joint venture, announced in October 2025, demonstrated Blue Owl’s ability to win landmark deals at institutional scale. Commentary from co-CEO Doug Lipschultz that “we see no rising defaults in our portfolio” despite bankruptcy fears provided concrete pushback against sector-wide concerns. Third-quarter results that beat consensus expectations on both fee income and Distributable Earnings reinforced the gap between perception and reality.
Technical patterns are beginning to stabilize as well. After months of lower highs and lower lows, the stock has carved out a base between $15-16 over the past six weeks. Volume on down days has declined while volume on up days has increased—classic signs of selling exhaustion. The stock is forming what technicians call a “volatility compression pattern,” where the trading range narrows before a decisive breakout. History suggests these patterns resolve in the direction of the underlying fundamental trend—and for Blue Owl, that trend is clearly positive.
Scenarios and Probabilities
Base case (55 percent probability): Steady 10-15 percent AUM and Distributable Earnings growth continues as bank retrenchment and private market allocations provide structural tailwinds. Management maintains the dividend and raises it modestly each year in line with DE growth. Multiple expands from current 16x to 17-18x forward earnings as sentiment normalizes, reflecting the quality and durability of the fee stream. Fair value reaches $22 within 12-18 months. Total return including dividends approaches 50 percent.
Bull case (25 percent probability): Continued fundraising success, new flagship strategies in high-demand areas like AI infrastructure, and operating leverage from scale push DE growth above 20 percent annually. The Meta JV and similar large deals validate Blue Owl’s ability to compete for trophy assets, prompting institutional analysts to raise long-term growth assumptions. Multiple expands toward peer average of 19-20x. Target price reaches $28-30. Combined with dividends, total return exceeds 100 percent over 18 months.
Bear case (20 percent probability): Broader credit markets tighten as Fed policy remains restrictive or economic growth disappoints. New capital commitments slow meaningfully, forcing Blue Owl to compete more aggressively on fees to maintain fundraising pace. Portfolio credit quality deteriorates modestly, requiring higher loss provisions and reducing Distributable Earnings. Management cuts the dividend 15-20 percent to preserve balance sheet flexibility. Multiple compresses to 11-12x as investors flee private credit exposure. Downside target $12, representing roughly 25 percent loss from current levels.
Expected value across these scenarios, probability-weighted, centers around $21—still indicating meaningful upside even after incorporating tail risks. The distribution is asymmetric: the bull case offers 80-90 percent upside while the bear case implies 20-25 percent downside, a favorable 3-to-1 risk-reward ratio that justifies position initiation for long-term investors.
Risk and Invalidation
Blue Owl’s biggest macro risk is the credit cycle itself. A wave of corporate defaults stemming from recession, persistent high rates, or sector-specific stress (commercial real estate, energy, retail) would reduce both asset values and origination volumes. Credit losses would eat into fee revenues while slower deal flow would pressure new fundraising. In a severe downturn scenario, Distributable Earnings could decline 20-30 percent from peak, forcing dividend cuts and triggering multiple compression.
Competition is intensifying as every large asset manager expands into private credit. Blackstone, Apollo, KKR, Ares, and Carlyle are all raising dedicated direct lending funds, while regional banks and specialty finance companies are forming their own platforms. This competition could pressure origination fees, loan pricing, and ultimately margins across the industry. Blue Owl’s scale and permanent capital structure provide advantages, but they’re not insurmountable moats.
Regulatory changes pose longer-term uncertainty. The SEC has proposed enhanced disclosure requirements for private funds, potentially increasing compliance costs and reducing information advantages. Changes to BDC tax treatment or restrictions on retirement account allocations to alternative assets could limit distribution channels. While Blue Owl isn’t structured as a BDC and thus avoids some regulatory risks, broader restrictions on private credit would affect the entire ecosystem.
Specific invalidation triggers that would require reassessing the thesis:
- Distributable Earnings decline more than 10 percent year-over-year for two consecutive quarters. This would signal deteriorating fee margins or portfolio credit quality beyond normal cyclical variation.
- Management cuts the quarterly dividend absent a temporary capital need. A cut driven by earnings weakness rather than strategic redeployment would break the yield floor and likely trigger a 20-30 percent selloff.
- Non-accrual rates on the credit portfolio exceed 3 percent. This would indicate systematic underwriting problems rather than isolated credit events.
- Net fundraising turns negative (redemptions exceed new commitments) for two consecutive quarters. This would suggest fundamental loss of competitiveness or market share to other platforms.
- Stock closes below $14.25 for three consecutive weeks. This technical break would violate the support base established over the past six months and suggest institutional sellers overwhelming dividend buyers.
Any of these events should trigger immediate portfolio review and consideration of position reduction or exit, depending on the severity and management’s response.
Investment Recommendation
Rating: BUY
Price Target: $22.00 (12-18 month horizon)
Current Price: $15.77 (as of October 31, 2025)
Upside Potential: 40% (excluding dividends)
Total Return Potential: 45-50% (including 5.7% annual yield)
Blue Owl Capital warrants a BUY rating at current levels for investors seeking income-growth exposure with institutional-quality fundamentals. The 40 percent discount to fair value, combined with a sustainable 5.7 percent dividend yield and double-digit earnings growth visibility, creates an asymmetric risk-reward setup that favors patient capital.
This is not a short-term trade or momentum play. The recommendation assumes an 18-24 month holding period to allow sentiment normalization and fundamental value recognition. Investors should be comfortable with near-term volatility and potential 10-15 percent drawdowns as private credit sector sentiment remains fragile.
Entry Strategy:
- Immediate allocation: 1.0-1.5% at $15.50-16.50 (current range)
- Add on weakness: Additional 1.0-1.5% if price pulls back to $14.50-15.00
- Maximum position: 4.0% of portfolio regardless of conviction level
Price Targets:
- Conservative: $19-20 (20% upside) – assumes modest multiple expansion to 17x earnings
- Base case: $22 (40% upside) – fair value based on DCF and peer multiples
- Bull case: $26-28 (65-75% upside) – assumes accelerated growth and 19-20x multiple
The recommendation will be downgraded to HOLD if the stock reaches $21-22 without corresponding improvement in growth outlook, or upgraded to STRONG BUY if price falls below $14 with fundamentals intact.
Position Sizing and Time Horizon
For diversified portfolios, OWL fits best as an income-growth satellite holding rather than a core position. The combination of 5.7 percent current yield and potential 10-15 percent annual Distributable Earnings growth creates an attractive total return profile, but the private credit exposure and single-company concentration warrant position size discipline.
Starter position: 1.0-1.5 percent of portfolio value at current prices ($15.50-16.00). This establishes exposure without overcommitting before the thesis proves out. The yield alone provides 5-6 percent annual income on this allocation while limiting downside to 1 percent of total portfolio even in a severe 30-40 percent drawdown.
Core position: 2.5-3.0 percent as Distributable Earnings growth continues and fundraising momentum sustains. Add to the position on any pullback to $14.50-15.00, using volatility to improve blended entry price. At 3 percent allocation, the dividend alone contributes 15-20 basis points to portfolio yield while equity appreciation potential remains meaningful.
Maximum position: 4.0 percent maximum even with high conviction. Private credit concentration risk and single-stock exposure warrant a cap regardless of valuation opportunity. The combination of credit risk, interest rate sensitivity, and competitive pressure creates enough uncertainty that larger positions could dominate portfolio behavior during stress periods.
Recommended time horizon is 18-24 months minimum. While the gap between current price and fair value is substantial, sentiment normalization in private credit will take time. Near-term volatility is likely as macro crosscurrents persist and sector rotation continues. The investment case depends on DE compounding and dividend accumulation, both of which require patience. Investors with shorter time horizons or low tolerance for mark-to-market volatility should wait for technical confirmation above $17-18 before entering.
The Bottom Line
Blue Owl isn’t a hype stock or a momentum trade—it’s an income engine mispriced by fear. The business generates over a billion dollars in annual Distributable Earnings, pays it out as dividends, and compounds the base through systematic AUM growth. Banks continue retreating from corporate lending. Alternative asset allocations continue rising. Infrastructure spending for AI and technology continues accelerating. These are multi-year secular trends, not quarterly sentiment swings.
As those trends play out, Blue Owl’s permanent capital model becomes increasingly valuable. The company can co-invest, take on large projects, and maintain steady payouts through cycles—advantages that closed-end funds and BDCs don’t possess. The current 40 percent discount to intrinsic value reflects temporary sector fear, not permanent business impairment.
The numbers support patience: stable credit metrics, record fundraising, rising dividends, and consensus price targets 40 percent above today’s quote. For investors willing to collect a 5.7 percent yield while the market reprices long-term value, Blue Owl offers what’s increasingly rare—a measurable edge. The cash flow is real, the yield is covered, and the price is wrong. That’s enough.
Master Metrics Table — Blue Owl Capital ($OWL)
| Metric | Value | Notes / Context |
|---|---|---|
| Current Price | $15.77 | As of October 31, 2025 close |
| Market Cap | $24.4 B | Large-cap alternative-asset manager |
| AUM (Sept 2025) | $295 B | Record high; +22% YoY growth |
| Capital Raised (Q3 2025) | $14 B | $57 B over trailing 12 months |
| Distributable Earnings (2024) | $1.13 B | +22% YoY; supports dividend |
| Free Cash Flow (TTM) | ≈ $1 B | Conversion improving with scale |
| Dividend / Yield | $0.225 quarterly / ≈ 5.7% | 2025 increase ≈ +21% YoY |
| Payout Ratio | ~100% of DE | Fully covered by cash flows |
| Forward P/E (2026E) | 16.6× | Below peer average (18-20×) |
| EV / Fee-Related Earnings | ≈ 11× | Discount to large-cap alts |
| FCF Yield | 4-5% | Attractive vs. S&P ~2% |
| Revenue Growth (3 yr CAGR) | +19% | Fundraising-driven expansion |
| Gross Margin (approx.) | ~55% | High for asset-manager model |
| Debt / Equity | 0.6 | Moderate, manageable leverage |
| Interest Coverage | > 8× | Strong ability to service debt |
| Altman Z-Score | 5.8 | Financially healthy (> 3.0 safe zone) |
| Piotroski F-Score | 7 / 9 | Sound operational fundamentals |
| 1-Year Beta | 1.25 | Moderate systematic risk |
| Volatility (1 Y) | 38% | Lower than many credit peers |
| Max Drawdown (1 Y) | −33% | Post-summer 2025 credit-scare pullback |
| Dividend Coverage (Q3 DE / Div) | 1.03× | Slight surplus maintained |
| Analyst Price Target (Avg.) | $22.7 | +44% upside vs. current |
| Buy Rating % | 69% (11 of 16) | Broad “Moderate Buy” consensus |
| Notable Institutional Holders | BlackRock, Vanguard, Capital Group | ~45% combined ownership |
| CEO Comment (2025) | “Private capital continues to replace bank and public solutions.” | Long-term secular tailwind |
| Key Catalysts Ahead | Fundraising momentum, Meta AI JV, potential rate cuts | Core drivers through 2026 |
Disclosures: This analysis is for educational purposes only and does not constitute investment advice. The author may hold positions in securities discussed. Investors should conduct their own due diligence and consult financial advisors before making investment decisions. Past performance does not guarantee future results. All data current as of October 31, 2025.
Sources: Blue Owl Capital investor presentations and SEC filings; company management commentary; consensus analyst estimates; public market data; industry research reports; Meta Platforms infrastructure announcements; Federal Reserve economic projections.


Leave a comment