
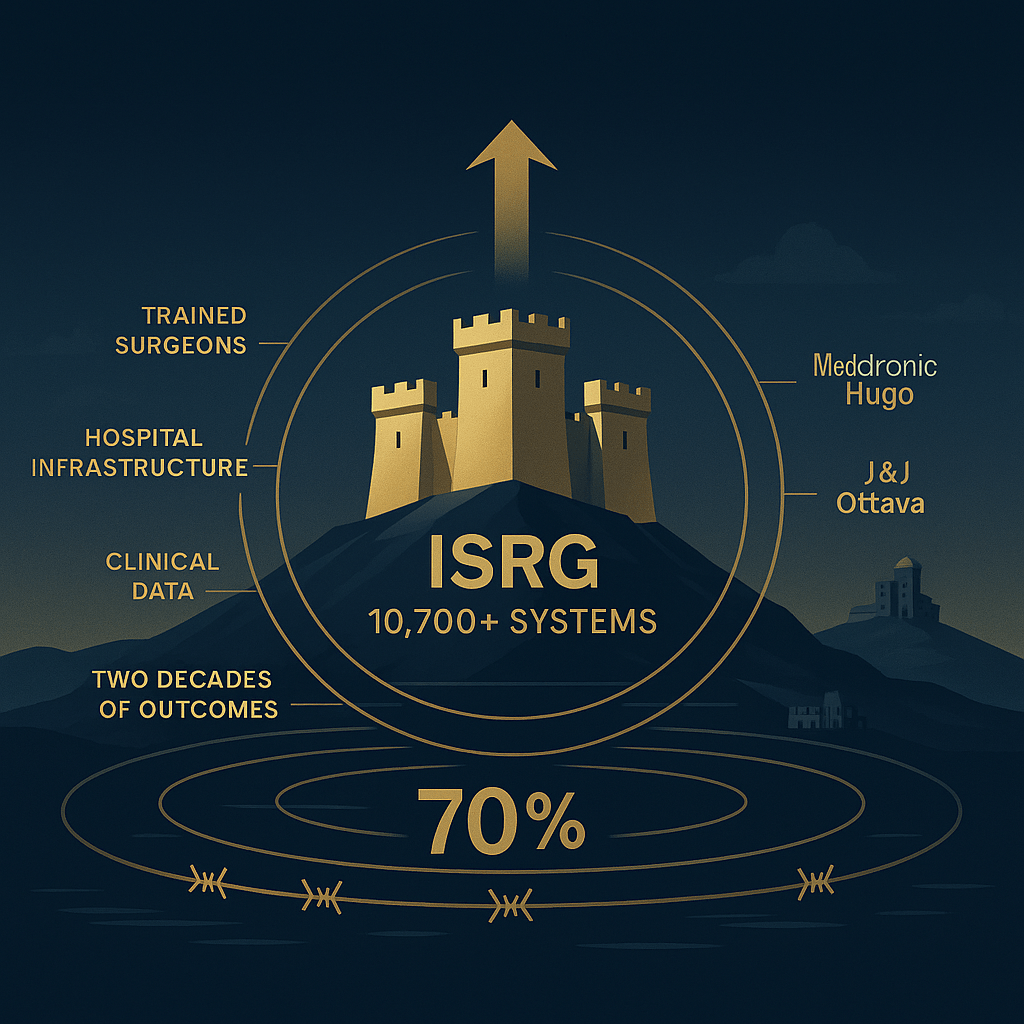
While Wall Street obsesses over which AI chip maker will win, Intuitive Surgical has already won its war. The company controls 70%+ of the global robotic surgery market with over 10,700 da Vinci systems installed worldwide – more than all competitors combined. Yet after a stunning 16% post-earnings surge to $516, competitors Medtronic and Johnson & Johnson are finally launching rival systems in 2025-2026. Is this dominance about to crack?
Our take: ISRG represents that rare combination of dominant market position, pristine balance sheet, and double-digit growth that typically doesn’t exist at this scale. The company generates 70% of revenue from recurring instruments and services – creating the kind of ecosystem lock-in Apple pioneered in consumer tech. However, at 55x earnings with formidable competition emerging, even excellence comes with execution risk. The question isn’t whether ISRG is great. It’s whether $516 pays you fairly for that greatness.
The Ecosystem That Surgeons Can’t Escape

Think of Intuitive Surgical as the Apple of operating rooms. They don’t just sell robots – they’ve built an entire ecosystem that surgeons can’t easily escape. Every da Vinci system represents a $1-2 million upfront sale, but the real magic happens afterward: disposable instruments for each procedure, annual service contracts, and continuous training programs create an annuity stream that compounds as the installed base grows.
The company operates 10,763 systems globally as of Q3 2025, generating $2.51 billion in quarterly revenue – a 23% year-over-year explosion. Procedure volumes grew 19%, with management raising full-year guidance to 17-17.5% growth. This isn’t speculative growth; these are actual surgeries being performed on real patients, each one requiring Intuitive’s proprietary instruments.
Here’s why the ecosystem matters: once a hospital invests millions in da Vinci infrastructure and trains its surgical staff, switching costs become astronomical. Surgeons spend years mastering the system, hospitals build entire robotic surgery programs around it, and patient outcomes data creates a two-decade track record competitors can’t replicate overnight. Just as Apple users stay in the ecosystem because of integrated devices, apps, and data, hospitals stay with ISRG because switching means rebuilding everything from scratch.
The Numbers That Separate Elite From Excellent
Intuitive Surgical’s Vulcan Score of 7.0/10 masks the extraordinary strength in specific pillars. Quality scores 9/10 (93/100 absolute), reflecting 70% gross margins, 30%+ operating margins, and a stunning 45% return on invested capital. These aren’t typical medtech metrics – they’re software-company economics wrapped in FDA-regulated precision.
The balance sheet provides fortress-level protection. Zero debt. $8.4 billion in cash. Current assets exceed total liabilities by 3.6x. This financial strength isn’t just defensive positioning – it’s offensive firepower for R&D ($200+ million quarterly), strategic acquisitions, and weathering any competitive assault without breaking stride.
Growth metrics justify the premium valuation. Revenue expanded 167% over five years despite operating at scale. Management guides toward sustained double-digit procedure growth through 2030, driven by expanding indications (colorectal, thoracic, head & neck surgery) and geographic penetration (especially Asia). The long-term EPS growth consensus of 15% annually reflects Wall Street’s belief that this isn’t a mature cash cow but an expanding empire.
Safety scores 8/10 despite high stock volatility, because the underlying business demonstrates remarkable resilience. During the 2020 pandemic when elective surgeries collapsed, Intuitive’s recurring revenue model cushioned the blow. The company never cut spending, never diluted shareholders, never compromised R&D. Beta of 1.2 means the stock amplifies market moves, but the business itself operates like a utility with growth characteristics.
The Q3 2025 Catalyst That Changed Everything
The October 2025 earnings release triggered a seismic revaluation. Intuitive didn’t just beat estimates – they demonstrated accelerating momentum across every business segment. Revenue of $2.51 billion crushed the $2.41 billion consensus. System placements of 427 units (up 12% year-over-year) included 240 units of the premium da Vinci 5 model, signaling successful product transitions.
Procedure growth of 19% exceeded the already-strong guidance, prompting management to raise full-year forecasts. Instrument and accessory revenue – the high-margin recurring component – grew in-line with procedures at 20%, confirming the ecosystem scales perfectly. Service revenue jumped 16%, reflecting the expanding installed base requiring maintenance.
The earnings surprise extended beyond top-line growth. Gross margins of 68% exceeded guidance, as manufacturing efficiencies and premium da Vinci 5 pricing offset tariff headwinds (estimated at only 70 basis points impact). Operating leverage drove net income up 24.6%, with earnings per share beating consensus by 30%.
Analyst reactions proved dramatic. BTIG Research raised their price target to $589, while the highest Wall Street target reached $700. The consensus shifted from cautious optimism to aggressive conviction, as the quarter demonstrated that competitive threats aren’t slowing Intuitive’s momentum. If anything, competition validates the massive market opportunity while Intuitive extends its lead.
Why the Ecosystem Advantage Actually Widens
Intuitive Surgical’s competitive edge isn’t static – it’s a compounding advantage that widens over time, just as Apple’s ecosystem became more valuable with each new user. Two decades of surgical data from millions of procedures create an AI training dataset competitors can’t replicate. The company captures video, instrument movements, and outcomes data from every surgery, feeding machine learning models that optimize techniques and predict complications.
The da Vinci 5 system incorporates these advances: enhanced 3D visualization, force feedback for surgeons, and 150 design improvements over previous generations. These aren’t incremental upgrades – they represent genuine innovation that extends the performance gap over rivals still struggling to reach parity with older da Vinci models.
The Ion endoluminal system exemplifies adjacency expansion within the ecosystem. This platform targets early lung cancer diagnosis, growing its installed base 30% year-over-year to 954 systems. While currently a small revenue contributor, Ion demonstrates Intuitive’s ability to leverage core competencies (miniaturization, precision control, integrated imaging) into new clinical applications. The runway includes cardiovascular procedures, neurosurgery, and microsurgical specialties where $10+ billion annual opportunity awaits.
Like Apple built the App Store to deepen iPhone lock-in, Intuitive built training programs, simulation platforms, and clinical support infrastructure that make the ecosystem indispensable. The switching costs aren’t just financial – they’re organizational, educational, and cultural. A hospital that spent 5+ years building a robotic surgery center of excellence won’t casually abandon that investment for an unproven alternative.
Risk Management: What Keeps Us Watching Closely
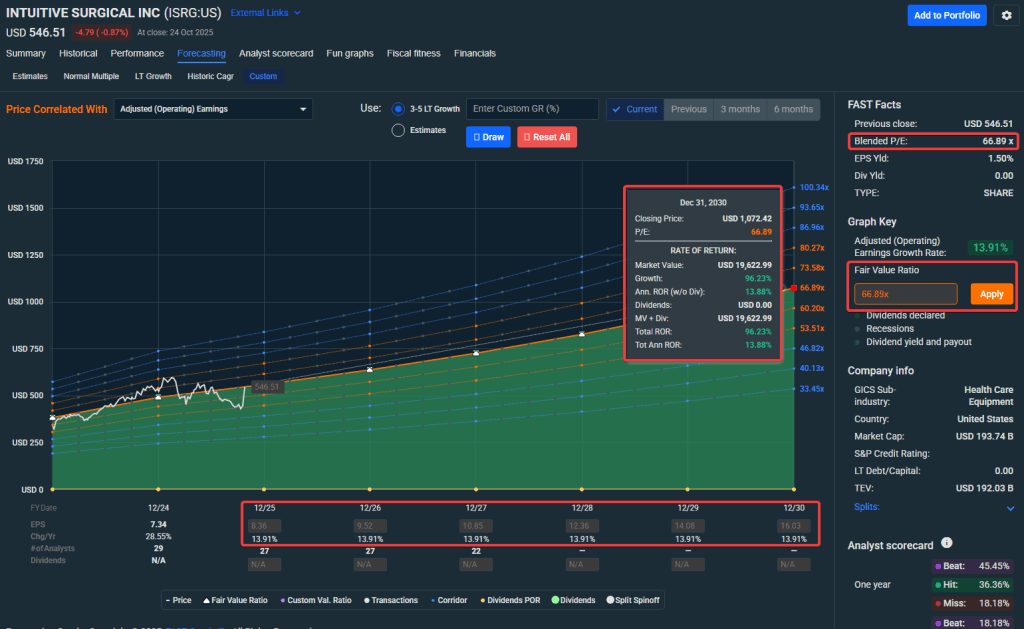
Valuation represents the primary investment risk. At 55x trailing earnings and 80x free cash flow, ISRG prices in flawless execution for years. The stock’s fair value estimate of $500 sits essentially at current levels ($516), leaving minimal margin for error. Any growth disappointment or competitive threat materialization could trigger 20-30% valuation compression as the premium multiple collapses.
Competition intensifies rapidly through 2025-2026. Medtronic’s Hugo system filed for FDA approval in April 2025, with clearance expected by year-end. Johnson & Johnson’s Ottava platform targets 2025 submission. These rivals bring enormous resources, established hospital relationships, and potentially lower pricing. While Intuitive’s lead remains commanding, market share erosion of even 5-10% would significantly impact growth assumptions baked into current valuation.
Capital spending cycles create cyclical risk. Hospital purchasing decisions compress during recessions, credit tightening, or reimbursement uncertainty. A $1.5 million system purchase can be deferred, even if existing robots continue generating procedure volumes. The 2020 experience showed system sales dropped 22% while procedure volumes fell only 6% – the installed base provides stability, but growth requires continuing capital deployment.
Execution risks around da Vinci 5 adoption deserve monitoring. Early uptake looks strong (240 of 427 Q3 placements), but sustained momentum requires delivering promised performance improvements. Manufacturing challenges, supply chain disruptions, or quality issues could stall the product cycle. The company’s strong balance sheet provides cushion, but execution must remain flawless to justify premium multiples.
Regulatory risks loom in healthcare. FDA scrutiny of surgical outcomes, Medicare reimbursement changes, or mandated price controls could impact economics. Internationally, health systems pushing back on premium pricing might slow geographic expansion. The company’s litigation history around servicing and instrument reuse shows ongoing legal friction with various stakeholders.
Technical Picture: Momentum Meets Key Resistance
ISRG’s chart reflects the transformation from consolidation to breakout. The stock trades decisively above all major moving averages: 50-day at $451, 100-day at $478, and 200-day at $484. This technical setup suggests the intermediate-term trend has turned constructively bullish after months of range-bound trading.
The post-earnings gap from $445 to $516 left minimal support between current levels and the breakout point. First meaningful support emerges around $500 (round number psychology and prior resistance), then $460-470 (20-day EMA cluster and volume profile). The gap itself around $445-455 represents strong support if tested, as buyers who missed the initial move would likely step in aggressively.
Resistance levels define upside potential. Immediate overhead appears at $530-540, marking a minor consolidation zone from May 2025. Major resistance sits at $565 (spring 2025 high) and psychological $600 (52-week high around $616). A sustained break above $600 would open technical runway toward $650-700 that bullish analysts now envision.
Momentum indicators show strength but not extreme conditions. RSI of 67 suggests healthy bullishness without overbought excess. STOCH at 73 similarly indicates strength with room for continuation. The MACD recently crossed bullish, confirming the trend change. Volume on the breakout day exceeded 8 million shares (versus 2 million average), validating institutional participation.
The volatility profile demands position sizing discipline. Annual volatility of 36% means 5-8% daily moves are statistically normal, not exceptional. Maximum historical drawdown of 40% from peaks shows how quickly sentiment can reverse. For context, ISRG dropped from $520 to $310 (-40%) during the 2022 bear market before recovering. Patient capital with multi-year horizons wins with this name.
Investment Strategy: Quality Deserves Patience
Our blended fair value estimate: $500 per share, synthesizing DCF analysis ($480-520 range) with relative valuation multiples. Current pricing at $516 reflects 3% premium to fair value – modest overvaluation but not extreme excess given momentum and raised guidance.
Buy zones provide tactical framework:
- Ultra-Value Buy below $360 (20%+ undervalued, rarely available)
- Strong Buy $360-440 (15%+ undervalued, attractive accumulation)
- Primary Buy $440-500 (near or below fair value, reasonable entry)
- Hold/Fair $500-565 (fairly valued, maintain positions)
- Trim $565-600 (modestly overvalued, take partial profits)
- Too Expensive above $600 (significantly overvalued without new catalysts)
Position sizing matters more than timing. The 20% maximum portfolio weighting reflects ISRG’s combination of quality (suitable for core holding) and valuation/volatility (requiring prudence). Most investors should treat this as a 10-15% position, scaling up only if purchased significantly below fair value.
Accumulation strategy works best for new positions. Rather than buying full exposure at $516, scale into the position over 6-12 months, targeting pullbacks toward $480-500. The stock will provide entry opportunities – it always does. Volatile names reward patience more than precision timing.
The 12-Month Outlook: Multiple Paths to Value
Base case (55% probability): +14% to $590
Da Vinci 5 adoption continues strong, procedure growth sustains 17%+, and competitive threats remain manageable. Valuation multiple holds steady as growth justifies premium pricing. This scenario aligns with analyst consensus and reflects continued ecosystem expansion.
Bull case (25% probability): +35% to $700
Competitive products face delays or underwhelm, allowing ISRG to extend market dominance. International expansion exceeds expectations, and margin improvements from manufacturing scale drive earnings beats. Premium valuation expands as the ecosystem story strengthens and investors recognize widening moat.
Bear case (20% probability): -20% to $410
Competition wins meaningful share, hospital capital spending contracts, or growth decelerates unexpectedly. Valuation multiple compresses toward 35-40x as investors reassess growth duration. Macro recession could accelerate this scenario by freezing hospital capital budgets.
Expected 12-month return: +8-12% with 65% probability of positive returns. Risk-adjusted return remains attractive given the quality profile, but not compelling enough to chase at current levels.
Why This Belongs in Long-Term Portfolios
Intuitive Surgical represents the intersection of demographic inevitability and technological superiority. Aging populations globally require more surgical procedures, while patients increasingly demand minimally invasive options. These secular tailwinds operate independent of economic cycles, providing revenue visibility rare in growth stocks.
The ecosystem deepens with scale rather than eroding, mirroring Apple’s experience. Every new hospital adoption strengthens the platform, every trained surgeon becomes an advocate, every procedure adds to the clinical database. Network effects in healthcare move slowly but prove remarkably durable once established.
The financial model generates extraordinary cash flow from installed base without requiring proportional capital reinvestment. Unlike SaaS companies that must constantly fight churn, hospitals can’t easily switch surgical robots. This creates compounding free cash flow that funds innovation, returns capital to shareholders, and maintains the moat.
However, valuation discipline remains essential. Quality companies at fair prices create wealth; quality companies at any price destroy wealth. ISRG at $360-440 represents generational opportunity. ISRG at $600+ represents speculation on perfection.
Bottom Line: Own the Ecosystem, Not the Hype
Intuitive Surgical has built what every tech company dreams of: an unassailable ecosystem where customers can’t leave, margins expand with scale, and competition actually validates the opportunity. This is Apple’s playbook applied to operating rooms, and it’s working even better than the original.
The stock trades at fair value after the Q3 surge. That’s not an invitation to chase – it’s a reminder that even the best businesses deserve patient capital. Set your alerts for $440-480. When the inevitable pullback arrives (and with 36% volatility, it will), buy with confidence. When the stock inevitably runs toward $600 (and with this quality, it will), trim without regret.
This is the type of generational business that rewards those who can withstand volatility while the ecosystem compounds. Twenty years from now, robotic surgery will be standard care globally. Intuitive Surgical will still be the name surgeons trust. The only question is whether you had the discipline to buy at the right price and the conviction to hold through the noise.
For those already positioned: hold confidently. For those on the sidelines: wait patiently. For those tempted to chase: remember that the best companies always give you a second chance. The ecosystem isn’t going anywhere. Your capital deserves to enter at the right price.
Master Metrics Table
| Metric | Value | Notes |
|---|---|---|
| Current Price | $516 | As of October 25, 2025 |
| Market Cap | ~$180B | Large-cap medical technology leader |
| Vulcan Score | 7.0/10 | Strong composite rating |
| Quality Score | 93/100 (9/10) | Elite business quality |
| Safety Score | 87/100 (8/10) | Low financial risk |
| Fair Value Estimate | ~$500 | Blended DCF/multiples approach |
| 12-Month Target | $590 | Base case scenario (+14%) |
| Revenue (Q3 2025) | $2.51B | +23% year-over-year |
| Revenue (TTM) | ~$9.5B | Approaching $10B milestone |
| Gross Margin | 68% | Best-in-class profitability |
| Operating Margin | ~30% | Strong pricing power |
| Net Margin | 17.4% | Expanding with scale |
| ROIC | ~45% | Exceptional capital efficiency |
| Current Ratio | 4.3 | Excellent liquidity |
| Debt/Equity | 0% | Zero debt, $8.4B cash |
| Interest Coverage | N/A | No debt to service |
| Cash Position | $8.4B | Fortress balance sheet |
| Free Cash Flow | ~$2.5B TTM | Strong cash generation |
| FCF Yield | ~1.4% | Low at current valuation |
| P/E Ratio (TTM) | ~55x | Premium valuation |
| Forward P/E | ~45-50x | Assumes continued growth |
| P/S Ratio | ~19x | High for medical devices |
| EV/EBITDA | ~41x | Elevated multiple |
| EV/FCF | ~80x | Prices in long-term growth |
| PEG Ratio | ~3.0 | Above market average |
| Beta (3-year) | 1.2 | Moderate volatility |
| Annual Volatility | 36% | Expect significant swings |
| Max Drawdown (1Y) | -15% | Recent range: $425-$616 |
| Procedure Growth (Q3) | +19% YoY | Core driver of revenue |
| System Placements (Q3) | 427 units | +12% year-over-year |
| Installed Base (da Vinci) | 10,763 systems | Global footprint |
| Installed Base (Ion) | 954 systems | +30% year-over-year |
| da Vinci 5 Systems (Q3) | 240 of 427 | Strong new product uptake |
| FY2025 Procedure Growth Guidance | 17-17.5% | Raised from 15-17% |
| Market Share | ~70% | Dominant position |
| Analyst Consensus Rating | Moderate Buy | 8 of 11 analysts bullish |
| Analyst Price Target | $589 average | Range: $408-$700 |
| Price vs. Target | -12% | Modest upside to consensus |
| Buy Zone – Strong Buy | Below $380 | 15%+ undervalued |
| Buy Zone – Primary | $380-500 | Near fair value |
| Hold Zone | $500-565 | Fairly valued |
| Trim Zone | $565-600 | Extended valuation |
| Too Expensive | Above $600 | Wait for pullback |
| Max Portfolio Weight | 15-20% | Quality warrants core holding |
| Risk Rating | Medium | High quality, premium valuation |


Leave a comment