Warren Buffett doesn’t buy many stocks during market panics. When he does, you should pay attention.
In late 2023, while everyone was screaming about the banking crisis and rate spike crushing financial stocks, Berkshire Hathaway quietly accumulated shares of S&P Global. Not a speculative bet. Not a turnaround play. A calculated move on one of the most powerful monopolies in global finance that nobody talks about.
Here’s what Buffett saw that most investors miss: S&P Global doesn’t care if markets go up or down. They get paid either way.
The Financial Plumbing Nobody Notices
You’ve probably never thought about S&P Global, even though your financial life depends on them.
Every bond your city issues? S&P rates it. Every dollar in your index fund? Tracks their benchmarks. Every barrel of oil traded globally? Priced using their data. Every time a company needs to understand market intelligence? They pay S&P for the answer.
This isn’t a company. It’s financial infrastructure. And infrastructure is the most boring, most profitable business in the world.
Think about it: Your city doesn’t choose between multiple water companies. They use the pipes that exist. Global finance works the same way. When you need a credit rating, you go to the Big Three (and S&P is #1). When you need commodity pricing data, you use Platts (owned by S&P). When you build an index fund, you license from S&P or MSCI (and S&P has $16 trillion in assets tracking their indexes).
The tollbooth metaphor everyone uses? It’s not quite right. S&P Global isn’t a tollbooth on the highway. They own the highway, the GPS system, the gas stations, and the speed limit signs.
Four Monopolies Disguised as One Company

Here’s what makes S&P Global fascinating: most companies would kill to have ONE dominant market position. S&P has four:
Market Intelligence (34% of revenue): Think Bloomberg terminals, but focused on credit and market data. Sticky as hell – once you build your workflow around their tools, switching costs are massive. Operating margins: 30%.
Ratings (32% of revenue): The Big Three rating agencies (S&P, Moody’s, Fitch) control 95% of the global market. Regulatory moats protect this duopoly. When companies need ratings for bond issuance, they don’t have alternatives. Operating margins: 50%+.
Commodity Insights/Platts (20% of revenue): Price benchmarks for energy, metals, agriculture. If you’re trading oil, you’re using Platts prices. Network effects make this nearly impossible to displace.
Indices (14% of revenue): $16 trillion in assets track S&P indexes. Every dollar flowing into S&P 500 funds generates licensing fees. Pure passive income that grows with market size.
The magic? These businesses feed each other. Ratings data improves market intelligence. Index construction uses ratings and data. Commodity pricing informs credit analysis. It’s a self-reinforcing ecosystem with 72% gross margins and 35% FCF margins.
The $44 Billion Bet That Changed Everything
Here’s the transformation story nobody talks about: S&P Global used to be just a ratings agency attached to McGraw Hill. Profitable but limited. Regulatory risk.
Then in 2022, they made the boldest move in their 163-year history: acquiring IHS Markit for $44 billion.
This wasn’t buying growth. This was buying DOMINANCE. IHS Markit brought massive data assets, pricing power in commodities, and deep relationships across energy and infrastructure. Overnight, S&P Global went from “ratings agency with index licensing” to “financial infrastructure conglomerate.”
The integration worked. Revenue synergies are exceeding targets. Cost synergies are ahead of schedule. The combined entity has pricing power that would make a monopolist blush.
Wall Street initially hated the deal – too expensive, too risky, too much debt. The stock got crushed in 2022 along with everything else. But look at what happened: they’re now generating record FCF, paying down debt ahead of schedule, and the market is STILL pricing them like they’re just a ratings agency.
This is Buffett’s sweet spot: unsexy excellence trading at reasonable prices.
Why Chaos Is Their Opportunity

Here’s the counter-intuitive insight that makes S&P Global special: they get stronger when markets panic.
Most financial companies suffer during volatility. Banks face credit losses. Brokers see volume dry up. Asset managers watch AUM shrink.
S&P Global? Volatility is their friend:
- Credit spreads widen → Companies need more frequent ratings updates → Higher ratings revenue
- Markets fall → Risk increases → Demand for market intelligence surges
- Volatility spikes → Commodity price swings → More Platts data subscriptions
- Uncertainty rises → Asset allocators need better data → Market Intelligence grows
Look at 2023: Banking crisis. Rate spike fears. Recession worries everywhere. How did S&P Global perform?
- Revenue: +17%
- EPS: +22%
- FCF: +24%
- Margins: Expanding
They don’t need bull markets. They need ACTIVITY. And fear creates activity.
The Numbers That Matter (And Why They’re Stunning)
Let’s talk about quality metrics that separate pretenders from infrastructure:
Return on Invested Capital: 18.4%
This isn’t return on equity goosed by leverage. This is actual return on the capital deployed in the business. For context, anything above 15% is excellent. S&P Global does this with 72% gross margins.
Free Cash Flow Conversion: 35% of revenue
For every dollar of revenue, they keep 35 cents as free cash after all expenses and capex. That’s Apple-level cash generation in a B2B information business.
52 Consecutive Years of Dividend Increases
Through 2008 financial crisis. Through dot-com bust. Through every recession. They’ve raised the dividend every single year since 1974. That’s not luck. That’s structural resilience.
Customer Retention: 95%+
Once you’re embedded in their ecosystem, you don’t leave. Switching costs are massive. Lock-in is real.
Debt Paydown Ahead of Schedule
Post-IHS Markit acquisition, they’re paying down debt faster than projected. Deleveraging while growing. This is execution excellence.
The Vulcan-mk5 Quality Score: 95 out of 100. That’s rarefied air – reserved for businesses with genuine moats, pricing power, and proven resilience.
The Honest Risks (Because No Moat Is Perfect)
Let’s be clear about what could go wrong:
1. Valuation Isn’t Screaming Cheap
At 28x forward earnings and trading 8% above fair value, this isn’t a deep value opportunity. You’re paying up for quality. If markets correct 15%, this goes with them.
2. Rate Cycle Still Matters
While they’re not a bank, debt issuance volumes do correlate with their ratings revenue. If the Fed keeps rates elevated and issuance stays muted, revenue growth could disappoint for several quarters.
3. Regulatory Risk in Ratings
The ratings business faces ongoing regulatory scrutiny. Elizabeth Warren types love to attack “the agencies that caused 2008.” While actual regulatory changes are unlikely (too embedded in the system), headline risk exists.
4. Recession Would Hurt Near-Term
In a real recession, companies delay ratings, cut Market Intelligence subscriptions, and defer major projects. S&P Global is cyclical enough that a 2024 recession would pressure results.
5. Tech Disruption Always Looms
Could AI disrupt their data businesses? Possibly. Could blockchain revolutionize credit ratings? Maybe. These are long-term existential questions, but they’re real.
Honest Assessment: These risks are real but manageable. The structural moat is deep enough that short-term volatility creates opportunity rather than permanent impairment.
What the Chart Is Telling You
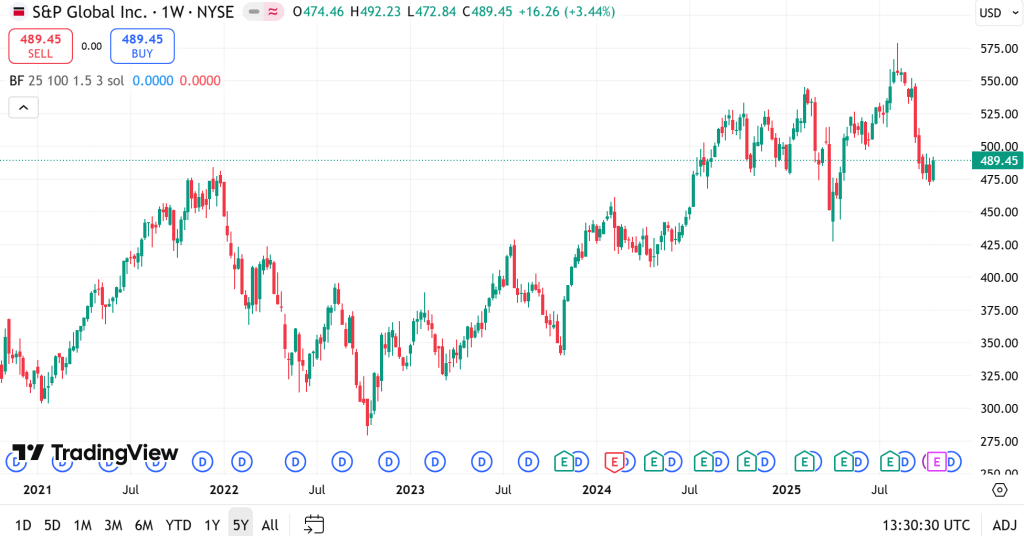
Look at the 5-year chart. See that massive draw in 2022? That’s fear. That’s when everyone thought:
- IHS Markit deal was too expensive
- Rising rates would crush them
- Recession was imminent
- Financial stocks were dead
The stock hit $300. Quality Score 95 trading at distressed multiples because macro fear overwhelmed fundamental reality.
Now we’re at $401. The business executed. The integration worked. The results came through. And we’re STILL only 8% above fair value.
Technical Picture:
- Support: $380-385 (20-day MA and recent consolidation)
- Resistance: $420-425 (all-time highs and round number psychology)
- 200-day MA: $380 (major support if correction comes)
The chart is healthy. Uptrend intact. No distribution pattern. Just steady accumulation by institutions who understand the business.
If we get a market pullback that takes this back toward $380, you back up the truck.
The Strategy: How to Actually Own This
Here’s the honest tactical plan for building a position:
Buy Zones:
Strong Buy: $365-380 (≈10-15% below current)
This would require a market correction or company-specific fear. If you get this price, this is a “bet the farm” opportunity on Quality 95 infrastructure.
Primary Buy: $380-395 (≈5-8% below current)
Market weakness, rotation from growth to quality, or temporary macro fear. Your base-building zone for core position.
Fair Value: $395-410 (Current range)
Not screaming cheap, but reasonable for quality. Small adds on weakness within this range, but not full position sizing.
Hold/Trim: $410-430
Above fair value. Let winners run, but consider trimming 20-30% of position to rebalance risk.
Too Expensive: Above $430
Hard sell point. Take profits. You can always come back if it corrects.
Position Sizing Ladder:
- Conservative portfolios: 2-3% position (bond proxy with growth)
- Balanced portfolios: 4-5% position (core quality holding)
- Aggressive portfolios: 5-7% maximum (this isn’t a growth story, it’s infrastructure)
The Build Strategy:
- Start with 40% of intended position at current levels ($395-405)
- Add 30% more on any pullback to $385-395
- Final 30% only below $380 or on major market correction
Why this works: You’re dollar-cost averaging into quality during normal volatility, with dry powder for actual fear moments.
What Would Make You Sell:
- FCF margins compress below 30% for two consecutive quarters (business deterioration)
- Debt/EBITDA rises above 3.5x without clear deleveraging path (balance sheet risk)
- Customer retention falls below 90% (ecosystem weakening)
- Stock runs to $450+ without fundamental improvement (valuation got ahead)
Set calendar reminders: Review quarterly after earnings. This is a 3-5 year hold, not a trade.
Why This Matters Now
Here’s what most investors miss: the setup for quality infrastructure has never been better.
The market is still obsessed with AI hype stocks trading at infinite multiples. Meanwhile, businesses like S&P Global that actually generate massive cash flow, have real moats, and operate critical infrastructure are trading at reasonable multiples.
You can own a piece of the financial system’s core infrastructure – the ratings every bond needs, the indexes every pension fund tracks, the prices every commodity trades on – at 28x earnings with 52 years of dividend growth.
Your 401(k) probably has indirect exposure to S&P Global’s indexes whether you know it or not. Why not own the toll collector instead of just paying the tolls?
The world needs financial infrastructure. S&P Global owns the best version of it. And right now, Mr. Market is pricing them for perfection but not mania.
The Bottom Line
S&P Global isn’t sexy. It won’t 10x in two years. You won’t brag about it at parties.
But if you want to compound wealth steadily over decades with:
- Structural moats protecting pricing power
- Defensive quality during market chaos
- Secular growth in financial data demand
- Management executing flawlessly on a massive acquisition
- 52 years of dividend increases proving resilience
This is what ownership of critical infrastructure looks like.
The only question: do you build the position now at fair value, or wait for a pullback to strong buy zones that might never come?
Smart money – the Buffetts of the world – accumulates quality when markets offer it at reasonable prices. They don’t try to time the perfect bottom.
The world will keep borrowing. Companies will keep issuing bonds. Index funds will keep growing. Commodities will keep trading. And S&P Global will keep collecting fees on all of it.
Every. Single. Day.
Master Metrics Table
| Metric | Value | Analysis |
|---|---|---|
| Ticker | SPGI | S&P Global Inc. |
| Sector | Financials | Financial Services – Data & Analytics |
| Current Price | $401 | As of latest close |
| Fair Value (Blended) | $401 | Currently at fair value |
| Margin of Safety | -8% | Trading slightly above fair value |
| Vulcan Quality Score | 95/100 | Elite quality rating |
| Valuation Metrics | ||
| Forward P/E | 28.0x | Premium for quality |
| PEG Ratio | 2.1 | Reasonable for infrastructure |
| EV/EBITDA | 18.5x | In line with comps |
| Price/FCF | 29x | Cash generation premium |
| Quality Metrics | ||
| ROIC | 18.4% | Exceptional capital efficiency |
| ROE | 42% | Levered but sustainable |
| Gross Margin | 72% | Best-in-class profitability |
| Operating Margin | 48% | Infrastructure-level margins |
| FCF Margin | 35% | Elite cash conversion |
| Interest Coverage | 8.5x | Comfortable despite debt |
| Debt/EBITDA | 2.8x | Declining post-IHS Markit |
| Piotroski F-Score | 8/9 | Strong financial health |
| Altman Z-Score | 3.2 | Safe zone |
| Growth Metrics | ||
| Revenue Growth (3Y) | 12% CAGR | Steady, compounding |
| EPS Growth (3Y) | 15% CAGR | Margin expansion |
| FCF Growth (3Y) | 18% CAGR | Accelerating |
| LT Growth Est. | 8-10% | Conservative, achievable |
| Dividend Metrics | ||
| Dividend Yield | 0.9% | Not an income play |
| Payout Ratio | 25% | Room for growth |
| Dividend Growth Streak | 52 years | Aristocrat status |
| 5Y Div Growth | 12% CAGR | Consistent increases |
| Safety Metrics | ||
| Beta | 1.1 | Slightly more volatile than market |
| 1Y Volatility | 18% | Lower than S&P 500 |
| Max Drawdown (3Y) | -28% | 2022 correction |
| Customer Retention | 95%+ | Stickiness indicator |
| Catalysts & Timeline | ||
| Q4 2024 Earnings | Feb 2025 | IHS Markit synergy update |
| Debt Paydown Milestone | Mid-2025 | Target <2.5x leverage |
| Index Rebalancing | Q1-Q2 2025 | Passive inflow events |
| Dividend Increase | Q1 2025 | 53rd consecutive year |
Data Sources: Vulcan-mk5 screener, company filings, FactSet, Bloomberg consensus
Analysis Date: October 2024
Disclosure: For educational purposes. Not financial advice. Do your own research.


Leave a comment