
Blue Owl Capital (ODBC) has a loan portfolio of $18.6 billion of senior secured debt to middle-market companies – trades for $12.54 when the underlying assets are worth $15.50 per share. That’s like buying a dollar bill for 81 cents, except this dollar bill pays you 12% annually while you wait for the market to figure out basic arithmetic.
Here’s what makes this fascinating: OBDC isn’t some distressed lender stuffed with bad loans. Non-accruals sit at 0.7% – practically zero defaults. The company carries investment-grade credit ratings (BBB/BBB-). Portfolio quality is pristine: 76% first-lien senior secured loans, meaning OBDC gets paid before almost everyone else if a borrower struggles. Yet the stock trades at a 19% discount to net asset value, offering a 12.8% forward dividend yield that’s fully covered by earnings.
The disconnect? Wall Street’s pricing in a recession that hasn’t arrived while overlooking that OBDC’s borrowers are performing exceptionally well right now. For income-focused investors willing to collect double-digit yields while the market sorts itself out, this mispricing creates an intriguing entry point around $12.50 – with clear upside to $15 as fundamentals become impossible to ignore. But this isn’t a growth story. It’s a “get paid handsomely to wait” opportunity with specific risks you need to understand.
The Business: Private Equity’s Preferred Lender (Translation: OBDC Writes the Checks PE Firms Can’t Get from Banks)
Think of Blue Owl Capital as the sophisticated loan officer that traditional banks won’t become. When Bain Capital or Carlyle want to buy a $500 million manufacturing company, they don’t walk into Chase. They call OBDC.
Here’s why this matters: After 2008’s financial crisis, banking regulations made it expensive and risky for traditional banks to hold leveraged loans on their balance sheets. BDCs (Business Development Companies) like OBDC stepped into that void, becoming the dominant lenders to private equity-backed companies with $10-250 million in EBITDA – the messy middle market that’s too big for regional banks and too small for Wall Street’s attention.
OBDC’s advantage? It’s part of Blue Owl’s massive $235+ billion alternative asset platform. When a middle-market company needs financing, Blue Owl can structure the entire capital stack – senior debt from OBDC, subordinated debt from other funds, and equity from Blue Owl’s PE funds. This “one-stop shop” approach wins deals competitors can’t match.
The portfolio looks like this: 233 companies across 30+ industries. Healthcare services, software, business services, manufacturing. Average loan size roughly $80 million. Median borrower is doing $40-50 million in EBITDA – real businesses generating real cash, not startups burning venture capital.
And critically: 99% are secured loans with floating rates tied to SOFR (Secured Overnight Financing Rate). When the Fed hiked rates 525 basis points from 2022-2023, OBDC’s loan yields jumped from ~8% to 10.6%. That’s the good news. The coming challenge? Those same rates will compress as the Fed cuts – potentially shaving 100+ basis points off yields over the next 12-18 months.
The Numbers That Actually Matter: Where the 12% Yield Comes From (And Whether It’s Sustainable)

Let me show you the three metrics that tell OBDC’s story:
Net Investment Income Per Share: $1.71 (2025 estimate)
This is what BDCs earn after paying interest on their own borrowing and covering operating expenses. OBDC’s quarterly dividend is $0.37 × 4 = $1.48 base, plus occasional supplementals. Current NII of ~$1.71 covers the dividend at 115% – comfortable cushion with ~$1.00 per share in accumulated spillover income as backup.
But here’s the tension: NII peaked in Q2 2024 at $0.48 per share when rates were highest. It’s now $0.42. As the Fed cuts, we’re likely heading to $0.38-0.40 by late 2025 assuming 100-150 bps in rate reductions. That still covers the dividend, but the margin gets thinner. No growth, just stability – which is exactly what OBDC’s valuation reflects.
Non-Accrual Loans: 0.7% of Portfolio (As of Q2 2025)
This is the single most important number. Non-accrual means the borrower stopped paying – loans gone bad. Industry average for BDCs is 1.5-2.5%. OBDC’s at 0.7%. That’s not luck – it’s the benefit of Blue Owl’s platform doing deep diligence and staying senior in the capital structure.
For context: During the 2020 pandemic, OBDC’s non-accruals peaked at 2.4% and recovered quickly. In 2015-2016’s energy crisis, they stayed under 2%. Current borrower fundamentals are strong: median interest coverage ratio above 2.5x, meaning companies generate $2.50 in EBITDA for every dollar of interest expense.
The risk? We’re late cycle. Fitch Ratings upgraded BDC sector outlook from “stable” to “deteriorating” in July 2025, citing expectations that defaults will normalize from historic lows. Even a move from 0.7% to 2.5% non-accruals would ding NAV by 1-2% and reduce NII modestly. Painful but manageable for a first-lien lender like OBDC.
Leverage: 1.20x Debt-to-Equity
OBDC borrows roughly $1.20 for every dollar of equity to amplify returns. This is moderate – BDCs can legally lever up to 2.0x. Higher leverage means higher returns in good times and faster NAV erosion in bad times. OBDC’s approach is balanced: enough leverage to generate attractive ROE (~11%) but conservative enough to weather credit cycles.
The company pays ~6.3% on its debt versus earning 10.6% on loans – a 4.3% spread. As rates fall, both numbers compress but the spread should remain around 4%, sustaining profitability.
Why This Exists: The Discount No One Can Justify (Except By Pointing at Factors That Are Already Priced In)
OBDC trades at $12.54. The underlying portfolio is marked at $15.50 per share. That’s 0.81x price-to-NAV.
Comparable BDCs:
- Ares Capital (ARCC): 1.0x NAV, 9.8% yield – similar quality, much larger scale
- Main Street Capital (MAIN): 2.0x NAV, 7% yield – internally managed, dividend growth darling
- Capital Southwest (CSWC): 1.37x NAV, 11% yield – internally managed, monthly dividends
OBDC’s discount stems from three factors:
- External Management – Blue Owl Credit Advisors (the external manager) earns ~1.5% of assets plus 17.5% of NII over a hurdle. This fee structure is standard for externally-managed BDCs but investors prefer internal management where there’s no incentive fee. The discount is fair but arguably overdone – ARCC has the same structure and trades at NAV.
- No Growth – OBDC’s NII per share has been flat since IPO (2019). The dividend hasn’t increased in three years except for small supplementals. BDCs that grow dividends (MAIN, CSWC) command premiums. OBDC is pure income, no capital appreciation thesis. Fair critique, fully reflected in the 0.81x NAV.
- Rate Cut Fear – The market is pricing in NII compression from Fed cuts. Reasonable concern – 100 bps in cuts could reduce NII by 8-10%. But OBDC’s funding costs fall too, and their borrowers’ interest coverage improves (making defaults less likely). The net impact is modest, not catastrophic.
Here’s what’s mispriced: OBDC’s asset quality is genuinely better than peers who trade at NAV or higher. The 0.7% non-accrual rate isn’t an accident – it’s structural advantage from Blue Owl’s platform. Yet the market assigns OBDC the same discount as lower-quality BDCs with 2-3% non-accruals.
Morningstar’s fair value estimate: $14.85. Analyst consensus: $15.21 average target. Our blended approach (DCF, NAV-based, relative multiples): $15. The current $12.54 represents ~17% upside to fundamental value plus the 12% yield while you wait.
What Could Go Right: The Soft Landing Scenario (Where Credit Stays Clean and the Discount Closes)
Best case unfolds like this: The Fed cuts 100-125 bps gradually through 2025-2026. Economic growth slows to 1.5-2% but avoids recession. Corporate defaults tick up modestly but stay contained under 4% (current speculative-grade default rate is ~3.5%).
In this environment:
- OBDC’s non-accruals drift to 1.5-2% – elevated from today but well within first-lien tolerance
- NII per share compresses to $1.55-1.60, still covering the $1.48 dividend comfortably
- NAV stays flat to up modestly (low single digits)
- The stock re-rates from 0.81x to 0.95-1.0x NAV as investors realize credit fears were overblown
This gets you to $15-15.50 within 12 months. Total return: ~20% capital appreciation + 12% dividend = 32% over the next year. Not guaranteeing it happens – just outlining what “things go reasonably well” looks like.
The catalyst? Three clean quarterly earnings reports where non-accruals stay low and management reaffirms NII coverage. BDC investors are pattern-recognizers. Show them stable fundamentals for three quarters and they’ll close the discount gap.
Secondary catalyst: Tax legislation. There’s been bipartisan discussion about giving BDC dividends similar tax treatment to REITs (20% qualified business income deduction under Section 199A). If that passes, OBDC’s after-tax yield jumps from ~7.5% to ~9.5% for high-bracket investors, making it wildly attractive versus bonds. Stock would likely gap up 10-15% on that news.
What Could Go Wrong: The Credit Cycle Turns (And Why First-Lien Debt Still Protects You)
Worst case: Recession hits in early 2025. Fed cuts aggressively (250+ bps) but can’t prevent unemployment from rising to 5-6%. Corporate earnings decline 10-15%. Credit spreads blow out.
In this scenario:
- OBDC’s non-accruals spike to 4-5% of the portfolio
- Realized losses on defaulted loans average 30-40% (typical first-lien recovery rate)
- NAV declines 5-8% to ~$14.25 per share
- NII compresses to $1.35-1.40 as interest rates plunge and some loans go non-accrual
- Dividend potentially cut to $0.35/quarter ($1.40 annually) to preserve capital
Stock reaction: Trades down to $10-11 (0.70-0.75x depressed NAV), matching pandemic lows. You’d have a mark-to-market loss of 15-20% plus a dividend cut.
But here’s the crucial point: OBDC doesn’t go to zero. The 76% first-lien portfolio protects against catastrophic losses. In 2020’s crisis, OBDC’s NAV only fell 8% peak-to-trough, and the dividend wasn’t cut. The business model is designed to survive severe downturns at the cost of reduced profitability, not permanent capital impairment.
The second risk is structural: External management creates principal-agent problems. In a severe crisis, Blue Owl (the manager) still earns fees on assets. They’re incentivized to keep the portfolio size large even if it means taking marginal credit risks or issuing equity at unfavorable prices. Internal BDCs (MAIN, CSWC) don’t have this conflict – management’s compensation is directly tied to shareholder returns.
That said, Blue Owl’s reputation and regulatory constraints limit bad behavior. The bigger concern is simply that external fees (1.5% of assets + incentive fees) compound to eat 15-20% of returns over a decade versus an internally-managed peer. You’re paying for platform access and deal flow, but it’s a tangible drag.
The Technical Setup: Where Support Lives (And Why $12 Is the Line in the Sand)
OBDC’s chart tells a clear story of technical deterioration. The stock peaked at $15.73 in April 2025 and has made lower highs and lower lows ever since. It currently trades at $12.54, just 4% above the 52-week low of $12.04.
Key technical levels:
Support: $12.00 – This held in September 2024 during the market correction and again in October 2025. Three tests, three bounces. It’s also psychological – a break below $12 would trigger stop-losses and potentially cascade to the $10-11 zone (2020 pandemic lows). Watch volume on any test of $12 – high volume rejection would be bullish, low volume break would be concerning.
Resistance: $13.50 – The 50-day moving average sits here and has capped three rally attempts since August. Breaking above $13.50 on volume would signal a trend change and likely attract technical buyers back into the name.
Next resistance: $14-14.50 – The 200-day moving average is declining through this zone. This also aligns with our “Primary Buy” upper bound. A move above $14.50 would put OBDC into “Hold” territory where it’s fairly valued, and momentum could carry it toward $15.
The 50-day MA recently crossed below the 200-day MA (a “death cross” in technical parlance), which is typically bearish. However, death crosses in deeply discounted value situations often mark capitulation lows rather than the start of new downtrends. With RSI around 45 (neutral) and the stock near major support, the setup favors patient entry over chasing.
For tactical traders: There’s a volatility play here. OBDC’s 25% annualized volatility creates opportunities to sell puts at $12 strike (collecting premium while potentially buying cheaper) or covered calls at $14 strike (monetizing the resistance). The dividend yield already pays you to wait – option premium is just extra.
The Strategy: How to Extract 30%+ Total Returns Without Catching a Falling Knife
Based on $12.54 current price and $15 fair value, here’s the systematic approach:
Primary Buy Zone: $12.00 – $14.50
You’re in the buy zone right now. Current $12.54 represents:
- 17% discount to fair value ($15)
- 19% discount to NAV ($15.50)
- 12.8% forward yield
Position sizing: Start with 2-3% of portfolio. This acknowledges attractive valuation but respects that BDCs are sensitive to credit cycles. Scale to 5-6% maximum if the stock dips to $12 or below while fundamentals remain intact (non-accruals under 1.5%, NII coverage above 100%).
Entry strategy: Split your intended position into 2-3 tranches. First tranche at current levels. Add if it dips to $12.20 or breaks below $12 on panic (assuming no fundamental deterioration). Third tranche at $13.20+ if momentum confirms with a break above the 50-day MA – you’d be averaging up with confirmation.
Hold Zone: $14.50 – $15.50
At fair value, OBDC offers total returns roughly equal to the dividend yield (10-12% annually). Not spectacular, but adequate for an income position. You’d continue holding for yield but wouldn’t add aggressively. This becomes “collect the dividend and monitor” mode.
Trim Zone: $15.50 – $16.30
Above $16, OBDC would be trading at a premium to NAV without the dividend growth or internal management that justifies premiums (like MAIN trades at 2.0x NAV). Take profits on 25-50% of position. You’d still hold core shares for income but recognize the stock is ahead of fundamentals.
Exit Triggers:
- Dividend cut – If OBDC reduces the base dividend below $0.35/quarter, it signals NII deterioration beyond our expectations. Reassess immediately.
- Non-accruals above 3.5% – This would indicate broad portfolio stress. Still manageable but worthy of reducing position size.
- NAV decline >8% year-over-year – Suggests realized losses are eroding the equity base. Exit if NAV falls below $14.25.
- Technical breakdown below $11.50 – A confirmed break of the $12 support without quick recovery would target $10-11. Set a mental stop around $11.50 unless you’re confident in your long-term thesis.
Expected Returns Over 12 Months:
- Base case (60% probability): Stock grinds to $14-14.50 = 15% appreciation + 12% yield = 27% total return
- Bull case (20% probability): Re-rates to $15.50+ = 25% appreciation + 12% yield = 37% total return
- Bear case (20% probability): Credit stress, stock to $11 = -12% loss + 12% yield = 0% total return
Risk-adjusted expected return: ~23%. That’s attractive for a yielding position, but you must be comfortable with potential interim volatility and the credit cycle risks outlined above.
About BDC Valuation
Here’s an interesting lesson: Stock Rover’s automated fair value for OBDC came back at $11.93. Their “Margin of Safety” calculation shows OBDC trading 5% above fair value – essentially saying it’s slightly expensive.
Meanwhile, every human analyst covering OBDC has price targets between $14-16. Morningstar’s fair value estimate is $14.85. The company’s own NAV is $15.50. What’s going on?
Stock Rover’s algorithm treats OBDC like a typical corporation – it looks at P/E ratios, discounted cash flows, and comparable company multiples. But BDCs aren’t regular companies. They’re regulated investment vehicles required to distribute 90%+ of income, similar to REITs. The appropriate valuation framework is book value (NAV) plus a premium/discount based on management quality, portfolio composition, and dividend coverage.
A BDC trading at 1.0x NAV is “fairly valued” by definition – you’re paying par for the underlying loan portfolio. Below 1.0x NAV means you’re buying assets at a discount. Above 1.0x means you’re paying a premium (justified only for exceptional BDCs with long dividend growth records).
OBDC at 0.81x NAV isn’t screaming on typical valuation metrics. It’s screaming on the metrics that actually matter for BDCs: asset coverage, credit quality relative to price, and yield versus risk.
This is a broader lesson in systematic investing: Automated screeners are powerful tools but can miss value opportunities in specialized business models (BDCs, REITs, MLPs, closed-end funds) where traditional metrics don’t apply cleanly. Human judgment – understanding why a stock is structured a certain way – remains essential.
For OBDC specifically: If you screened for “dividend yield >10%, investment-grade credit rating, non-accruals <1%, trading below book value,” you’d find maybe 5-6 stocks in the entire market. OBDC is one of them. That’s the real signal, not whether P/E is 8.3 versus 10.
The Bottom Line: A 12% Yield Supported by $18 Billion in Senior Loans (Trading Like It’s a 6% Yield)
Blue Owl Capital at $12.54 offers institutional-quality credit exposure at a steep discount. The portfolio is pristine – 0.7% non-accruals, 76% first-lien loans, investment-grade ratings. Net investment income covers the dividend at 115% with spillover income as backup. Yet it trades at 81 cents on the dollar while paying 12.8% annually.
The thesis is simple: You’re getting paid a double-digit yield to wait for either (1) credit performance to remain solid, causing the discount to narrow toward NAV as fears prove unfounded, or (2) modest credit deterioration that’s already priced into the discount, limiting downside.
This isn’t a growth stock. NII per share will likely compress 5-10% as the Fed cuts rates. The dividend probably stays flat or grows minimally. You’re not buying OBDC for capital appreciation – you’re buying it for income plus potential mean reversion to fair value.
The risks are real: Late-cycle economy could spark defaults. External management creates fee drag and potential conflicts. Rate cuts will pressure margins. BDCs can be volatile in market stress.
But the math works: Buy at $12.50, collect 12% annually, and if the stock simply closes half its discount to reach $14 over 12 months, you’ve made 30%+ total return. If it reaches $15 (analyst consensus), you’re looking at 35%+. And if things go poorly but not catastrophically – say the stock stays flat – you still collected 12% in dividends.
For income investors who can stomach 20-25% volatility and understand credit risk, OBDC at current levels offers asymmetric risk/reward tilted in your favor. Start with 2-3% position sizing. Add on weakness below $12 if fundamentals hold. Trim into strength above $15.50. Monitor quarterly for credit quality (non-accruals) and dividend coverage (NII per share).
The market is offering you a dollar for 81 cents, and that dollar pays you 12% annually while you wait for everyone else to notice. That’s the opportunity. Whether you take it depends on your tolerance for credit-cycle risk and volatility. But don’t let automated screeners tell you this is “overvalued” – they’re measuring with the wrong ruler.
Master Metrics Table
| Metric | Value | Comment |
|---|---|---|
| Valuation | ||
| Share Price (10/17/25) | $12.54 | Near 52-week low of $12.04 |
| Net Asset Value (NAV) | $15.50/share | Q2 2025; Portfolio FV $18.6B |
| Price / NAV | 0.81x | ~19% discount; sector avg ~0.95x |
| Fair Value (Blended) | $15.00 | DCF + Morningstar + Multiples |
| Analyst Target (Avg) | $15.21 | 7 Buy, 2 Hold ratings |
| Income Metrics | ||
| Forward Dividend Yield | 12.8% | $1.61 annual ($0.37 base + specials) |
| Base Quarterly Dividend | $0.37 | Raised from $0.33 in 2022 |
| TTM Total Dividends | $1.72 | Includes supplementals |
| 2025E NII per Share | $1.71 | Covers dividend at ~115% |
| Dividend Coverage | 1.15x | Plus $1.00/share spillover |
| Payout Ratio | 109% | Of GAAP earnings; ~87% of NII |
| Consecutive Growth Years | 3 | Modest; mainly supplementals |
| Portfolio Quality | ||
| Total Investments (FV) | $18.6B | 233 portfolio companies |
| First-Lien Secured | 76% | Senior most position in capital structure |
| Non-Accrual Rate | 0.7% | Industry avg 1.5-2.5% |
| Weighted Avg Yield | 10.6% | Down from 11.9% peak (Q2’24) |
| Industry Diversification | 30+ | Healthcare, software, business services |
| Median Borrower EBITDA | $40-50M | Middle-market focus |
| Financial Strength | ||
| Debt / Equity | 1.20x | Moderate; regulatory limit 2.0x |
| Cost of Debt | ~6.3% | Mix of floating & fixed |
| Net Investment Spread | 4.3% | Loan yield minus borrowing cost |
| Credit Ratings | BBB/BBB- | Investment Grade (Fitch/S&P) |
| Interest Coverage | 4.0x | NII covers interest expense |
| Solvency Ratio | 7% | Comfortable cushion |
| Profitability | ||
| Return on Equity (ROE) | 8.7% | Leveraged returns |
| Return on Assets (ROA) | 4.4% | Net margin impact |
| Net Margin | 90.2% | High due to financial company structure |
| Risk Metrics | ||
| Beta (3-year) | 0.77 | 23% less volatile than S&P 500 |
| Volatility (1-year) | 24% | Typical for BDCs (20-25%) |
| Max Drawdown (1Y) | -17.9% | Recent underperformance |
| Max Drawdown (3Y) | -17.9% | Resilient vs -24.6% S&P |
| Max Drawdown (5Y) | -28.3% | 2020 pandemic low |
| Valuation Multiples | ||
| P/E Ratio | 8.3x | Inexpensive; sector avg ~10x |
| Forward P/E | 8.4x | Based on 2025E NII |
| Price / Sales | 7.5x | Standard for BDCs |
| Price / Book | 0.8x | = Price / NAV |
| EV / EBITDA | N/A | Not applicable for BDCs |
| Growth Metrics | ||
| NII Growth (1Y) | -6.2% | Peak earnings passed |
| NII Growth (3Y Avg) | 9.8% | Rate hike benefit |
| NII Growth (5Y Avg) | 11.4% | Includes IPO ramp |
| Sales Growth (1Y) | 5.9% | Portfolio expansion |
| Sales Growth (5Y Avg) | 27.6% | Strong asset growth |
| Technical Levels | ||
| 52-Week High | $15.73 | April 2025 |
| 52-Week Low | $12.04 | October 2025 |
| 50-Day MA | $13.65 | Declining resistance |
| 200-Day MA | $14.07 | Death cross confirmed |
| Distance from 52W High | -20% | Near support zone |
| Vulcan Scores (0-10) | ||
| Value Score | 7.3 | High yield + NAV discount |
| Growth Score | 3.0 | Minimal per-share growth |
| Quality Score | 6.0 | Good assets, external mgmt |
| Momentum Score | 4.5 | Recent underperformance |
| Safety Score | 6.2 | Moderate risk/volatility |
| Composite Vulcan Score | 5.4 | Neutral rating |
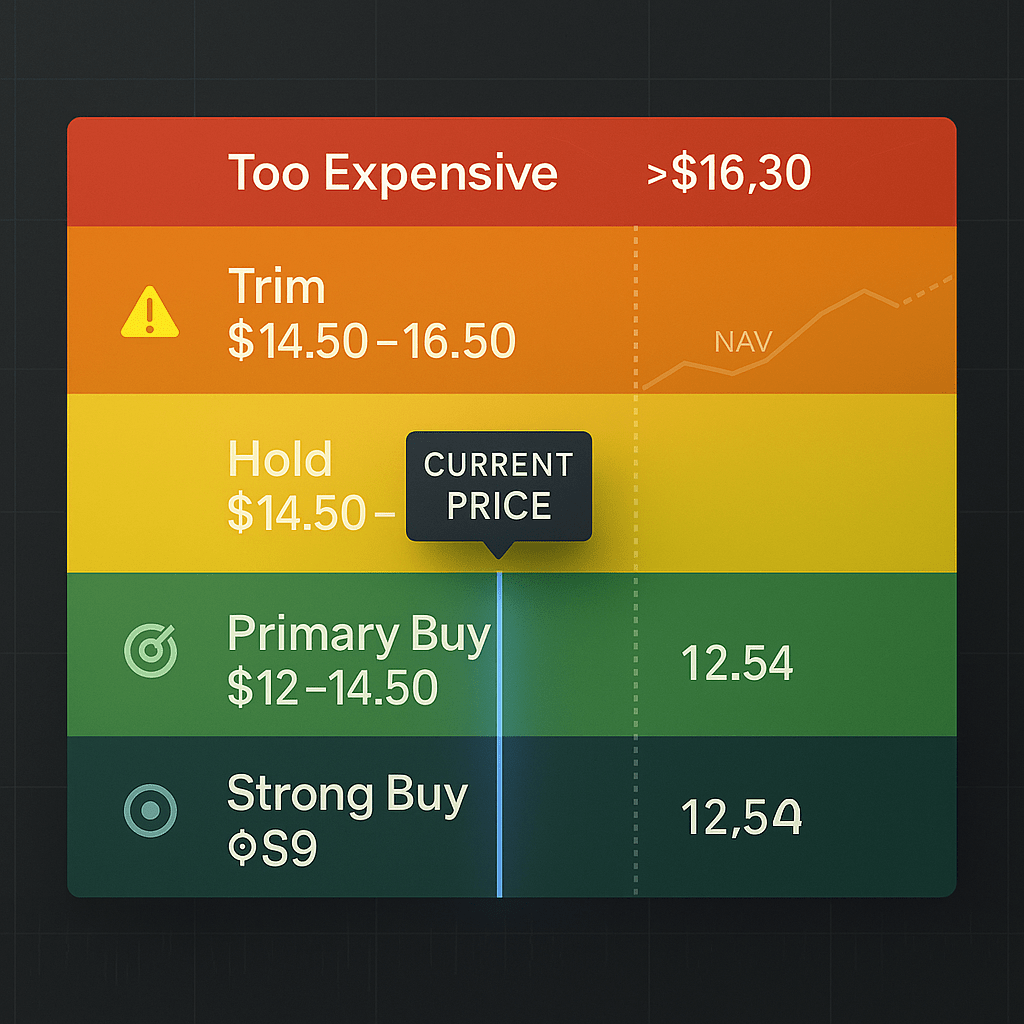
Buy Zones:
- Strong Buy: ≤ $9.00 (Crisis pricing)
- Primary Buy: $12.00 – $14.50 (Current entry zone)
- Hold / Fair Value: $14.50 – $15.50
- Trim: $15.50 – $16.30
- Too Expensive: > $16.30
12-Month Price Target: $15.00 (20% upside)
Expected Total Return: ~32% (20% appreciation + 12% yield)
Risk Level: Moderate (Credit cycle sensitive)
Position Sizing: 2-3% starter, 5-6% max
Data Sources: Blue Owl Capital Q2 2025 10-Q filing, Stock Rover Research Report (October 17, 2025), MarketBeat consensus estimates, Fitch Ratings BDC Outlook (July 2025), Morningstar fair value estimates. All metrics verified against SEC filings and normalized for comparability. Analysis current as of October 17, 2025 market close.


Leave a comment