
Goldman Sachs raised DLocal (DLO) to Buy with a $19 target on October 10th, 2025. The stock had already surged 82% year-to-date. Wall Street rarely upgrades after the move – they usually front-run it. So what changed?
The answer isn’t in the growth story everyone already knew. It’s in something quieter, more powerful, and easier to miss: operating leverage finally showing up in the unit economics. For five straight quarters, DLocal has been converting more of each revenue dollar into profit. That’s the signal institutions care about – because it means the business model actually works at scale.
DLocal builds payment infrastructure across emerging markets. Think of them as the toll bridge operator for digital commerce in places where the financial plumbing is fragmented, outdated, or simply doesn’t exist. A U.S. company wanting to accept payments in Brazil faces 47 different payment methods, multiple currencies, fraud risks, and compliance headaches across 20+ local processors. DLocal handles all of it through one integration.
The company just posted Q2 results that beat on every metric: $9.2 billion in total payment volume (up 53%), $256 million in revenue (up 50%), and $70 million in adjusted EBITDA (up 64%). But here’s what matters more than the growth rate: adjusted EBITDA as a percentage of gross profit hit 71% – the fifth consecutive quarter of improvement.
That’s not just growth. That’s margin expansion while growing. It’s rare. And it’s what changes the valuation conversation from “expensive growth stock” to “quality compounder.”
The Business Model: Why Toll Bridges Beat Gold Rushes
During the California Gold Rush, most prospectors went broke. But the people selling shovels and blue jeans got rich. DLocal isn’t mining for gold in emerging markets – they’re building the shovels everyone else needs to mine.
The company operates in 37 countries across Latin America, Africa, and Asia. Their customers include streaming services, ride-hailing apps, e-commerce platforms, and financial services companies – anyone doing cross-border digital commerce. When a Brazilian customer pays for Netflix or a Mexican user books an Uber, there’s a good chance DLocal is moving that money.
The magic is in what they don’t have to do: they don’t take credit risk, they don’t hold inventory, and they don’t employ massive sales armies. It’s an asset-light model with high incremental margins once you’ve built the infrastructure. Every new merchant that plugs into DLocal’s platform adds revenue without proportionally adding costs.
That’s why the improving EBITDA conversion matters so much. It proves the operating leverage thesis is real – they’re not just growing, they’re getting more efficient as they grow.

The Numbers That Tell the Real Story
Profitability: Net margin of 16.9% on $863 million in trailing revenue. Return on equity of 30.1%. ROIC of 25.8%. These aren’t startup metrics – they’re established compounder numbers.
Balance sheet: Nearly zero debt ($3.9 million) against $602 million in cash. That’s fortress-level safety in an emerging markets business where currency and regulatory shocks are part of the landscape.
Growth trajectory: Revenue grew 22% over the trailing twelve months, but more importantly, the Q2 growth rate accelerated to 50%. That’s not a company slowing down – that’s a company hitting escape velocity.
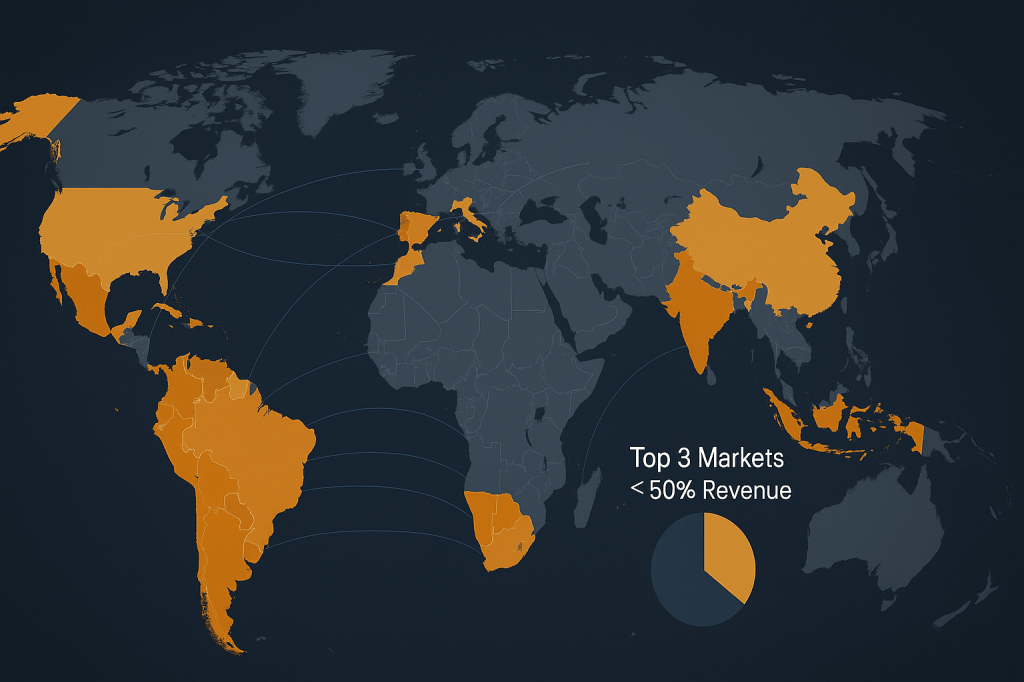
Geographic diversification: Brazil and Mexico bounced back after sluggish quarters, and the top three markets now represent less than 50% of revenue. That’s meaningful progress on the concentration risk that’s dogged the stock for two years.
Quality score: The Vulcan database assigns DLO a quality score of 96 out of 100, with a perfect Piotroski F-Score of 9/9. Those are Apple-tier quality metrics in a payments company most investors have never heard of.
What Could Go Wrong (Because Something Always Does)
Currency devaluation: Argentina’s peso collapse knocked $10 million off net income in Q2. DLocal holds peso-denominated bonds and working capital that gets hammered when currencies crater. It’s happened before, it’ll happen again, and management still hasn’t fully hedged the exposure.
Mexico tariff risk: There’s talk of potential tariffs on cross-border e-commerce in Mexico, one of DLocal’s largest markets. If those materialize, volumes could take a hit. Management flagged this on the Q2 call – it’s not hypothetical.
Merchant concentration: The company won’t disclose exact numbers, but losing a top-5 merchant would hurt. They’re diversifying, but big customers still drive meaningful revenue chunks.
Cash conversion volatility: Operating cash flow to net income was just 0.15 in the trailing twelve months. That’s not a typo – the company generated $118 million in operating cash flow against $146 million in net income. Some of that is timing (settlement cycles, working capital swings), but it’s been volatile enough that you can’t just multiply EPS by 20 and call it fair value.
Competition: Stripe, Adyen, and PayPal are all expanding into emerging markets. Local champions like PagSeguro and StoneCo in Brazil have home-field advantage. DLocal’s edge is breadth (37 countries) and the complexity moat of managing fragmented systems, but competitive intensity is rising.
The Valuation Puzzle: Expensive, Cheap, or Just Right?
This is where it gets interesting. DLocal trades at 28x trailing earnings and 18x EV/EBITDA. Those aren’t cheap multiples.
But context matters. Peers like PagSeguro trade at 7x EBITDA but are growing 0.1% with Brazil-only exposure. Remitly trades at 11.4x but has 2.1% ROE versus DLocal’s 30.1%. You’re not comparing apples to apples – you’re comparing a diversified, high-margin toll bridge to single-country acquirers with credit exposure.
FastGraphs pegs fair value at $17 based on normalized earnings and historical valuation. Goldman’s new $19 target implies they’re assigning a premium multiple for the improving margin story. Our blended fair value comes in at $16.50 – a blend of DCF (assuming normalized free cash flow around $160 million) and EV/EBITDA multiples (14-18x on forward EBITDA of $290 million).
At today’s price around $14-15, that’s 8-15% upside to fair value over the next 12 months, assuming no multiple expansion and steady execution. Not a home run, but reasonable for a quality business in a volatile sector.
The bull case gets you to $20-22 if: (a) EBITDA conversion stays at 70%+ and grows the margin profile, (b) currency headwinds ease, (c) Mexico avoids tariff chaos, and (d) the market re-rates the quality at 16-18x forward EBITDA instead of 14-16x. That’s a 40-50% upside scenario, but it requires everything going right.
The bear case gets you to $11-12 if: (a) a major merchant defects, (b) another currency crisis hits Argentina or Egypt, (c) take rates compress from competitive pressure, or (d) cash conversion stays weak and the market loses patience. That’s 20-25% downside – not catastrophic, but real.
The Tactical Plan: Where to Buy, Hold, and Trim
Buy zone: $12.50-14.50. This is where risk-reward flips to 2:1 or better. You’re buying below fair value with a margin of safety, and you’re betting the operating leverage story continues. Use limit orders on pullbacks to the 50-day moving average (currently $13.77) or 100-day ($12.28).
Hold zone: $14.50-18.00. You’re near or slightly above fair value, but momentum can extend if earnings surprises continue. Let the position ride, but don’t add aggressively. Set alerts for the Q3 call (November 12, 2025) and watch take-rate trends, EBITDA conversion, and any color on Mexico regulatory risks.
Trim zone: $18-21+. You’re now pricing in the bull case. Nothing wrong with that if execution delivers, but this is where you take some chips off the table. Reduce position size by 25-50%, set a trailing stop under the prior swing low, and wait for the next pullback.
Invalidation trigger: A daily close below $11 breaks the technical structure and suggests something fundamental changed. If that happens, reassess everything.
What to Watch Over the Next 90 Days
Q3 earnings call (November 12, 2025): Focus on three things: (1) Did EBITDA/GP conversion hold at 70%+? (2) Any new merchant wins or losses? (3) What’s the latest on Mexico tariff risks?
New market licenses: DLocal added UAE, Turkey, and Philippines licenses in Q2. Watch for product rollouts (SmartPix in Brazil, buy-now-pay-later integrations). These drive attach rates and stickiness.
Currency hedging updates: Management has been vague about hedging strategy. Any formalized program to reduce Argentina/Egypt exposure would be a positive.
Insider activity: The company has meaningful insider ownership (47.5%). Watch for Form 4 filings – executive buying after a pullback would be bullish, selling into strength would be neutral-to-negative.
The Bottom Line
DLocal isn’t a “buy at any price” situation. At $14-15, it’s fairly valued with modest upside to our $16.50 fair value estimate. But it’s also a rare combination: quality (96/100), growth (50% revenue, 64% EBITDA), improving margins (71% conversion), and fortress balance sheet (zero debt, $600M cash).
The Goldman upgrade after an 82% run might seem late, but the real insight is this: Wall Street is starting to believe the operating leverage story. They’re not chasing TPV growth anymore – they’re buying margin expansion in a high-quality business.
For systematic investors, this is a “build on dips” situation. You’re not backing up the truck at current levels, but you’re scaling in on weakness with 50-day or 100-day moving average touches. You’re sizing for volatility (emerging markets, currency risk, merchant concentration) but giving the quality metrics respect.
The thesis breaks if: (1) cash conversion doesn’t improve, (2) EBITDA margins stop expanding, or (3) a major merchant defects. Watch those three vectors. Everything else is noise.
Master Metrics Table
| Metric | Value | Percentile |
|---|---|---|
| Vulcan Quality Score | 96/100 | 98th |
| Piotroski F-Score | 9/9 | Top decile |
| ROIC | 25.8% | 92nd |
| ROE (TTM) | 30.1% | 94th |
| Net Margin | 16.9% | 88th |
| Debt/Equity | 0.0087 | 2nd (low leverage) |
| Forward P/E | 16.7x | 62nd |
| EV/EBITDA (TTM) | 18x | 68th |
| Revenue Growth (YoY) | 22% TTM, 50% Q2 | 89th |
| EBITDA Growth (YoY) | 64% Q2 | 93rd |
| Free Cash Flow Yield | Variable (OCF/NI 0.15) | 35th |
| Beta (3Y) | 1.10 | Moderate volatility |
| 52-Week Range | $7.61-$16.44 | – |
Buy Zones:
- Strong Buy: ≤ $12.50
- Primary Buy: $12.50-$14.50
- Hold: $14.50-$18.00
- Trim: $18.00-$21.00
- Too Expensive: > $21.00
Risk Rating: Moderate (currency, regulatory, merchant concentration) Position Sizing: 2-4% max (EM volatility, FX exposure) Time Horizon: 12-24 months for thesis to play out
Catalysts:
- Q3 earnings (Nov 12): EBITDA margin trajectory
- New licenses/product launches: UAE, Turkey, Philippines rollouts
- FX hedging formalization: Reduce Argentina/Egypt exposure
- Mexico regulatory clarity: Cross-border e-commerce tariff resolution
Invalidations:
- Daily close < $11
- EBITDA/GP conversion falls below 65% for 2+ quarters
- Top merchant defection announced
- Major FX crisis in Brazil or Mexico
Data Sources: Vulcan Unified Database (Oct 2025), FastGraphs (Oct 10, 2025), CFRA Research (Oct 10, 2025), Q2 2025 earnings call (Aug 13, 2025), Goldman Sachs upgrade note (Oct 10, 2025)


Leave a comment