TTM Technologies manufactures the printed circuit boards that connect every radar system, satellite, and AI data center backplane. The company just posted its best quarter in years—21% revenue growth, record non-GAAP earnings, and operating margins finally breaking into double digits. The stock has responded accordingly, ripping 230% over the past year to $60.
But here’s the contradiction: beneath the momentum story sits a low-return cyclical manufacturer with 5.2% return on invested capital, collapsing free cash flow, and a five-year track record that includes four years of revenue decline. The recent improvement is real. The valuation assumes it’s permanent.
The Investment Case: Early Turnaround, Not Quality Compounder
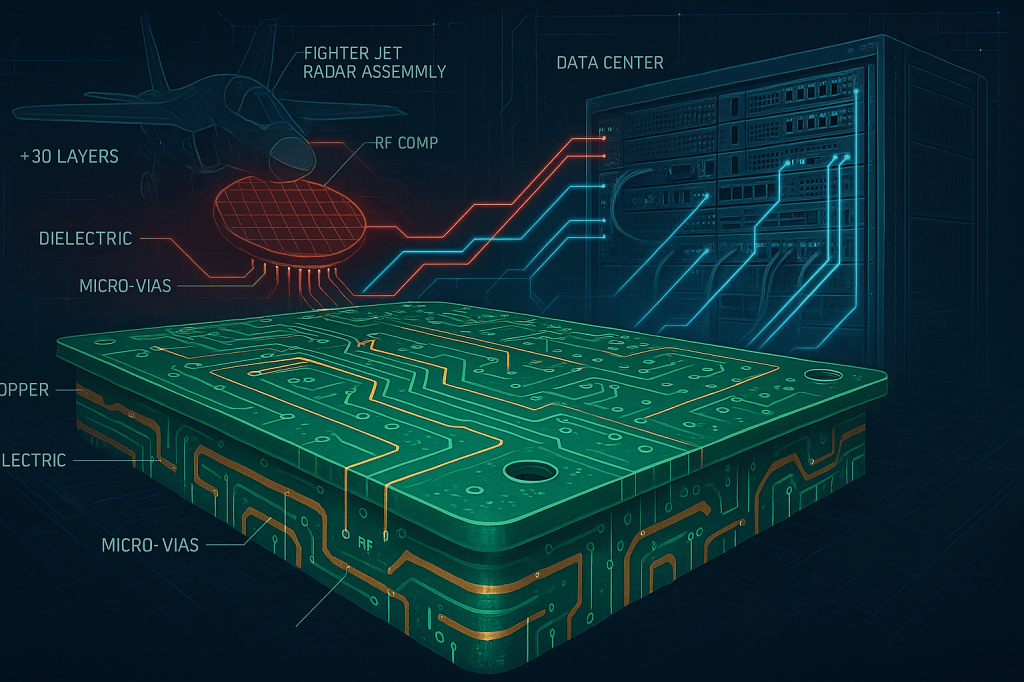
TTMI sits at the intersection of two powerful secular themes—defense modernization and AI infrastructure buildout. The company manufactures advanced PCBs and RF components for applications where failure isn’t an option: F-35 radar systems, satellite communications, electronic warfare equipment, and hyperscale networking gear supporting AI clusters.
The bull case centers on cyclical recovery amplified by favorable mix shift. After years of restructuring and margin compression, the business is finally gaining traction. Aerospace and Defense now represents 45% of revenue (up from 38% two years ago) with 21% year-over-year growth. These programs carry better margins and multi-year visibility once qualified. Simultaneously, AI-driven demand for high-layer-count networking boards and data center backplanes is creating a second growth vector.
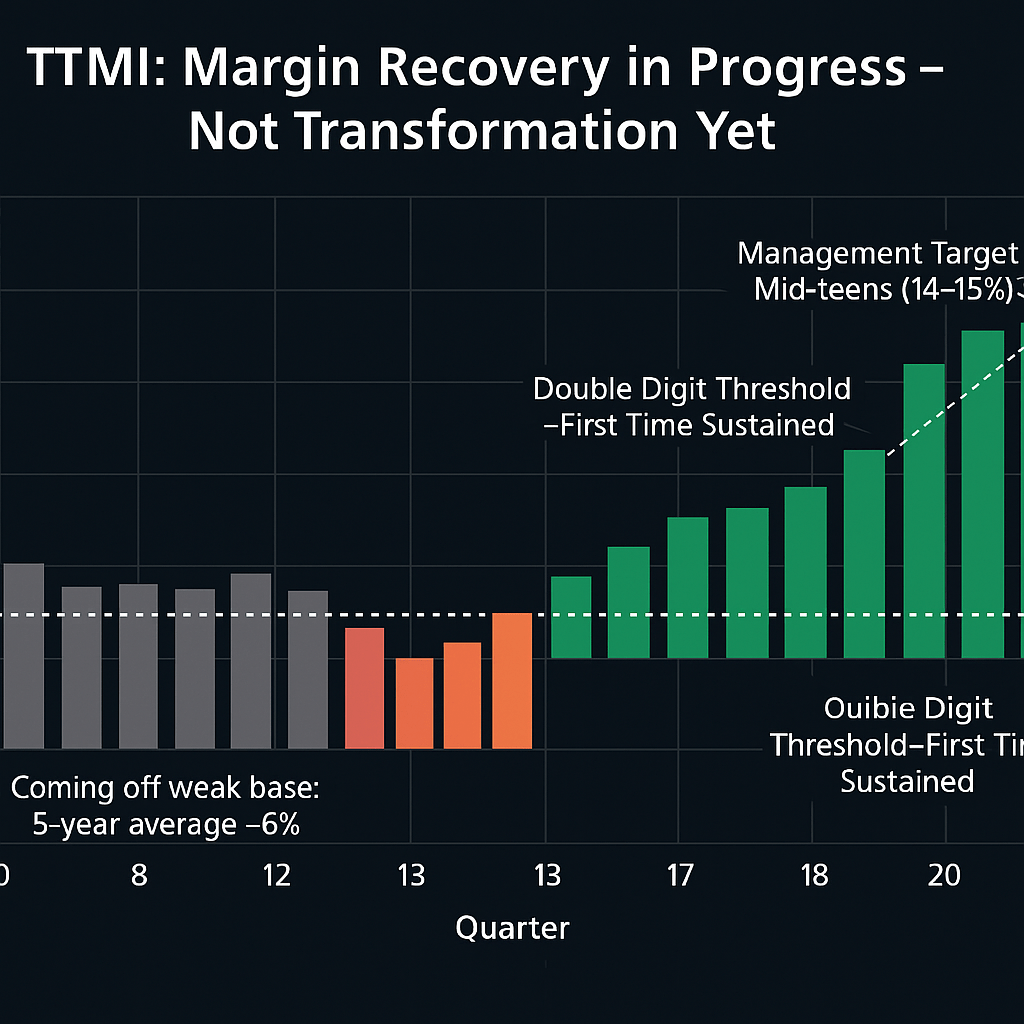
Operating margins hit 11.1% in Q2 2025, the fourth consecutive quarter above 10%, versus a five-year average around 6%. Management targets mid-teens operating margins at scale. If the company can sustain current momentum and reach 12-13% margins by late 2026, EPS could approach $2.80-3.00 versus current consensus of $2.40-2.60.
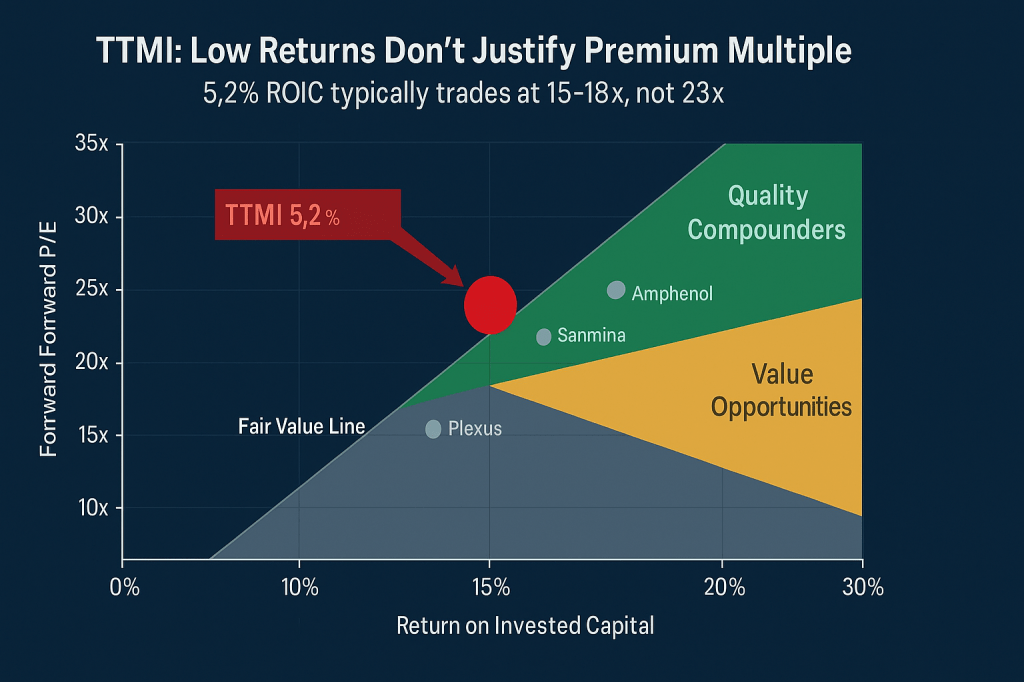
The bear case is harder to dismiss: valuation disconnected from business fundamentals. At $60 and 25x forward earnings, TTMI trades like a high-return growth compounder. But the underlying business generates 5.2% ROIC and 5.7% ROE—barely adequate returns for a manufacturer. Free cash flow per share dropped 65% from $0.49 to $0.17 over the trailing twelve months despite revenue growth, indicating working capital consumption and capex intensity are overwhelming cash generation. The five-year revenue CAGR is -0.2%, with four years of negative growth.
This isn’t Amphenol or TE Connectivity. This is a cyclical manufacturer in the early innings of a turnaround. The quarterly improvements are encouraging, but the historical track record and current returns-on-capital suggest this remains a show-me story.
What TTMI Actually Does (And Why It’s Hard)
TTMI manufactures the infrastructure layer between semiconductor chips and finished systems. Think of advanced PCBs as the “plumbing” that routes signals, power, and data between components. For high-reliability applications, this isn’t simple—it requires 30-40 layer stackups, controlled impedance at microwave frequencies, tight registration tolerances, and military-grade testing.
Here’s what makes this difficult: An AESA radar for an F-35 requires RF boards with precise dielectric constants across temperature extremes, signal integrity measured in picoseconds, and zero-defect manufacturing because field failures are catastrophic. Similarly, a 1.6 terabit networking switch backplane for an AI data center requires hundreds of differential pairs with matched impedances, loss budgets that can’t exceed fractions of a decibel, and thermal management for hundreds of watts of power dissipation.
TTMI competes for these programs by qualifying designs, investing in process capability, and then manufacturing at volume. Once qualified, customer switching costs are high—redesigning and requalifying a complex PCB can take 18-24 months. That stickiness is valuable, but it takes years to build.
The company operates in two segments: PCB (82% of revenue) handles everything from commercial quick-turn prototypes to complex aerospace boards. RF & Specialty Components (18%) produces ceramic RF components, filters, and integrated microwave assemblies primarily for defense applications.
The Numbers That Tell the Real Story
Q2 2025 showed legitimate improvement: Revenue of $731 million beat estimates by 9% and grew 21% year-over-year. Non-GAAP EPS of $0.58 exceeded guidance and marked a quarterly record. Operating margin of 11.1% expanded 210 basis points year-over-year. Cash flow from operations was $98 million (13.4% of revenue). By any quarterly measure, this was strong execution.
But the trailing twelve-month picture is more sobering: Operating margin TTM is 8.1%, not 11.1%. Net margin is 3.5%. Return on invested capital is 5.2%—barely above most companies’ weighted average cost of capital. Return on equity is 5.7%, bottom-quartile for publicly traded manufacturers. Free cash flow per share collapsed from $0.49 a year ago to $0.17 TTM, down 65% despite revenue growth.
Historical context matters: Five-year revenue CAGR is -0.2%, with negative growth in four of the last five years. This isn’t a growth story that hit a bump—this is a cyclical business that contracted through the 2020-2023 period and is now recovering.
Balance sheet provides cushion: Cash of $448 million, net leverage of 1.2x EBITDA, current ratio of 2.0, and Altman Z-Score of 3.5 indicate financial stability. The company isn’t distressed. But financial health doesn’t justify a 25x forward multiple when the business generates 5% returns on capital.
Valuation is the core problem: At $60, TTMI trades at 67.6x trailing P/E (distorted by prior-year charges) and 23.2x forward P/E on $2.60 consensus estimates. EV/EBITDA is 21.5x. Price-to-sales is 2.4x. These are premium multiples for a manufacturer. Stock Rover’s quantitative scores tell the story: Value Score 59 (below-average), Quality Score 60 (mediocre), Growth Score 75 (solid given recent momentum).
Why Now? The Catalysts (And Why They’re Already Priced)
Defense program acceleration through 2026: Multi-year defense spending supports radar, EW, and satellite programs. TTMI’s backlog of $497 million and book-to-bill ratios above 1.0x suggest sustained demand. Key programs include F-35 production, next-generation satellite constellations, and naval electronics modernization.
AI networking infrastructure boom: Hyperscale data centers require massive networking fabric—switches, optical transceivers, and backplanes with extreme layer counts and signal integrity requirements. Management explicitly cited generative AI as the driver behind 52% year-over-year growth in networking and 20% growth in data center computing.
Margin expansion still in progress: Four consecutive quarters above 10% operating margin demonstrate execution consistency. Management’s mid-teens target implies another 300-400 basis points of improvement. If achieved, this would add $0.40-0.50 to annual EPS power.
The problem: these catalysts are well-known and already embedded in the $60 stock price. The market is pricing TTMI as if the turnaround is complete and sustainable. That’s the bet—and it requires perfect execution for multiple years.
The Honest Risks (Why This Isn’t a Core Holding)
Low returns on capital limit valuation justification: ROIC of 5.2% and ROE of 5.7% don’t support premium multiples. Even with margin expansion to 12-13%, ROIC might reach 8-9%—still mediocre for a manufacturer. Unless the business model fundamentally changes, mid-cycle fair value likely caps around 15-18x earnings, not 25x.
Free cash flow deterioration despite revenue growth: FCF per share dropping 65% while revenue grows 12% signals working capital consumption, capex intensity, or both. If the company can’t convert margin improvement into cash generation, the investment thesis weakens materially.
Program concentration and timing variance: A handful of large defense programs drive quarterly results. Delays in F-35 production, satellite program slippages, or electronic warfare budget reallocation can swing revenue and absorption immediately. Commercial markets are equally lumpy—networking and data center sales fluctuate with hyperscaler capex cycles.
Cyclical history argues for valuation discipline: Four years of negative revenue growth (2020-2023) demonstrate this business is cyclical, not secular. The current recovery could be early-to-mid cycle, but paying 25x forward at mid-cycle is dangerous. When the cycle turns, multiples compress fast.
Three explicit warnings from Stock Rover: (1) Short interest at 5.8% of float—sophisticated investors betting against the stock. (2) GAAP earnings ($0.40) below pro-forma earnings ($0.52)—accounting quality concerns. (3) Multiple years of historical revenue decline—this is a turnaround, not an established grower.
Valuation: What’s Fair vs. What’s Priced
DCF analysis points to $38-40 fair value: Using a five-year free cash flow model with 6% revenue CAGR (management’s mid-term guide), operating margins ramping from 8% to 12%, normalized tax rate of 21%, and WACC of 9.5% with 3% terminal growth, enterprise value calculates to approximately $4.6 billion. Subtracting net debt and dividing by 104 million diluted shares yields $38 per share.
Stock Rover’s fair value estimate is $39.71, using a similar discounted cash flow approach. Blending these methodologies produces a $40 fair value estimate.
At the current price of $60, TTMI trades 50% above fair value. The market is discounting either (1) faster margin expansion than modeled, (2) sustained double-digit EPS growth for multiple years, or (3) a terminal multiple well above mid-cycle norms.
Cross-check with multiples: TTMI trades at 23.2x forward earnings versus peer group averages around 18-22x. Sanmina trades at 25x with similar revenue but better returns (11% ROIC). Plexus trades at 25.1x with 80/100 quality score versus TTMI’s 60/100. The current multiple isn’t absurd relative to peers, but peers may also be overvalued. More importantly, TTMI’s below-average returns don’t justify peer-group multiples.
Scenario analysis:
- Bull case ($72-80): Defense and AI networking both accelerate. Operating margins reach 14% by 2026. Market sustains 25-28x forward multiple on $2.80-3.00 EPS. Probability: 20%
- Base case ($48-56): Solid execution continues. Margins reach 11-12%. Multiple compresses to 18-20x on $2.60-2.80 EPS as growth normalizes. Probability: 50%
- Bear case ($35-42): Program delays or commercial digestion. Margins plateau at 9-10%. Multiple compresses to 15x on $2.30-2.50 EPS. Probability: 30%
Expected value: ~$52, implying 13% downside from current levels before any time value or optionality considerations.
Buy Zones and Position Sizing: Discipline Required

Using fair value of $40 and Medium uncertainty classification (cyclical but established franchise), buy zones are:
Strong Buy: ≤ $34
Primary Buy: $34-42
Hold: $42-52
Trim: $52-58
Too Expensive: > $58
Current price of $60 places TTMI firmly in “Too Expensive” territory. The recommendation is Hold existing positions / Trim on further strength / Do not initiate new positions.
For disciplined accumulation, wait for pullback to $34-42 Primary Buy zone. This would require a 30-35% correction from current levels—painful but not unprecedented for cyclical manufacturers when sentiment shifts or a quarterly miss occurs.
Position sizing discipline if entering in Primary Buy zone:
- Start with 1-2% portfolio weight
- Scale to 3-4% only after two consecutive quarters of positive EPS revisions AND gross margin expansion of 100+ basis points year-over-year
- Maximum position size 4% given quality profile and cyclical risks
- This is a tactical/opportunistic position, not a core long-term holding
Invalidation triggers for any position:
- Book-to-bill falls below 1.0x for two consecutive quarters with margin compression
- Key defense programs experience multi-quarter delays
- Free cash flow remains negative or deteriorating for three consecutive quarters
- Stock breaks decisively below 50-day moving average (currently ~$52-53) on heavy volume following disappointing earnings
Why Own This—If You Can Get the Price Right
TTMI is improving. The mix shift toward aerospace, defense, and AI networking is real. The margin expansion is tangible—four quarters above 10% operating margin after years in the mid-single digits. The balance sheet provides financial flexibility. Management is competent and executing the turnaround playbook methodically.
But improvement doesn’t equal quality. ROIC of 5.2% is barely adequate. ROE of 5.7% is bottom-quartile. Four years of negative revenue growth demonstrate cyclicality, not secular growth. Free cash flow collapsing despite revenue growth raises questions about the sustainability of earnings quality.
At $60 and 25x forward earnings, the market is pricing TTMI as if the turnaround is complete and the business has transformed into a high-return, sustainable grower. That’s possible but not probable. More likely: this is a cyclical manufacturer in the early-to-mid phase of recovery, deserving of a 15-18x mid-cycle multiple on $2.50-2.80 of normalized earnings. That math points to $38-48 fair value, not $60.
The smart play is tactical patience: acknowledge the business is improving, respect the execution, but refuse to chase momentum at premium valuations. When the inevitable pullback comes—either through time (sideways consolidation) or price (20-30% correction on any stumble)—that’s when you build a position in the $34-42 zone with disciplined sizing and clear invalidation rules.
Final Recommendation
Rating: Hold existing / Trim above $60 / Wait for Primary Buy $34-42
Fair Value: $40
Current Price: $60 (50% overvalued)
12-month expected return: -5% to +10% (wide range reflects momentum vs. mean reversion tension)
Position sizing if entering: 1-2% starter in Primary Buy zone; max 4% core after execution confirmation
Risk profile: Cyclical turnaround with improving fundamentals but low returns-on-capital and extended valuation
This is a show-me story, not a buy-and-hold compounder. Price discipline separates opportunity from speculation.
Master Metrics Table
| Metric | Value | Source / Notes |
|---|---|---|
| Current Price | $60.28 | Oct 2, 2025 (SR report date) |
| 52-Week Range | $15.77 – $60.10 | Near all-time high |
| Market Cap | $6.23 billion | ~103M shares outstanding |
| Revenue (TTM) | $2.647 billion | Up 12.1% year-over-year |
| Revenue (Q2 2025) | $731 million | Beat by 9%, up 21% YoY |
| Gross Margin (TTM) | 20.2% | Improving from 16-17% range |
| Operating Margin (TTM) | 8.1% | Q2 hit 11.1%, improving trend |
| Net Margin (TTM) | 3.5% | Low for manufacturer |
| EPS (TTM GAAP) | $0.89 | Trailing basis |
| EPS (Q2 non-GAAP) | $0.58 | Quarterly record |
| Forward EPS (2025E) | $2.31 | Current year estimate |
| Forward EPS (2026E) | $2.60 | Next year estimate |
| P/E (TTM) | 67.6x | Not meaningful due to prior charges |
| P/E (Forward 2025) | 26.1x | On $2.31 current year |
| P/E (Forward 2026) | 23.2x | On $2.60 next year |
| EV/EBITDA (TTM) | 21.5x | Premium to historical mid-cycle |
| Price/Sales | 2.4x | Above historical range |
| Price/Book | 3.8x | Moderate premium |
| Price/Tangible Book | 7.9x | Elevated |
| ROE (TTM) | 5.7% | Bottom-quartile for manufacturers |
| ROIC (TTM) | 5.2% | Barely covers cost of capital |
| Return on Assets | 2.7% | Low capital efficiency |
| Current Ratio | 2.0 | Adequate liquidity |
| Quick Ratio | 1.7 | Solid short-term position |
| Debt/Equity | 0.6x | Moderate leverage |
| Net Debt | ~$580 million | Net leverage 1.2x EBITDA |
| Interest Coverage | 3.8x | Adequate but not strong |
| Altman Z-Score | 3.5 | Safe zone (>2.6) |
| Piotroski F-Score | 8 | Strong (out of 9) |
| Free Cash Flow (TTM) | $18 million | Down from $51M year ago |
| FCF Per Share (TTM) | $0.17 | Down 65% from $0.49 |
| Operating Cash Flow (Q2) | $98 million | 13.4% of revenue |
| Capex (TTM) | $221 million | 8.3% of sales, elevated |
| Backlog | $497 million | Book-to-bill >1.0x |
| Beta (1-year) | 1.56 | High volatility vs. market |
| Volatility (1-year) | 50% | Elevated risk |
| Short Interest | 5.8% of float | Bearish positioning |
| Analyst Consensus | Buy (3 Strong Buy, 1 Buy, 1 Hold) | Positive but not unanimous |
| Average Price Target | $60.18 | Stock at consensus |
| Target Range | $55 – $68 | Limited upside to high target |
| Stock Rover Fair Value | $39.71 | DCF-based |
| Vulcan DCF Fair Value | $38.20 | Internal model |
| Blended Fair Value | $40.00 | Used for buy zones |
| Margin of Safety | -34% | Currently overvalued |
| Stock Rover Value Score | 59/100 | Below average |
| Stock Rover Quality Score | 60/100 | Mediocre |
| Stock Rover Growth Score | 75/100 | Solid momentum |
| Stock Rover Sentiment Score | 89/100 | Strong technical |
| Sales Growth (1Y) | 12.1% | Recovering |
| Sales Growth (3Y avg) | 2.2% | Weak historical |
| Sales Growth (5Y avg) | -0.2% | Negative CAGR |
| EPS Growth (1Y) | 34.8% | Off low base |
| Earnings Surprise (Last 12Q) | 10 positive, 1 negative, 1 in-line | Consistent beats |
| Estimate Revisions (90 days) | +7.1% current year, +8.9% next year | Positive momentum |


Leave a comment