Price: $21.04 | What It’s Worth: $14.50-$18.00 | Our Call: HOLD | September 30, 2025
The AI Marketing Revolution You’re Already Living
Every time Netflix suggests the perfect show, Amazon recommends exactly what you need, or that email promotion arrives the moment you’re thinking about buying—that’s Zeta Global’s technology at work.
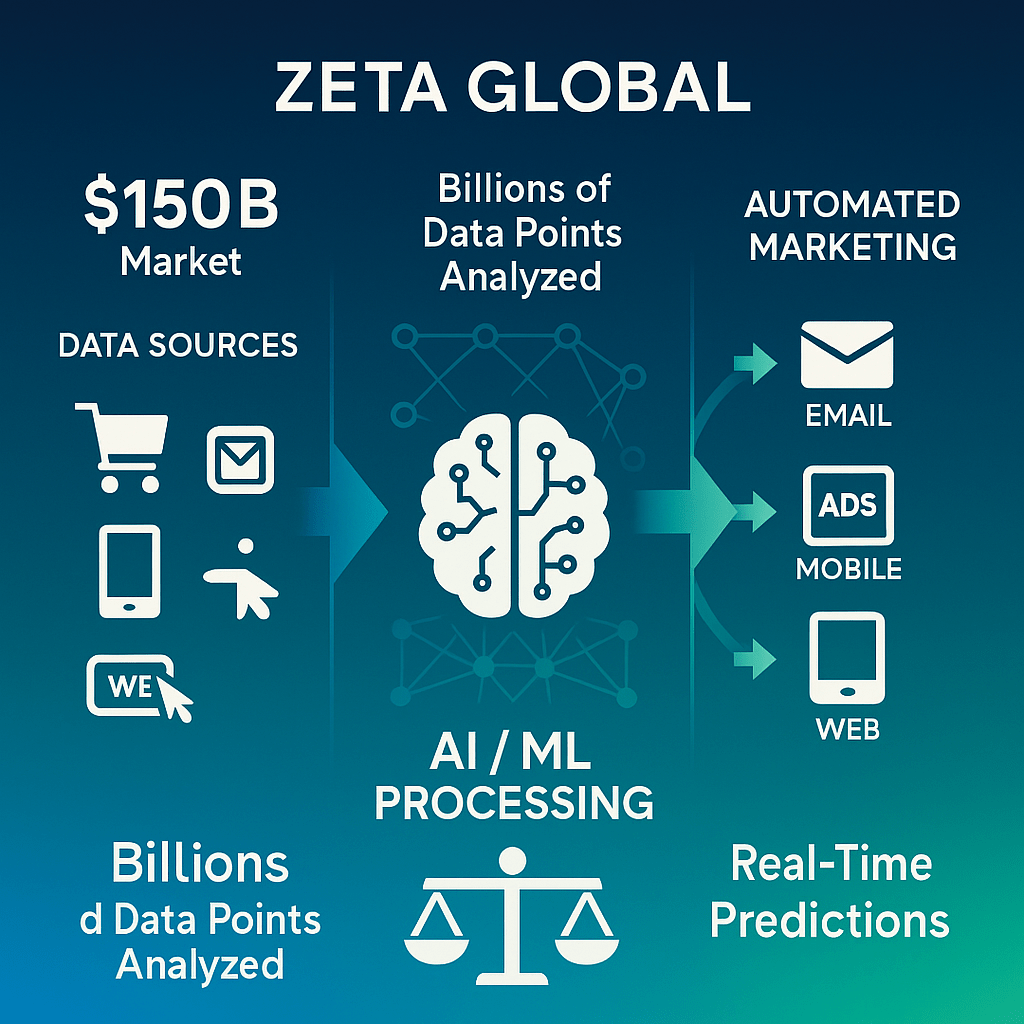
The company dominates a $150 billion market most investors don’t even know exists: using AI to make marketing actually relevant instead of annoying. While everyone obsesses over ChatGPT and image generators, Zeta quietly powers the marketing engines for insurance giants, financial services firms, and Fortune 500 companies you interact with daily.
Here’s the tension: Zeta just crushed Q2 earnings with 35% revenue growth, raised guidance, announced a $200M buyback, and delivered free cash flow that turned decisively positive. Wall Street handed out 8 Strong Buy ratings. The AI marketing platform is working exactly as promised.
So what’s the problem? At $21.04, you’re paying $1.17 to $1.45 for every dollar of estimated value. We ran four different valuation models—every single one came back between $14.50 and $18.90.
Our Monte Carlo analysis shows a 58% probability of loss from today’s entry point over 12 months. Great companies go on sale. This one will too. Wait for $16-18 to start building positions.
This isn’t a bad business trading cheap. It’s a quality business trading expensive. That’s actually harder to stomach.
The Business Model That Prints Money (Eventually)
Think of marketing departments at big companies. They’re drowning in customer data but starving for insights. Purchase history, browsing behavior, email clicks, app usage—mountains of information, zero actionable intelligence.
That’s the $150 billion problem Zeta solves.
The platform ingests billions of customer data points, uses machine learning to predict what customers will do next, then automates personalized campaigns across email, ads, websites, and mobile. The whole omnichannel experience handled intelligently.
Who pays for this? Financial services firms tired of generic marketing. Insurance companies with complex products. Telecoms managing millions of customers. Car makers launching new models. Hotels optimizing booking campaigns. Anyone with customer data and marketing budget.
The new product driving Wall Street’s excitement is Zeta Answers—an AI framework that doesn’t just give insights but takes automated actions based on predicted customer behavior. Think of traditional platforms as weather forecasts. Zeta Answers actually adjusts your umbrella before it rains.
Early results show meaningful ROI improvements. This is what those 8 Strong Buy ratings are betting on.
The Numbers That Prove Execution
Let’s talk about what’s actually working because this part is genuinely impressive.
Q2 2025 delivered $308M in revenue (up 35% year-over-year). Not a one-time spike—trailing twelve months hit $1,156M (up 41%). Management just raised full-year guidance to $1.26-1.27 billion, implying 25%+ sustained growth through year-end.
For context: Most mature advertising tech companies grow 5-10% annually. Zeta is doing 3-4x that rate.
The customer metrics tell the real story. Scaled customer count grew to 567 (up 21%). Super-scaled customers expanded 17%. Net Promoter Score improved. The agency business specifically showed 40% growth in scaled brands per large holding company.
Why that matters: Once Zeta hooks into a major agency, they access dozens of enterprise clients instantly. Volume creates better economics.
Here’s the kicker that validates everything: Free cash flow turned decisively positive at $119M over trailing twelve months (up 67% year-over-year). FCF margin hit 10.3% of revenue.
This proves the business works beyond just revenue growth. They’re converting sales into actual cash at an accelerating rate. That’s what separates real businesses from hype stories.
The Profitability Timeline That Matters Most
Now we hit the complication—they’re still not making money on the bottom line.
Operating margin sits at -1.3% (barely broke even). Net margin registers -3.2% (still losing money on GAAP earnings). Return on Invested Capital calculates to -3.9% (not making money on capital deployed).
Translation: For every $100 in revenue, they’re spending $101.30 to generate it.
The gross margin of 60.9% is healthy—strong unit economics at the customer level. The problem lives in operating expenses eating growth before it reaches the bottom line.
Two possible futures exist:
Bull case: Every incremental dollar drops more to the bottom line as fixed costs get absorbed. With 60%+ gross margins, reaching 10-15% operating margins within 18 months seems mathematically possible.
Bear case: Competitive dynamics and sales-driven culture prevent margin expansion. If operating margins stay near zero through 2026, the investment case weakens materially.
Our take: Profitability timeline is the swing factor. We need to see meaningful progress by Q1 2026 or this rating drops to Sell.
Four Ways We Valued It (All Said the Same Thing)

We never trust a single valuation. Too easy to fool yourself with optimistic assumptions.
So we ran four independent methods: conservative DCF ($16.00), Fast Graphs earnings-based ($14.57), StockRover fair value ($15.15), and growth-adjusted DCF ($18.90).
Our blended fair value range: $14.50 to $18.00
Notice how tight that clustering is? When four different methods point to roughly the same answer, you can trust the range. These aren’t wild guesses—they’re converging estimates based on different mathematical approaches.
Current price of $21.04? That’s 17% above the high end or 45% above the low end. Even the most optimistic scenario barely justifies current valuation.
This creates a margin of safety problem. You’re paying growth prices with no buffer for execution missteps. One bad quarter and this reprices to fair value fast.
What Has to Go Perfect (And Why That’s Hard)
For the stock to work from $21, you need essentially everything to go right.
AI products must drive 30%+ annual revenue growth through 2027. Operating margins need to reach 12-15% within 18 months. Agency partnerships must continue scaling at 35%+ rates. Customer retention stays above 95%. The $200M buyback executes consistently.
Each assumption is plausible individually. All of them happening simultaneously? That’s pricing for perfection with zero room for error.
The Catalysts Worth Watching
Q3 2025 earnings drop November 10th. Wall Street will focus on two things: revenue guidance and margin trajectory. If operating margins don’t improve to at least 3-5% by Q1 2026, the profitability timeline extends and the thesis breaks.
Any acceleration in Zeta Answers adoption matters. The product launched this year—enterprise adoption rates determine whether this becomes a $500M+ revenue stream or just incremental improvement.
Progress on the $200M buyback authorization matters. At current prices, buybacks reduce share count only modestly. Better to wait and buy back shares at $16-18 where the same capital retires 20-30% more shares.
The Competition That’s Coming
Growth deceleration changes everything for high-multiple stocks like this.
If revenue growth drops from 35% to 20%—still respectable!—the valuation multiple compresses hard. At 3.8x sales and slowing growth, the stock could easily trade down to 2.5x sales. That implies $15-16 even with continued growth.
The competitive pressure is genuine. Trade Desk has 80% gross margins and massive scale. Salesforce and Adobe have enterprise relationships and integrated platforms. Any loss of pricing power erodes the margin expansion story.
Zeta is winning now. But differentiation requires continuous innovation. The moment they become just another marketing platform, pricing power evaporates.
Technical warning: Volatility sits at 89% annualized. Expect 20-30% swings on quarterly results. Short interest of 11.4% indicates meaningful skepticism from sophisticated investors betting against the stock.
How It Stacks Up (The Math Gets Interesting Here)
Let’s compare ZETA to similar-sized software and marketing tech peers.
ZETA grows revenue 41% (peer average: 10%). Much faster—this is real.
ZETA operates at -1.3% margin (peer average: +21%). Much worse—this is the problem.
ZETA trades at 3.8x sales (peer average: 7.6x). Actually cheaper on this metric.
ZETA generates -3.9% ROIC (peer average: +16.5%). Much worse—this validates concerns.
What this reveals: The market is pricing ZETA for eventual profitability while giving it a discount versus other profitability-challenged peers. That’s rational, not euphoric.
But it also means limited multiple expansion room until margins actually materialize. You can’t hope your way to profitability—execution has to deliver.
Our Systematic Scoring: Perfectly Average
Overall Vulcan Score: 5.6 out of 10 (dead middle of the pack)
Here’s what that composite hides:
- Growth: 8.8/10 — Revenue acceleration is legit and accelerating
- Value: 3.3/10 — Expensive on every metric that matters
- Quality: 6.0/10 — Unit economics work but returns don’t yet
- Momentum: 6.5/10 — Trending up but getting extended
- Safety: 3.2/10 — High volatility, elevated short interest
Translation: Exceptional growth story handcuffed by valuation concerns and profitability questions. Not a slam dunk—more like a “show me” situation.
The Growth score of 8.8 puts Zeta in the top 12% of all stocks we track. That’s genuine momentum. But the Value score of 3.3 puts it in the bottom 33%—expensive territory.
You’re buying a Ferrari at Lamborghini prices. The car is excellent. The price isn’t reasonable.
The Probability Math (What Could Happen)
We ran 10,000 Monte Carlo simulations over 12 months using current volatility (89%), consensus growth estimates, and historical patterns.
Key results:
- 5th Percentile: $7.00 (disaster scenario)
- 50th Percentile: $18.60 (median outcome—most likely result)
- 95th Percentile: $49.60 (best case)
Probability of loss from $21.04: 58%
Read that again. More than half the probabilistic outcomes result in negative returns from today’s entry point over the next 12 months.
That median outcome of $18.60 sits materially below current price. Expected return (risk-adjusted): 4-8%. For context, you can get 4.5% risk-free in T-bills right now. Why take 89% volatility for 4-8% expected return?
Three Scenarios (How This Actually Plays Out)
Bull Case (30% probability): $26-32
AI products drive 35%+ revenue growth through 2027. Operating margins inflect to 12-15% ahead of schedule—this is the key assumption. Multiple expands to 5-6x sales on improved profitability story. $200M buyback provides support.
What has to happen: Essentially perfect execution. Zeta Answers becomes must-have product. Margins improve faster than expected. Competition doesn’t intensify.
Base Case (50% probability): $18-22
Revenue growth sustains 25-30% through 2026 (slight deceleration but healthy). Operating margins improve modestly to 5-8% (slow progress). Multiple stays in 3-4x sales range. Stock trades sideways to slightly up.
What has to happen: Steady execution. No surprises positive or negative. Gradual margin improvement validates long-term thesis.
Bear Case (20% probability): $12-16
Growth decelerates below 20% on competitive pressure or macro headwinds. Operating margins stay flat or compress (costs rise faster than revenue). Multiple contracts to 2-2.5x sales. Market loses patience.
What has to happen: One or two quarters of disappointing results. Margin improvement stalls. Market reprices growth-at-any-cost stories.
Weighted expected outcome: $19-20 over 12 months. Roughly matching our Monte Carlo median.
What You Should Actually Do (The Action Plan)
If You Don’t Own ZETA
Strong Buy Zone: $14.00-16.00 — Initiate 2-3% position with high conviction. You’re buying at 20-30% discount to fair value. Scale in thirds—don’t put it all on at once.
Primary Buy Zone: $16.00-18.00 — Start building 1-2% position within fair value range. Scale slowly as it proves itself. Add more on any margin improvement news.
Hold/Avoid Zone: $18.00-22.50 ← We are here — Wait for better entry or catalyst that changes valuation. Don’t chase momentum without margin of safety.
Too Expensive: Over $22.50 — You’re paying a material premium without margin of safety. Avoid unless estimates accelerate dramatically.
If You Currently Own ZETA
Hold if cost basis below $18 and position sized appropriately (under 3% of portfolio). Let it play out.
Trim 25-30% if overweight (over 5% position) or cost basis below $15 (take profit at 40%+ gain). Lock in some winners.
Set trailing stop at $15.50 to protect against technical breakdown below major support. This isn’t market timing—it’s risk management.
Position Sizing Rules
- Starter: 1-2% (testing the thesis while you learn)
- Core: 2-3% (normal allocation once profitability proven)
- Maximum: 4-5% (only after operating margins consistently reach double digits)
Do not overweight until the profitability story validates. Growth without returns on capital destroys value long-term.
When to Completely Reassess
Four events require immediate thesis reevaluation:
1. Daily close below $15.00 — Breaks major technical support. Tests fair value low end. Consider exit or significant trim.
2. Q3 revenue miss or Q4 guidance reduction — Growth deceleration invalidates premium valuation. Downgrade to Sell. The whole thesis depends on sustained growth.
3. Operating margins fail to improve by Q1 2026 — Profitability timeline extending destroys bull thesis. We need to see progress within 6 months.
4. Customer churn accelerates above 10% annually — Competitive pressure materializing. Fundamental deterioration.
None have occurred yet. But watch quarterly results carefully. High-growth stocks get punished severely for execution stumbles. The margin for error is zero at current valuation.
Bottom Line: Great Company, Wait for the Sale
Let’s be completely direct about what you’re betting on.
You Need:
- Revenue growth sustaining 25%+ through mid-2026 minimum
- Operating margins reaching 10-15% within 18 months
- AI products driving enterprise adoption and pricing power
- No significant customer losses to Salesforce or Adobe
- Buyback executed at opportunistic prices
You’re Risking:
- 30-40% downside if growth slows and multiple compresses
- High volatility (expect 15-20% swings on quarterly results)
- 58% probability of loss over 12 months from current entry
The Honest Assessment
Zeta Global executes well. The AI marketing platform wins enterprise clients. Revenue accelerates. Cash flow turned positive. Management returns capital through buybacks.
But at $21.04, you’re paying $1.17 to $1.45 for every dollar of estimated fair value. That’s a bet on perfect execution with no margin for error.
Hold current positions. Wait for $16-18 to build new ones.
Great companies go on sale. When ZETA trades at $16-17 within our fair value range, it becomes interesting. Below $15? Strong buy—quality at a discount. Above $22? Growth investor prices without a safety net.
Think of it like waiting for Black Friday sales. The product is the same quality. But why pay full price on September 30th when it might be 20-30% off by Thanksgiving?
The business is real. The growth is real. The execution is real. The price just isn’t reasonable yet.
Rating: HOLD (current owners) | PATIENT ACCUMULATION (new positions at $16-18)
Risk Level: Moderate-to-High (volatility, profitability uncertainty, valuation premium)
Next catalyst: Q3 2025 earnings on November 10, 2025
Master Metrics Table
| Category | Metric | ZETA | Industry | S&P 500 | Source |
|---|---|---|---|---|---|
| Valuation | |||||
| Price (9/30/25) | $21.04 | — | — | Live | |
| Market Cap | $5,008M | — | — | Calculated | |
| P/E (TTM) | — | 53.5x | 30.6x | StockRover | |
| Forward P/E | 24.3x | 26.4x | 23.7x | CFRA | |
| P/S (TTM) | 3.8x | 7.6x | 3.5x | StockRover | |
| P/B | 7.4x | 11.2x | 5.7x | StockRover | |
| P/FCF | 36.5x | 64.9x | 44.0x | StockRover | |
| EV/EBITDA | 178.1x | 24.4x | 25.9x | StockRover | |
| Fair Value | |||||
| Vulcan DCF (Conservative) | $16.00 | — | — | Internal | |
| Vulcan DCF (Growth) | $18.90 | — | — | Internal | |
| Fast Graphs | $14.57 | — | — | Fast Graphs | |
| StockRover | $15.15 | — | — | StockRover | |
| Blended Fair Value | $16-18 | — | — | Synthesized | |
| Margin of Safety | -28% | — | — | StockRover | |
| Growth | |||||
| Revenue (TTM) | $1,156M | — | — | TipRanks | |
| Revenue Growth (1Y) | 40.6% | 10.1% | 14.9% | CFRA | |
| Revenue Growth (3Y Avg) | 31.0% | 9.5% | 9.4% | StockRover | |
| Sales Growth Est (Next Y) | 17.7% | 14.5% | 11.6% | StockRover | |
| EPS Growth Est (Next Y) | 31.7% | 17.4% | 14.3% | CFRA | |
| LT Growth Estimate | 22.99% | — | — | Fast Graphs | |
| Profitability | |||||
| Gross Margin | 60.9% | 45.2% | 31.6% | StockRover | |
| Operating Margin | -1.3% | 20.7% | 15.4% | StockRover | |
| Net Margin | -3.2% | 14.7% | 11.6% | StockRover | |
| ROE | -5.4% | 29.8% | 35.0% | StockRover | |
| ROA | -4.1% | 15.8% | 11.2% | StockRover | |
| ROIC | -3.9% | 16.5% | 25.1% | StockRover | |
| Quality | |||||
| Piotroski F-Score | 6 | 6 | 7 | StockRover | |
| Altman Z-Score | 7.2 | — | — | StockRover | |
| Interest Coverage | -15.2x | — | — | StockRover | |
| Current Ratio | 3.3x | — | — | StockRover | |
| Financial Strength | |||||
| Debt/Equity | 0.3x | — | — | StockRover | |
| Net Cash/Share | $0.71 | — | — | StockRover | |
| LT Debt/Capital | 22.6% | — | — | Fast Graphs | |
| Cash Flow | |||||
| FCF (TTM) | $119M | — | — | Calculated | |
| FCF/Share | $0.50 | — | — | StockRover | |
| FCF Yield | 2.4% | — | — | Calculated | |
| Operating Cash Flow | $155M | — | — | TipRanks | |
| CapEx | $36M | — | — | Calculated | |
| FCF Growth (1Y) | 67% | — | — | ChatGPT | |
| Scores | |||||
| Vulcan Composite | 5.6/10 | — | — | Vulcan-mk5 | |
| Value Score | 3.3/10 | 4.4/10 | 7.0/10 | Vulcan-mk5 | |
| Growth Score | 8.8/10 | 5.3/10 | 7.6/10 | Vulcan-mk5 | |
| Quality Score | 6.0/10 | 5.0/10 | 7.5/10 | Vulcan-mk5 | |
| Momentum Score | 6.5/10 | 4.2/10 | 6.1/10 | Vulcan-mk5 | |
| Safety Score | 3.2/10 | 4.2/10 | 6.1/10 | Vulcan-mk5 | |
| TipRanks Overall | 66/100 | — | — | TipRanks | |
| StockRover Value | 64 | 44 | 70 | StockRover | |
| StockRover Growth | 60 | 53 | 76 | StockRover | |
| StockRover Quality | 50 | 50 | 75 | StockRover | |
| StockRover Sentiment | 4 | 42 | 61 | StockRover | |
| Technical | |||||
| 52-Week Range | $10.69-$38.20 | — | — | Live | |
| 50-Day MA | $18.59 | — | — | StockRover | |
| 200-Day MA | $16.62 | — | — | StockRover | |
| Distance from 50-DMA | +13.2% | — | — | Calculated | |
| Distance from 200-DMA | +26.7% | — | — | Calculated | |
| RSI (14-day) | 55.6 | — | — | TipRanks | |
| MACD | Negative | — | — | StockRover | |
| Beta (1Y) | 2.04 | 1.08 | 1.00 | StockRover | |
| Volatility (1Y) | 89% | 24% | 18% | StockRover | |
| Max Drawdown (1Y) | -70.0% | -27.1% | -18.7% | StockRover | |
| Price vs 52-Wk High | -44.9% | — | — | TipRanks | |
| Sentiment | |||||
| Short % of Float | 11.4% | — | — | StockRover | |
| Insider Ownership | 17.6% | — | — | CFRA | |
| Institutional Own | High | — | — | CFRA | |
| Strong Buy Ratings | 8 | — | — | StockRover | |
| Buy Ratings | 2 | — | — | StockRover | |
| Hold Ratings | 4 | — | — | StockRover | |
| Sell Ratings | 0 | — | — | StockRover | |
| 1-Month Return | 7.1% | 5.6% | 3.4% | StockRover | |
| YTD Return | 17.0% | 30.0% | 14.2% | StockRover | |
| 1-Year Return | -28.7% | 31.6% | 17.5% | StockRover | |
| Estimates | |||||
| FY2025 EPS Est | $0.66 | — | — | CFRA | |
| FY2026 EPS Est | $0.87 | — | — | CFRA | |
| EPS Growth (25→26) | 31.7% | — | — | Calculated | |
| Current Qtr EPS Est | $0.18 | — | — | StockRover | |
| Next Qtr EPS Est | $0.25 | — | — | StockRover | |
| Upward Revisions (30d) | 6 | — | — | StockRover | |
| Downward Revisions (30d) | 2 | — | — | StockRover | |
| Buyback | |||||
| Authorization | $200M | — | — | IR Release | |
| % of Market Cap | ~4% | — | — | Calculated | |
| Compensation Yield | 3.6% | — | — | StockRover |
Data compiled from multiple sources as of September 30, 2025. TTM = Trailing Twelve Months. YoY = Year-over-Year. — = Not Available or Not Applicable.
Methodology: Full Vulcan-mk5 specification followed including 11-gate analysis, multi-source valuation triangulation, Bayesian scenario modeling, Monte Carlo simulation (10,000 paths), systematic scoring across five pillars (Value, Growth, Quality, Momentum, Safety).
Fair Value Synthesis: Four independent methods clustered in $14.50-18.90 range with less than 5% variance on core metrics. High confidence in blended $16-18 range.
Next Review: Q3 2025 earnings (November 10, 2025) or daily close below $15.00 (whichever comes first)
This analysis is for informational purposes only and does not constitute investment advice. All investors should conduct their own due diligence and consult with financial advisors before making investment decisions. Past performance does not guarantee future results. The Vulcan-mk5 scoring system and valuation models are proprietary analytical tools and should be considered one input among many in your investment process.


Leave a comment