
Imagine your neighbor just bought the house next door. On paper, the deal looks terrible—she paid $500,000 for a property the tax assessor valued at $300,000. Her accountant is required to immediately write down the difference, creating a massive “loss” on her books. Your other neighbors whisper about financial ruin.
But here’s what they’re missing: She didn’t buy a house. She bought the adjacent property to knock down the fence, connect the utilities, and create one integrated compound worth far more than two separate lots. The accounting rules force her to book a loss today while completely ignoring the structural value she just created.
That’s exactly what just happened with Capital One Financial—except instead of real estate, they bought network infrastructure that competitors spend billions trying to replicate.
The Deal Everyone Misunderstood
On May 18, 2025, Capital One completed its acquisition of Discover Financial Services. The headlines screamed about a $4.3 billion loss and a P/E ratio that broke the calculators. Wall Street analysts barely flinched. Why?
Because anyone who understands how acquisition accounting works knew this was pure optical noise—the financial equivalent of your neighbor’s “loss” that actually created a more valuable asset.
Here’s what Capital One actually bought: closed-loop network economics. Let me explain why that matters, using a metaphor everyone understands.
The Toll Road vs. The Shopping Mall
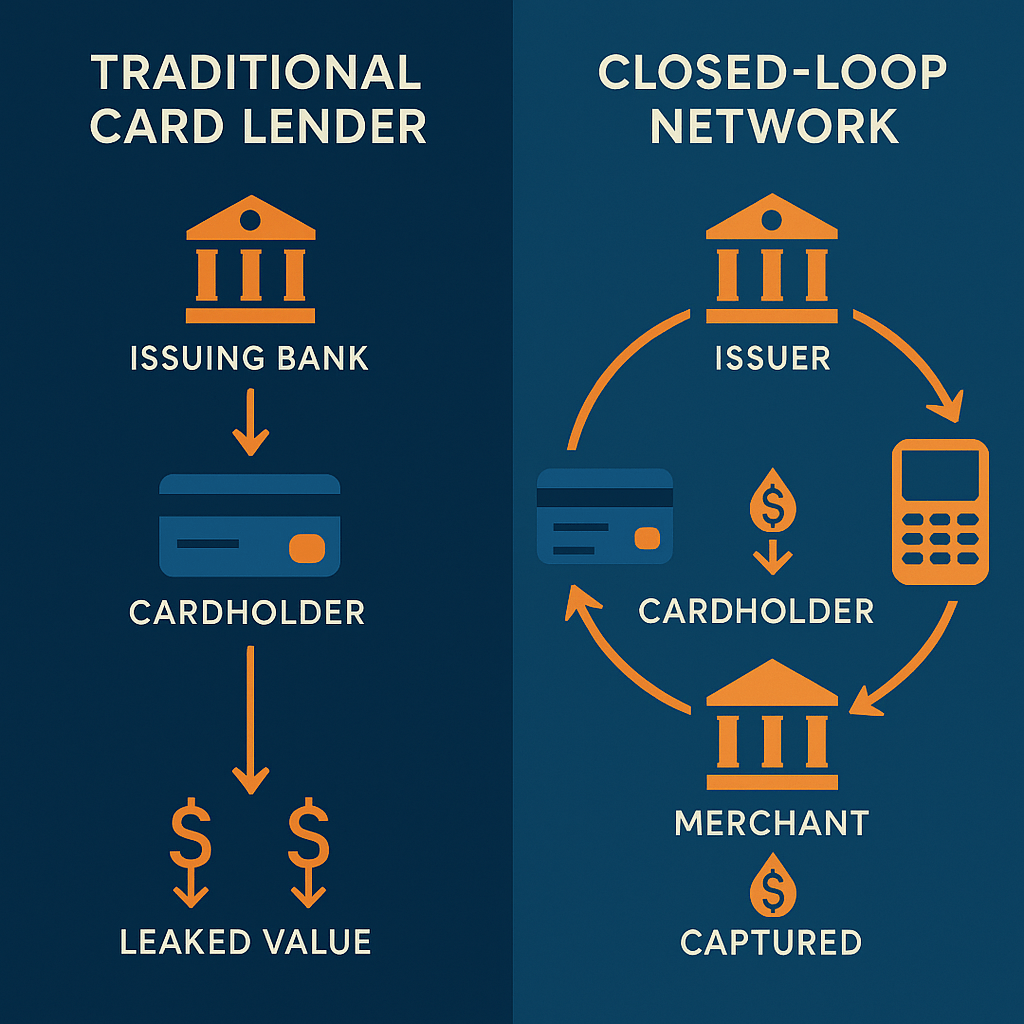
Most credit card companies operate like toll roads. They issue cards, customers use them, and the bank collects interest on balances. That’s it. They’re charging tolls on a road they built, but they don’t control where the road goes or who else profits from the traffic.
American Express operates like a shopping mall. They own the entire ecosystem—they issue the cards (bring customers to the mall), they control the acceptance network (own the mall itself), and they process the transactions (collect rent from every store). Every swipe generates revenue on both sides of the transaction.
Capital One was a toll road operator. By acquiring Discover, they just bought a shopping mall.
This matters because network economics work differently than lending economics. When you control both issuing and acceptance, your data becomes more complete, your bargaining power with merchants improves, and your ability to offer compelling rewards without bleeding margin transforms entirely.
Think about it: If you own the mall, you know exactly which stores your customers visit, how much they spend, what times they prefer, and what deals convert browsing into buying. That intelligence loop is worth billions—and it’s nearly impossible for competitors to replicate without building their own network from scratch.
American Express has spent 175 years building their closed-loop advantage. Capital One just acquired one for $35 billion.
What the Accounting Rules Hide
Here’s where it gets interesting—and where reading financial statements without context becomes genuinely misleading.
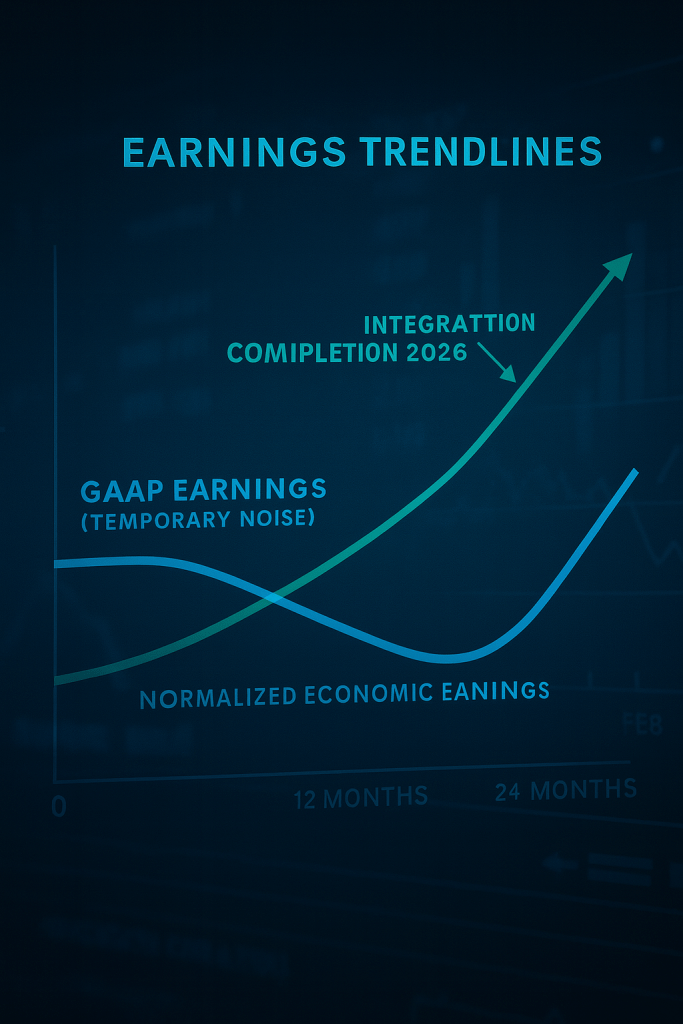
When Capital One bought Discover’s loan portfolio, accounting rules forced them to immediately reserve for potential future credit losses. That created an $8.8 billion provision expense. They also had to write down Discover’s assets to “fair value,” creating additional charges. The result? A reported net loss of $4.3 billion in one quarter.
But here’s what actually happened to the underlying business during that same period:
Pre-provision earnings jumped 34%. That’s the cash the business actually generates before accounting for potential future losses. Combined card purchase volumes surged 22% year-over-year. Credit performance improved—domestic card charge-offs dropped 80 basis points, delinquencies fell 54 basis points.
The business got dramatically stronger while the accounting statements showed catastrophic losses.
The smart question isn’t “Why did they lose $4 billion?” It’s “Will the integration create $2.5 billion in synergies like management projects, and will credit quality hold up?”
Everything else is noise.
The Hidden Catalyst Most Investors Missed
Buried in the regulatory filings was something more immediately valuable than long-term synergies: On October 1, 2025—literally last week—Capital One’s Stress Capital Buffer dropped from 5.5% to 4.5%.
If you don’t speak bank regulatory language, here’s the translation: Capital One just got permission to deploy billions more dollars for buybacks and dividends, as long as their credit book stays healthy and integration proceeds smoothly.
This is like your neighbor discovering that the combined property doesn’t require the expensive retaining wall the inspector initially flagged. Suddenly, the renovation budget just freed up tens of thousands of dollars.
For a bank with $135 billion in market capitalization, a 100 basis point reduction in required capital buffers means real money available for shareholder returns—probably starting in 2026 once the integration noise clears.
The market hasn’t fully priced this in yet because everyone’s still focused on the accounting drama.
What Could Actually Go Wrong
Every compelling investment story has real risks. Let me be specific about what actually matters versus what’s just fear-mongering.
Integration execution risk is real. Combining two massive technology platforms, converging underwriting standards, and realizing $2.5 billion in synergies is not guaranteed. If management guides to delays or meaningfully higher costs in the next two earnings calls, the thesis breaks.
How to monitor: Watch quarterly earnings commentary on synergy progress and integration spend. If the next two quarters show slippage, cut exposure immediately.
Credit cycle timing matters more at scale. Capital One now has truly massive exposure to consumer unsecured lending. If unemployment spikes or consumer stress emerges suddenly, charge-offs could deteriorate faster than a smaller, more diversified book.
How to monitor: Capital One reports monthly charge-off and delinquency metrics. If domestic card net charge-offs sustain above 6.0% for two consecutive months WITHOUT offsetting growth, that’s your warning signal. Currently they’re at 5.25% and improving—but stay vigilant.
Network economics aren’t guaranteed. Just because American Express successfully operates a closed-loop model doesn’t mean Capital One will. Merchant relationships, customer engagement, rewards program effectiveness—these take years to optimize. There’s execution risk in translating the asset into actual value.
How to monitor: Watch for commentary on merchant acceptance growth, transaction volume trends specifically on the Discover network, and any changes to rewards program ROI metrics.
These risks are concrete, monitorable, and actionable. They’re not vague concerns about “uncertainty” or “challenging environments”—they’re specific tripwires that would invalidate the investment case.
The Math That Actually Matters
Strip away the accounting noise and focus on earning power:
Today’s price: Around $211 Forward earnings estimate (2026): $19.74 per share
Forward P/E ratio: 10.7x
Compare to peers:
- American Express: 23.3x forward earnings
- Industry average: 28.8x forward earnings
- S&P 500 average: 30.6x forward earnings
Capital One trades at a 60% discount to American Express despite now operating a similar business model with closed-loop network economics.
Why the massive discount? Three reasons:
- Integration risk (real but time-limited)
- Credit cycle exposure (real but improving)
- Accounting confusion (cosmetic but persistent)
If management executes on even 75% of the synergy target and credit stays orderly, that valuation gap should narrow materially. You don’t need Capital One to trade at American Express multiples—even getting halfway there means the stock goes to $280-300.
Our conservative fair value analysis using multiple approaches—discounted cash flow, relative multiples, and normalized earnings power—puts the stock around $240, roughly 14% above current levels. That assumes no multiple expansion, just getting to fair value on normalized earnings.
The real upside case isn’t about perfect execution. It’s about the market recognizing that closed-loop network infrastructure deserves a structural premium to pure lending businesses—even if Capital One’s version isn’t as refined as American Express yet.
For context on how we analyze transformative financial services M&A and extract signal from accounting noise, see our framework on Strategic M&A Value Creation in Financial Services and our broader piece on Credit Cycle Navigation: When To Rotate Into Financials.

Where To Take Action
The stock pulled back 7% over the past month, bringing it from $232 down to the current $211 level. That pullback creates an entry window that didn’t exist six weeks ago.
Our buy zones:
Strong Buy: Below $168
Primary Buy: $168-$216
Hold: $216-$264
Trim: $264-$300
Too Expensive: Above $300
Specific entry strategy:
Start building a position now at $211 if you can handle volatility. Add on any further weakness toward $200-205. If the stock reclaims its 50-day moving average around $219 with rising volume, that’s confirmation that the downtrend has reversed—add there.
Position sizing matters: This is a cyclical financial with integration risk. Don’t make it your largest holding. For balanced portfolios, 4-7% maximum. For aggressive investors comfortable with bank volatility, up to 10%.
Clear invalidation triggers (when to exit):
- Two consecutive quarters where charge-offs exceed 6.0% without credible management response
- Visible synergy delivery misses or materially increased integration costs in earnings guidance
- Weekly close below $196 (the 200-day moving average) on heavy volume—signals credit cycle concerns emerging
Timeline expectations: This is a 12-18 month base case thesis, potentially 24-36 months for full value realization as integration completes and network economics become obvious.
The Technical Setup
Capital One is above its 200-day moving average at $196 (intermediate uptrend intact) but below its 50-day moving average at $219 (short-term consolidation).
The recent pullback created a retest of support—the stock is checking whether buyers still believe in the $200-210 zone. If it holds here, the next leg higher targets the old resistance around $225-232, then breakout to new all-time highs above $245.
If it breaks support at $196, that’s your signal that something fundamental has changed—probably credit concerns or integration problems emerging. That’s when you cut exposure, not when headlines scream about losses that don’t matter.
What Wall Street Actually Thinks
Analyst consensus is solidly bullish: 16 Strong Buy ratings, 2 Buy, 6 Hold, and exactly zero Sell ratings. The average price target sits at $241—roughly 14% above current levels.
What’s more interesting is the trend in estimates. Over the past 90 days, earnings estimates for current and next quarter have risen 2-4%. Analysts are getting more confident as they see integration progress and credit stability, not less.
This isn’t some contrarian deep-value play where you’re fighting the consensus. The smart money already understands the story. You’re just not paying up for it yet because retail investors are still scared of the headlines.
The Bottom Line
Capital One bought structural advantage disguised as acquisition chaos. The GAAP loss everyone’s panicking about is accounting noise. The pre-provision earnings growth and network infrastructure acquisition are the actual story.
At $211 and 10.7x forward earnings, you’re paying a steep discount for:
- Best-in-class 45% operating margins
- $2.5 billion synergy opportunity over 2-3 years
- Newly acquired closed-loop network economics
- Improving credit trends and enhanced capital flexibility as of October 1
The market is handing you American Express economics at Synchrony Financial prices because most investors can’t separate accounting statements from business reality.
Position accordingly: Build through $216, add on strength above $220, trim above $264. Invalidate on sustained credit deterioration or visible synergy disappointment.
Expected outcome: Mid-$240s within 12 months if execution tracks and credit cooperates. That’s 15-18% upside with clear downside protection at the 200-day moving average around $196.
The integration complexity creates the discount. The network economics create the opportunity. Your job is to size the position appropriately for the risk while the market is still focused on accounting noise that doesn’t predict future cash flows.
Most investors are still reading yesterday’s headlines about losses. Smart money is already calculating tomorrow’s synergies. The gap between those two perspectives is where returns come from.
Master Metrics Table
| Metric | Value | Context |
|---|---|---|
| Ticker | COF | Financial Services / Credit Services |
| Price (Sep 30, 2025) | $210.68 | 52-week range: $143-$232 |
| Market Cap | $135.0B | Large-cap financial |
| Vulcan Composite Score | 4.96/10 | Value (6.8), Growth (4.5), Quality (3.8), Momentum (6.2), Safety (3.5) |
| VALUATION | ||
| Fair Value (Blended) | $240 | DCF + Multiples + Street consensus |
| Margin of Safety | ~12% | Current price vs. conservative FV |
| Forward P/E | 10.7x | vs. 28.8x industry, 30.6x S&P 500 |
| TTM P/E | 500+ | GAAP distortion from acquisition |
| Price/Sales | 2.1x | vs. 5.1x industry |
| Price/Book | 1.2x | vs. 5.1x industry |
| QUALITY | ||
| ROIC | 8.8% | Depressed by integration; normalizing higher |
| ROE (TTM) | -0.3% | GAAP noise; historically 13-20% |
| Operating Margin | 45.3% | Best-in-class for credit services |
| Piotroski F-Score | 3 | Weak due to transition; monitor improvement |
| Debt/Equity | 0.5x | Conservative for financial institution |
| GROWTH | ||
| Revenue Growth (1Y) | 13.1% | Boosted by Discover acquisition |
| Forward EPS Growth | 11.9% | 2026 estimate vs. 2025 |
| Long-term EPS Est. | Low-teens | With synergies |
| DIVIDEND | ||
| Forward Yield | 1.1% | Below peer average |
| TTM Dividend | $2.40 | Unchanged YoY |
| Payout Ratio (Normalized) | ~15-20% | Conservative, room to grow |
| SAFETY & RISK | ||
| Beta (1Y) | 1.59 | High cyclicality |
| Volatility (1Y) | 38% | Elevated |
| Max Drawdown (5Y) | -50.4% | High risk in crisis scenarios |
| Credit NCO Rate | 5.25% | Down 80bps YoY, improving |
| Stress Capital Buffer | 4.5% | Effective Oct 1, 2025 (down from 5.5%) |
| KEY CATALYSTS | ||
| Near-term | Oct 1 SCB reduction; Q3 earnings (10/21/25) | Capital flexibility; GAAP clarity |
| Medium-term | Synergy progress; credit sustainability | $2.5B synergy target |
| Long-term | Integration completion; multiple re-rating | Network economics realization |
All analysis based on data through September 30, 2025. Monitor monthly credit metrics, quarterly earnings, and stated integration progress for changes to the thesis.


Leave a comment