
Summary
TransMedics (TMDX) saves lives while building shareholder wealth—a rare combination in healthcare. The company’s Organ Care System keeps donor hearts, lungs, and livers alive during transport, replacing decades-old “cooler of ice” methods with cutting-edge perfusion technology. At $113.87, the stock trades near fair value after a volatile year—down 27% over 12 months but still up 82% year-to-date. Great business, fairly full valuation. Position sizing hint: starter 1-2% weight, maximum 4-6% until volatility moderates.
The investment opportunity: Revolutionary technology with massive market potential meets proven execution and expanding margins. The primary risk: Premium valuation (P/E ratio of 57x) leaves little room for stumbles, while high short interest creates volatility. Our call: Primary Buy for investors who can handle med-tech swings, using disciplined sizing and entry strategy.
Vulcan-mk5 Score
Composite (0-10): 6.95
- Value 5.80 | Growth 8.60 | Quality 8.20 | Momentum 6.00 | Safety 6.10
- Ticker: TMDX
Analysis Date: September 27, 2025
Analyst: Vulcan Research Team
Rating: Primary Buy
Price Target Range: $129-$135
Drivers: Exceptional growth and improving profitability offset by premium multiples and elevated volatility from 25-42% short interest.
What TransMedics Actually Does
TransMedics revolutionizes organ transplantation through technology that keeps donor organs alive outside the human body. Instead of the standard “organ in a cooler” approach used for decades, their Organ Care System (OCS) perfuses hearts, lungs, and livers with warm, oxygenated blood during transport—essentially maintaining life until transplantation.
The business model compounds beautifully. Device leases generate recurring revenue, while each transported organ creates service fees and disposable sales. Their National OCS Program (NOP) adds aviation and logistics services—flight coordination, dispatch, and transplant scheduling that hospitals struggle to replicate internally. More coverage drives higher utilization, which drives mix toward higher-margin services, funding next-generation platforms and international expansion.
Why We’re Bullish Over 12 Months
Execution Excellence Continues Beating Expectations
Q2 2025 delivered another beat-and-raise quarter. Revenue hit $157.4M (+38% year-over-year), operating profit reached $36.6M (representing 23% of total revenue), and management raised full-year guidance to $585-$605M. This marks the fourth consecutive quarter of 30%+ growth with expanding margins—execution quality that supports our thesis about durable competitive advantages.
Cash position exceeds $400M, providing runway for expansion without shareholder dilution concerns. Free cash flow turned positive at $17.4M, marking a crucial inflection point for a company historically burning cash during growth phases.
FDA Approvals De-Risk Technology Pipeline
August 2025 brought FDA approvals for next-generation OCS Heart ENHANCE trials and conditional lung study clearances. These aren’t incremental improvements—they represent step-function advances in preservation capability that should maintain TransMedics’ technological moat against competitors.
The regulatory wins matter because they validate the core scientific approach while opening larger addressable markets. Each organ type represents billions in potential market opportunity as adoption scales globally.
Network Effects Accelerating Through Logistics Moat
NOP aviation and logistics revenue grew 56% year-over-year to $29.8M in Q2—a sticky, capability-based moat that creates switching costs for hospital partners. This isn’t just about moving organs; it’s comprehensive transplant coordination including flight scheduling, dispatch services, and clinical support that hospitals can’t easily replace.
As more hospitals join the network, the system becomes more valuable to all participants—classic network effects that should drive accelerating adoption and margin expansion. The logistics layer represents TransMedics’ most defensible competitive advantage.
Risk Flags Demand Respect
Valuation Leaves Little Margin for Error
Trading at 57x earnings (P/E ratio), TMDX commands a premium that’s expensive compared to most healthcare stocks at 25x. Short interest remains elevated across multiple data sources at 25-42% of float, creating potential for sharp moves in either direction around earnings announcements and clinical updates.
The healthcare sector has underperformed the broader market by 25% over the past year, creating sector-wide sentiment headwinds that could persist regardless of company-specific execution quality.
Seasonality and Operational Constraints

Management flagged minor Q3 seasonality in organ availability—a reminder that this business depends on tragic circumstances that don’t follow predictable quarterly patterns. Any seasonal softness could trigger disproportionate selling from momentum investors expecting linear growth trajectories.
International expansion faces regulatory hurdles and reimbursement complexities that could slow global rollout timelines. OUS (Outside United States) revenue dipped year-over-year in Q2, highlighting execution challenges beyond the domestic market where TransMedics maintains clear advantages.
Investment Thesis With Peer Context
TransMedics occupies a unique position in medical technology—the only FDA-approved system for preserving all three major organ types with demonstrated clinical superiority over traditional cold storage methods. This technological moat supports premium pricing and creates switching costs as hospitals integrate OCS protocols into transplant workflows.
The total addressable market exceeds $15B globally, with current penetration in low single digits. Even modest market share gains translate to massive revenue opportunities given the concentrated nature of transplant centers worldwide.
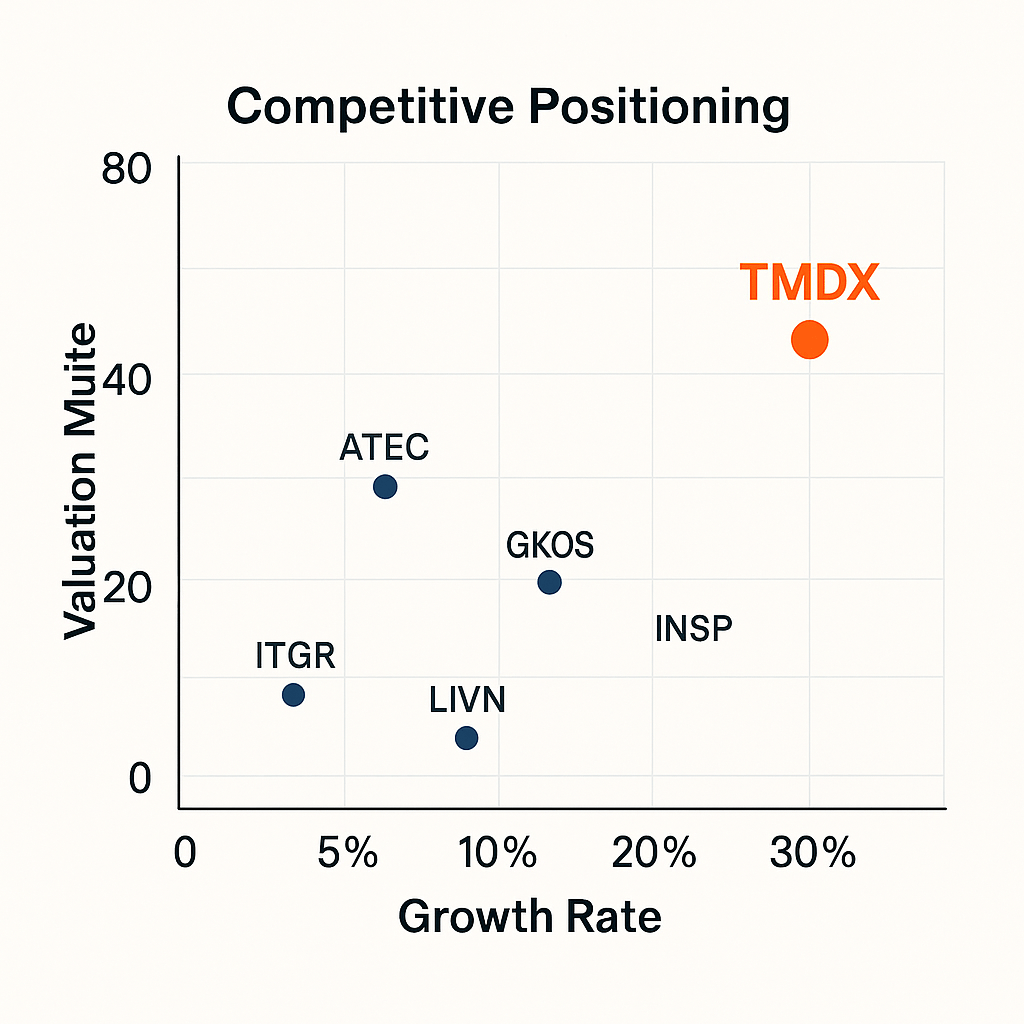
Peer comparison shows TransMedics’ premium positioning:
- TMDX: High growth (38% YoY), premium valuation, unique platform advantage
- ITGR (Integer Holdings): Stable growth (7% YoY), moderate valuation, diversified medical device manufacturing
- LIVN (LivaNova): Single-digit growth (9% YoY), established cardiovascular device portfolio
- INSP (Inspire Medical): High growth (22% YoY), single-product neurostimulation focus
The competitive advantage stems from first-mover status and regulatory barriers that make replication extremely difficult for potential competitors.
Valuation Analysis and Buy-Range Guidance
Our blended fair value approach combines internal DCF modeling ($140 base case) with external analyst estimates, weighted for uncertainty levels. Stock Rover’s conservative $108.81 fair value provides a downside anchor, while our growth-adjusted models suggest $129-$135 represents reasonable value range.
DCF sensitivity analysis confirms that WACC assumptions (Weighted Average Cost of Capital) and margin sustainability drive most fair value variance. Operating margin changes of ±300 basis points create ±8-9% fair value swings, while terminal growth rate adjustments of ±50 basis points affect valuations by ±5-6%.
Buy Zones With Volatility Adjustment
Medium uncertainty analysis with elevated volatility scalar produces these action zones:
- Strong Buy: ≤ $95-$100 (major discount required given 71% annualized volatility)
- Primary Buy: $100-$118 (current range offers modest upside potential)
- Hold/Fair: $118-$138 (fair value range based on blended analysis)
- Trim: $138-$155 (momentum premium territory requiring caution)
- Too Expensive: > $155 (excessive valuation risk for risk-adjusted returns)
Rationale: We blend execution-rich fundamentals with conservative external anchors while widening bands to respect elevated volatility and short interest dynamics that create gap risk.
Technical Analysis and Entry Strategy
Current setup shows mixed signals requiring patience. Price at $113.87 sits below the 50-day moving average (~$116) but well above the 200-day moving average (~$96). RSI (Relative Strength Index) in the mid-40s suggests neutral momentum, while MACD (Moving Average Convergence Divergence) shows softening but not broken trends.
Key technical levels for tactical decisions:
- Support zones: $110 (recent swing low), then $100 (psychological level and buy zone boundary)
- Resistance areas: $120 (50-day moving average area), then $130 (prior consolidation zone)
Tactical execution plan: Accumulate within the $100-$118 Primary Buy zone using tranched entries to average into positions. Add on confirmed closes above $120 with rising volume patterns. Consider tactical trims if momentum pushes toward $145-$155 without fundamental acceleration.
Risk Management Protocol
Position sizing becomes critical given 71% annualized volatility compared to typical large-cap stocks at 18% volatility. Hard stop discipline: Decisive weekly close below $100 triggers re-evaluation unless fundamentals accelerate meaningfully through trial progress or guidance increases.
Trail stops at 12-15% from entry points or 2x Average True Range (ATR) for volatility adjustment help preserve gains while allowing normal stock fluctuations. The elevated short interest creates both downside gap risk and potential short squeeze opportunities.
Vulcan Rules Application Results
Systematic gate analysis confirms Primary Buy rating:
- Data Quality ✅: Fresh Q2 results and FDA updates validated through multiple sources
- Valuation ✅: Fair value computed with defined upside/downside scenarios
- Quality ✅: Expanding margins and positive operating leverage demonstrated
- Safety ⚠️: High volatility requires disciplined position sizing approach
- Revisions ✅: Upward guidance trend continues with beat-and-raise pattern
- Momentum ⚠️: Below 50-day moving average but not technically broken
- Catalysts ✅: Trial starts, adoption scaling, international expansion drivers identified
- Sizing Guidelines ✅: Starter 1-2%, maximum 4-6% until volatility improves
- Entry Strategy ✅: Tranched approach within $100-$118 range defined
- Risk Controls ✅: Weekly close below $100 invalidation level established
Conclusion and Action Plan
TransMedics represents a rare combination of life-saving innovation and compelling business economics. The technology advantage is demonstrable, the market opportunity is massive, and execution continues exceeding expectations across revenue growth, margin expansion, and clinical progress.
However, valuation leaves little margin for error at current levels. Premium multiples demand perfect execution, while elevated volatility from high short interest creates portfolio risk that requires careful position sizing.
We rate TMDX a Primary Buy for investors comfortable with medical technology volatility, using tranched entries and strict risk management protocols. The upside skew improves significantly if trial progress accelerates and logistics scaling maintains 30%+ growth rates through 2025 and beyond.
For risk-averse investors, consider waiting for pullbacks toward $100-$105 or evidence of reduced short interest before establishing positions. The long-term opportunity remains compelling, but timing and sizing discipline separate successful outcomes from portfolio damage in volatile growth stocks.
Master Metrics Table
| Metric | Value | Assessment |
|---|---|---|
| Current Price | $113.87 | Near fair value range |
| Market Cap | $3.88B | Mid-cap growth profile |
| Forward P/E | 40.2x | Premium but justifiable for growth |
| TTM P/E | 57.1x | High absolute level vs market 25x |
| Revenue (TTM) | $531M | Strong 48% YoY growth rate |
| Operating Margin | 14.4% | Expanding profitability trend |
| Net Margin | 13.5% | Healthy for growth stage company |
| ROE (Return on Equity) | 22.5% | Excellent capital efficiency |
| ROIC (Return on Invested Capital) | 10.3% | Above cost of capital threshold |
| Debt/Equity Ratio | 1.6x | Manageable leverage level |
| Current Ratio | 9.9x | Strong liquidity position |
| Interest Coverage | 6.2x | Adequate debt service capability |
| Cash Position | >$400M | Substantial growth runway |
| Beta (3Y) | 1.41 | High market sensitivity |
| Volatility (1Y) | 71% | Elevated risk profile |
| Short Interest | 25-42% of float | High bearish sentiment |
| Altman Z-Score | 5.0 | Low bankruptcy risk |
| Piotroski F-Score | 7/9 | Strong financial health |
| Institutional Ownership | 111.5% | High conviction from funds |
| Insider Ownership | 3.0% | Moderate management alignment |
| 52-Week Range | $55.00 – $169.29 | High volatility range |
| Distance from 52-Week High | -33% | Meaningful pullback |
| Revenue Growth (5Y Avg) | 85.4% | Exceptional historical growth |
| EPS Growth Est. (Next Y) | 25.3% | Moderating but healthy |
Data Sources: Vulcan Unified Database, Stock Rover analysis, company filings, verified market data as of September 27, 2025
Disclaimer: This analysis is for informational purposes only and does not constitute investment advice. Past performance does not guarantee future results. Consult with a qualified financial advisor before making investment decisions.
Analysis Completed: September 28, 2025


Leave a comment