
NIO ($7.37) sits near its 52-week high, up 69% year-to-date with a Sentiment Score of 96, yet trades 39% above its fair value with fundamentals that would typically warrant caution. This creates a fascinating study in market psychology versus systematic analysis.
Our stance is Tactical Test Only – small position size, strength-based additions, and disciplined invalidations. The 12-month outcome hinges on whether operational improvements can justify current pricing, or if gravity eventually wins. From our research data, NIO screens as expensive at current levels, but momentum-driven opportunities can emerge for tactical traders willing to respect strict risk controls.
Why We’re Constructively Cautious
The bull case rests on three pillars that could support near-term strength. First, scale economics are beginning to show as NIO projects 41% sales growth for next year, building from a $9.75 billion base. When you’re operating at this revenue scale in a growing market, even modest margin improvements create significant operating leverage.
Second, the company’s battery-as-a-service model differentiates from traditional EV approaches. With plans to build over 4,000 swap stations by end-2025 (1,000 outside China), NIO is creating infrastructure moats that could drive recurring revenue streams. This operational reality matters more than headlines suggest.
Third, sentiment elasticity works both ways. With a Sentiment Score of 96 and recent outperformance of 35.4% versus the S&P 500 over one month, confirmation on technical breakouts can attract trend capital quickly. The momentum is real, even if expensive.
The Fundamental Reality Check
Here’s where systematic analysis differs from momentum chasing. NIO’s Quality Score of 14 reflects operational challenges that can’t be ignored. ROIC of -84.2% means the company destroys value on invested capital. Net margins of -35% and operating margins of -32.5% signal a business still burning cash to grow.
Balance sheet metrics raise additional concerns. The current ratio of 0.8 and quick ratio of 0.7 suggest liquidity pressure, while the Altman Z-Score of -1.1 points to financial stress. Net cash per share of -$0.75 means NIO is actually cash-negative per share outstanding.
The earnings surprise history tells a consistent story – 9 of the last 12 quarters delivered negative surprises. This pattern suggests either overly optimistic estimates or execution challenges. Either way, it’s not the consistency needed for sustainable outperformance.
Monte Carlo Simulation: Understanding the Odds
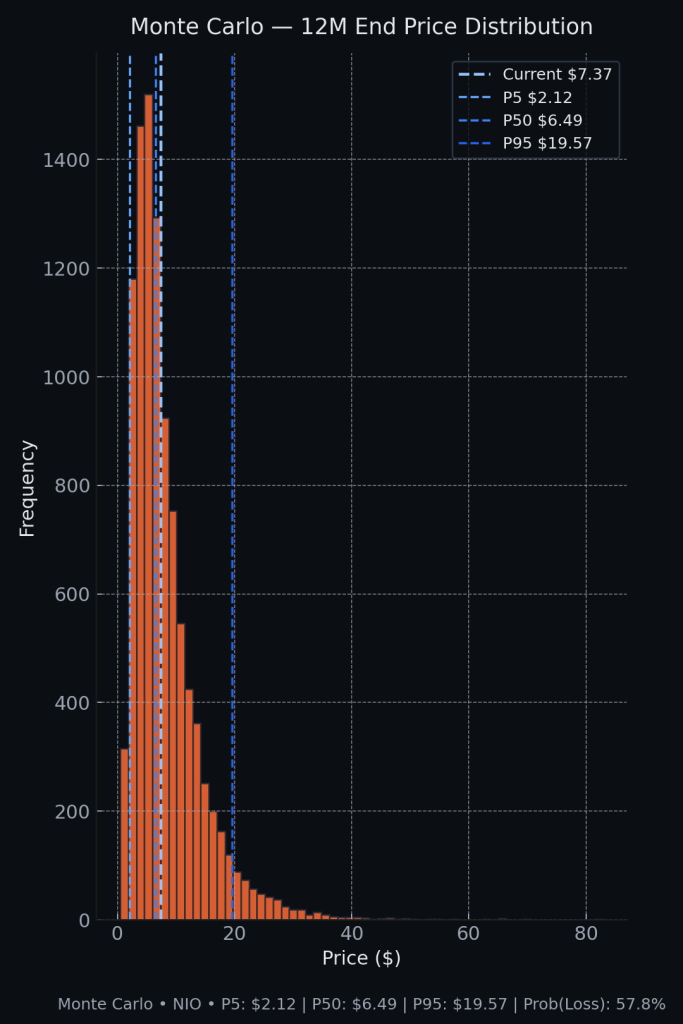
Our 12-month Monte Carlo analysis using 10,000 simulations reveals the statistical reality behind NIO’s volatility. With 67% annualized volatility anchored to the current $7.37 price, the distribution shows meaningful downside risk.
The simulation generates a median price of $6.49, approximately 12% below current levels. The 5th percentile outcome sits at $2.12, while the 95th percentile reaches $19.57. Most importantly, the probability of loss over 12 months is 58%.
This wide distribution reflects the operational uncertainty embedded in NIO’s business model. High-growth companies trading at premium valuations face binary outcomes – either execution delivers growth that justifies pricing, or multiple compression creates significant downside.
Bayesian Scenario Analysis: Three Paths Forward
Our Bayesian framework maps three distinct scenarios over the next 12 months, each with different probability weights based on current fundamentals and macro conditions.
The Bull Path (30% probability) assumes deliveries re-accelerate, gross margin repair begins to show, and no adverse funding events materialize. This scenario could drive trend stability and multiple repair, potentially reaching the higher confidence bands shown in our fan chart.
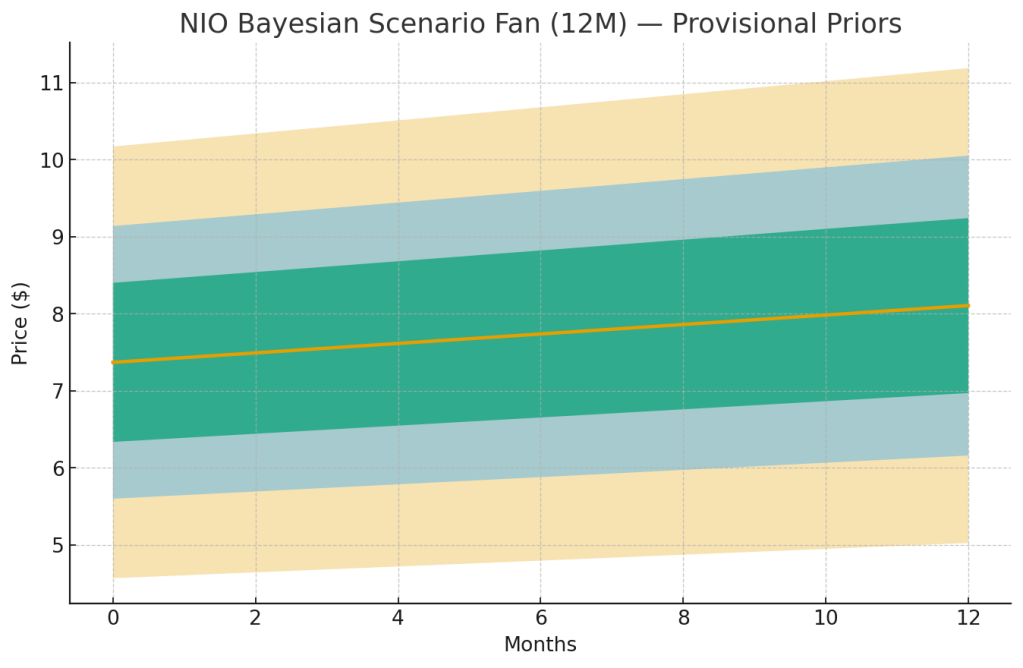
The Base Case (55% probability) expects choppy deliveries and mixed revision trends, leading to range trading behavior. Momentum fades unless positive catalysts stack consistently. This aligns with our median Monte Carlo outcome.
The Bear Scenario (15% probability) involves funding stress or policy shocks that could drive fresh lows and require prolonged repair periods. The recent $1.16 billion equity offering provides breathing room, but execution remains key.
Technical Trading Framework
From a technical perspective, NIO trades near resistance at its 52-week high of $7.71. The stock has attempted multiple breakouts over the past year, with mixed success. This creates a clear tactical framework.
Entry Strategy: Add only on a weekly close above $7.71 with rising volume. This confirms breakout validity rather than catching falling knives.
Position Sizing: Starter position only, given the fundamental quality concerns and high volatility profile.
Invalidation: Weekly close back below the most recent higher low, currently around $6.50 based on recent consolidation patterns.
Risk Management: If two consecutive quarters show worsening free cash flow or margins, stand down regardless of price action.
Valuation and Buy Zones
Using Stock Rover’s fair value estimate of $4.52 with “Uncertain” confidence, we can establish systematic buy zones. The uncertainty rating suggests using medium uncertainty parameters in our band calculations.
Strong Buy Zone: Below $2.71 (approximately 40% discount to fair value)
Primary Buy Zone: $3.62 – $4.40
Hold/Fair Value: $4.41 – $4.63
Trim Zone: $4.69 – $4.92
Too Expensive: Above $4.92
At $7.37, NIO trades significantly above our systematic buy zones. This doesn’t preclude tactical opportunities, but it does mean position sizing should reflect the valuation risk.
Operational Catalysts to Monitor
Several operational metrics will determine whether NIO can grow into its current valuation. Monthly delivery numbers provide the clearest read on execution, particularly as the company scales toward its goal of doubling 2023 delivery volumes.
Gross margin progression matters most for fundamental improvement. Current gross margins of 10.3% need material expansion to support the scale economics thesis. Watch for quarterly commentary on production efficiency and pricing power.
Battery-as-a-service adoption metrics will indicate whether the differentiated model creates sustainable competitive advantages. Station utilization rates and attach rates on new vehicles provide leading indicators.
Policy developments around Chinese EV subsidies, ADR status, and trade relations create meaningful tail risks that don’t show up in traditional fundamental analysis.
Our Tactical Approach
Given the momentum versus fundamentals tension, our approach focuses on tactical participation rather than long-term accumulation. Start small with 1-2% position sizing, add only on confirmed strength above resistance, and maintain strict invalidation levels.
The key insight from our analysis: NIO offers trading upside on confirmation, but fundamentals remain sub-par for current valuation levels. This suggests tactical participation rather than buy-and-hold strategies.
For investors seeking entry points, wait for either price to reach Primary Buy zones ($3.6-$4.4) or sustained fundamental improvement that lifts fair value estimates into the current price range.
Master Metrics Table
| Metric | Value | Metric | Value |
|---|---|---|---|
| Current Price | $7.37 | 52-Week Range | $3.02 – $7.71 |
| Market Cap | $17.8B | Fair Value (SR) | $4.52 |
| Margin of Safety | -39% | Shares Outstanding | 2.11B |
| Sales (TTM) | $9.75B | Forward Sales | $13.8B |
| Sales Growth (5Y Avg) | 55.8% | Next Year Growth Est | 41.0% |
| Gross Margin | 10.3% | Operating Margin | -32.5% |
| Net Margin | -35.0% | ROIC | -84.2% |
| Current Ratio | 0.8 | Quick Ratio | 0.7 |
| Debt/Equity Ratio | 52.8% | Interest Coverage | -25.3 |
| Altman Z-Score | -1.1 | Piotroski F-Score | 5 |
| Beta (3Y) | 0.752 | Volatility (1Y) | 67.1% |
| YTD Return | +69.0% | 1-Month vs S&P 500 | +35.4% |
| EPS (TTM) | -$1.62 | EPS Est. Next Year | -$4.68 |
| FCF Per Share | -$1.10 | Net Cash Per Share | -$0.75 |
| Institutional Ownership | 68.6% | Short % of Float | 11.7% |
| Cost of Equity | 17.0% | WACC | 15.3% |
| Max Drawdown (5Y) | -95.0% | Quality Score | 14 |
| Sentiment Score | 96 | Value Score | 34 |


Leave a comment