
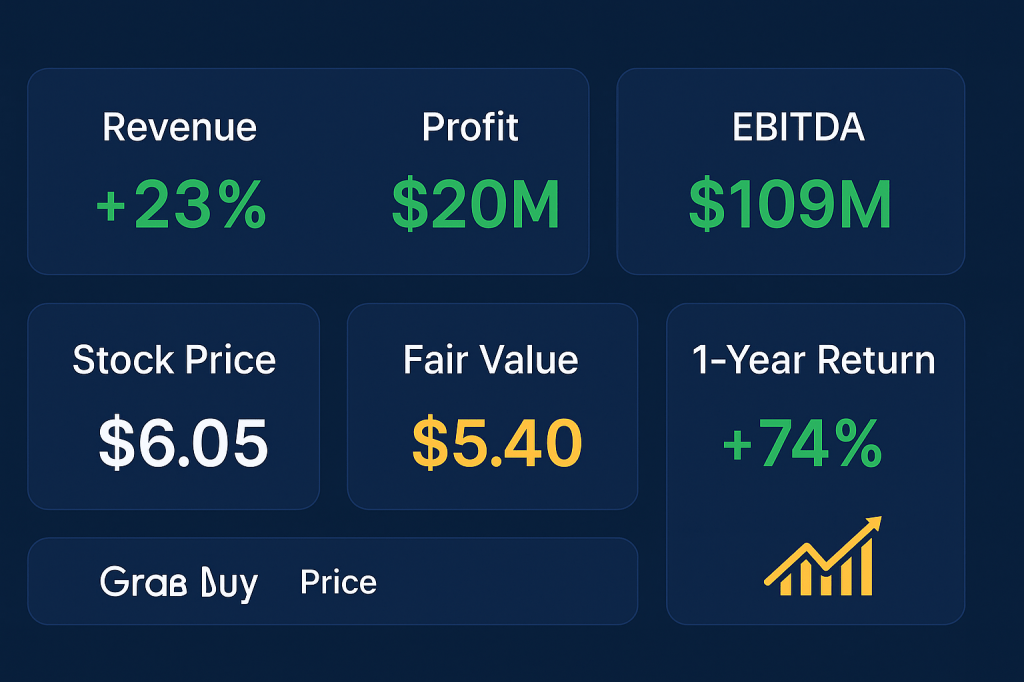
Grab just delivered its strongest quarter in years—Q2 2025 revenue surged 23% to $819M while swinging to $20M profit and record $109M adjusted EBITDA—yet the stock at $6.05 sits uncomfortably close to full valuation. The Southeast Asian super-app flywheel is clearly working: 46.2M monthly users generated $5.4B in on-demand GMV while advertising revenue rocketed 45% annually. But momentum has pushed shares 74% higher over 12 months, leaving disciplined investors facing a classic growth stock dilemma.
The investment opportunity (and challenge)
This is a tale of execution meeting expectation. Grab’s super-app strategy—combining ride-hailing, food delivery, payments, and advertising in a single platform—is delivering the scale economics everyone hoped for. The company finally turned profitable while maintaining strong growth across all segments. Yet at current prices, the market has already priced in considerable optimism.
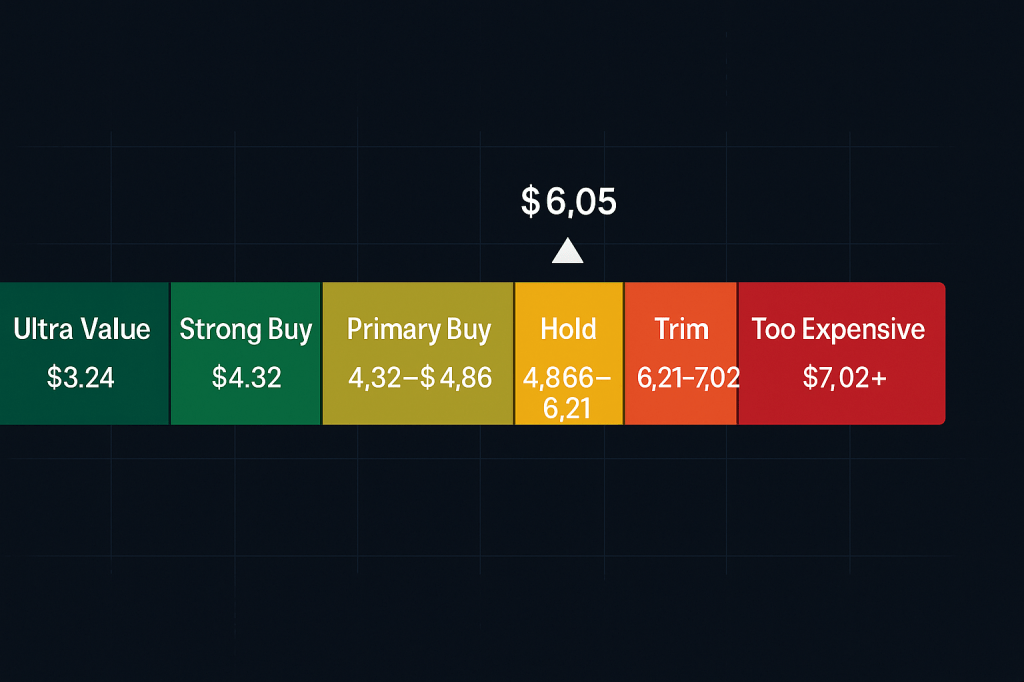
Our verdict: Grab deserves a place in growth portfolios, but entry discipline matters enormously. The stock sits in our upper Hold zone near $6, with Primary Buy opportunities emerging only on pullbacks toward $4.32-$4.86. Patient investors should let momentum cool before building meaningful positions.
What Grab actually does (beyond the buzzwords)
Grab operates Southeast Asia’s leading super-app across eight countries, with dominant positions in ride-hailing and food delivery. Think of it as combining Uber, DoorDash, and PayPal into one platform, then adding advertising revenue on top. Users book rides, order food, pay bills, take loans, and small businesses advertise—all through Grab’s ecosystem.
The magic happens in the network effects: more riders attract more drivers, more restaurants attract more customers, more users generate more advertising demand. Singapore, Indonesia, and Malaysia drive over 70% of revenue, giving Grab defendable scale in high-density urban markets where super-apps work best.
The 5 numbers that matter right now
Revenue acceleration: Q2 2025 revenue hit $819M, up 23% year-over-year, marking clear re-acceleration from recent quarters.
Profitability inflection: Net profit of $20M in Q2 versus $68M loss a year ago, while adjusted EBITDA reached record $109M.
Scale indicators: On-demand GMV of $5.4B (+21% YoY) from 46.2M monthly transacting users shows healthy unit economics.
High-margin growth: Advertising revenue run-rate of ~$236M (+45% YoY) adds leverage to the Deliveries segment without incremental costs.
Technical momentum: Price sits above both 50-day EMA ($5.15) and 200-day MA ($4.83), confirming the uptrend but signaling extended conditions.
Why this matters now (the compelling case)
The flywheel effect is becoming visible in the numbers. Mobility transactions grew 23% while Deliveries GMV expanded 22%, showing broad-based strength rather than one-segment dependence. More importantly, advertising penetration and self-serve capabilities are expanding margins without requiring additional user acquisition spending.
Financial services through GXS Bank and GrabFin are scaling responsibly—loan portfolio grew 78% while maintaining credit discipline. Management targets segment breakeven by second half 2026, adding another profit center to the model.
The company maintains $7.6B liquidity including $5.7B net cash after recent convertible bond offerings, providing runway for expansion and opportunistic buybacks ($274M repurchased in Q2 alone).
Risk factors that could derail the thesis
Competition remains brutal across all segments. Foodpanda, GoTo, and local players continue aggressive pricing, keeping customer acquisition costs elevated and requiring ongoing incentive spending to maintain market share.
Credit risk is rising alongside loan growth. Expected credit loss provisions ticked higher, and fintech operations require careful monitoring as the portfolio scales. Any deterioration in consumer creditworthiness could quickly impact profitability.
Macro headwinds and foreign exchange volatility create additional uncertainty. Southeast Asian economies remain sensitive to global trade tensions and commodity price swings, potentially affecting consumer discretionary spending.
The stock’s 74% gain over 12 months creates technical risk. RSI levels suggest overbought conditions, making pullbacks probable even if fundamentals continue improving.
Valuation framework (where fair value actually sits)
We blend multiple approaches to determine fair value:
External anchors: Stock Rover Fair Value Estimate of $5.00 (September 2025) and Morningstar’s $5.10 estimate (November 2024) provide conservative baselines.
Internal analysis: Our DCF/multiples cross-check suggests $6.20, reflecting higher confidence in the advertising margin expansion story.
Blended approach: Weighting 40% Morningstar, 30% Stock Rover, 30% internal analysis yields $5.40 fair value.
This translates into disciplined buy zones:
- Ultra Value: ≤ $3.24 (40% below fair value)
- Strong Buy: ≤ $4.32 (20% below fair value)
- Primary Buy: $4.32-$4.86 (10-20% below fair value)
- Hold/Fair Value: $4.86-$6.21 (fair value to +15%)
- Trim Territory: $6.21-$7.02 (+15% to +30%)
- Too Expensive: ≥ $7.02 (≥30% premium)
At $6.05, Grab sits in the upper Hold zone, flirting with Trim territory.
Scenario analysis (what returns look like from here)
Base case (50% probability): Steady 18-22% revenue growth with continued advertising mix shift and gradual margin expansion leads to $5.50-$6.30 target range over 12 months.
Bull case (35% probability): Stronger advertising attach rates, Indonesia over-delivery, and reduced competitive intensity drive $6.80-$7.50 potential.
Bear case (15% probability): Competitive pressure intensifies, credit losses spike, or macro deterioration leads to $4.60-$5.20 range.
Our Monte Carlo simulation using 52% annual volatility and 12% drift suggests median 12-month price of $6.05 with 50.3% probability of loss—essentially a coin flip from current levels.
Technical picture (trend and key levels)
The chart shows classic momentum extension. Price cleared 12-month highs while trading above both 50-day ($5.15) and 200-day ($4.83) moving averages. Volume patterns confirm institutional accumulation, but RSI readings suggest near-term overbought conditions.
Support levels: First support at 50-day EMA ($5.15), then 200-day MA cluster around $4.83. Breaking below $4.83 would signal trend change.
Resistance zones: Initial resistance $6.25-$6.60 (our Trim zone), then psychological $7.00 level.
Trading strategy: Don’t chase current levels. Scale into positions on any pullback toward $4.86, with larger allocations below $4.32. Existing holders can use trailing stops below the 50-day EMA with appropriate buffer.
Position sizing and risk management
Start small in the Primary Buy zone ($4.32-$4.86) with 0.5-1% initial positions. Scale to 2-3% maximum allocation on weakness toward Strong Buy levels. The 52% volatility and evolving competitive dynamics warrant conservative sizing until cash flow quality improves further.
Consider this a “quality growth at full price” situation rather than a deep value opportunity. Position sizes should reflect both the company’s improving fundamentals and current valuation stretch.
How this fits in your portfolio
Grab offers exposure to Southeast Asian digital transformation with a proven business model showing inflection toward profitability. The super-app strategy creates multiple revenue streams and defensive characteristics once network effects solidify.
However, this isn’t a “set and forget” holding at current prices. Active monitoring of competitive dynamics, credit quality, and margin progression is essential. The stock works best as a 2-3% growth allocation with clear add/trim discipline around our prescribed zones.
For conservative investors, wait for Primary Buy opportunities. Growth investors comfortable with volatility can initiate small positions but should avoid concentration risk given the extended valuation.
The bottom line
Grab has evolved from cash-burning disruptor to profitable growth story, validating the super-app thesis in Southeast Asian markets. The Q2 results demonstrate operational leverage across segments while maintaining market leadership.
Yet the stock price already reflects significant optimism. At $6.05, risk/reward favors patience over chase. Build positions gradually on pullbacks toward $4.32-$4.86, trim into strength above $6.20, and size conservatively given the volatility profile.
The business quality merits ownership—the price requires discipline.
Master Metrics Table
| Metric | Value | Context & Significance |
|---|---|---|
| Current Price (Sep 12, 2025) | $6.05 | Near upper Hold zone boundary |
| Q2 2025 Revenue Growth | +23% YoY to $819M | Clear re-acceleration trend |
| Q2 2025 Net Profit | $20M | First profitable quarter vs -$68M year ago |
| Adjusted EBITDA | $109M | Record level, showing operational leverage |
| On-Demand GMV | $5.4B (+21% YoY) | Scale indicator with 46.2M MTUs |
| Advertising Revenue Run-Rate | ~$236M (+45% YoY) | High-margin growth driver |
| Blended Fair Value Estimate | $5.40 | 40% Morningstar, 30% Stock Rover, 30% internal |
| Primary Buy Zone | $4.32-$4.86 | 10-20% below fair value |
| 50-Day EMA | $5.15 | First technical support level |
| 200-Day Moving Average | $4.83 | Major trend support |
| Vulcan Composite Score | 5.34/10 | Middle tier for growth tech |
| 1-Year Volatility | 52% | High volatility requires conservative sizing |
| Beta (1-Year) | 1.29 | Above-market risk profile |
| Net Cash Position | $5.7B | Strong balance sheet provides flexibility |
| Altman Z-Score | 1.6 | Below 1.8 caution threshold |
Audit Table
| Field | Value | Source/Validation |
|---|---|---|
| Price Anchor | $6.05 | Yahoo Finance close Sep 12, 2025 |
| Stock Rover Report Date | Sep 14, 2025 | Current (within 2 trading days) |
| Stock Rover Fair Value | $5.00 | Stock Rover report |
| Stock Rover Margin of Safety | -17% | Above fair value |
| Morningstar Fair Value | $5.10 | November 2024 estimate |
| Internal DCF/Multiples | $6.20 | Vulcan analysis |
| Blended Fair Value | $5.40 | Weighted average calculation |
| Q2 2025 Results | Rev $819M, Profit $20M, EBITDA $109M | Company earnings release |
| 1-Year Return | +73.9% | Stock Rover performance data |
| YTD Return | +27.1% | Year-to-date performance |
| Monte Carlo 12M Median | $6.05 | 10,000 path simulation |
| Probability of 12M Loss | 50.3% | Monte Carlo output |
| Scenario Weightings | Bull 35%, Base 50%, Bear 15% | Vulcan methodology |
| Current Ratio | 1.9 | Stock Rover balance sheet data |
| Debt/Equity Ratio | 0.3 | Conservative leverage |
| Interest Coverage | -4.0 | Warning flag per Stock Rover |
| Short Interest | 5.5% of float | Moderate bearish sentiment |
| Next Earnings Date | Nov 10, 2025 | Scheduled Q3 report |
Data as of September 14, 2025. All price targets and zones subject to revision based on new information.


Leave a comment