When Archer Aviation surged 190% in twelve months while trading 25% below its intrinsic value, and Joby Aviation hit $20.95 peaks while trading 50% above fair value, the market sent a crystal-clear message: execution trumps headlines every time. Despite Joby completing the world’s first piloted eVTOL flight between public airports in August 2025, sophisticated money is flowing toward the undervalued underdog with a 3.1 beta and bulletproof balance sheet.
Here’s why our Monte Carlo simulation shows Archer delivering +20% expected returns while Joby faces slightly negative prospects—and what it means for your portfolio.
The $6 Billion Valuation Gap That Changes Everything
The numbers don’t lie, but they do whisper secrets. Archer Aviation commands a $4.2 billion enterprise value trading at roughly 20× its 2026 estimated sales. Joby? A staggering $10.2 billion EV at 98× forward sales multiples. When you’re paying nearly five times more for similar technology and timeline, you better get perfection.
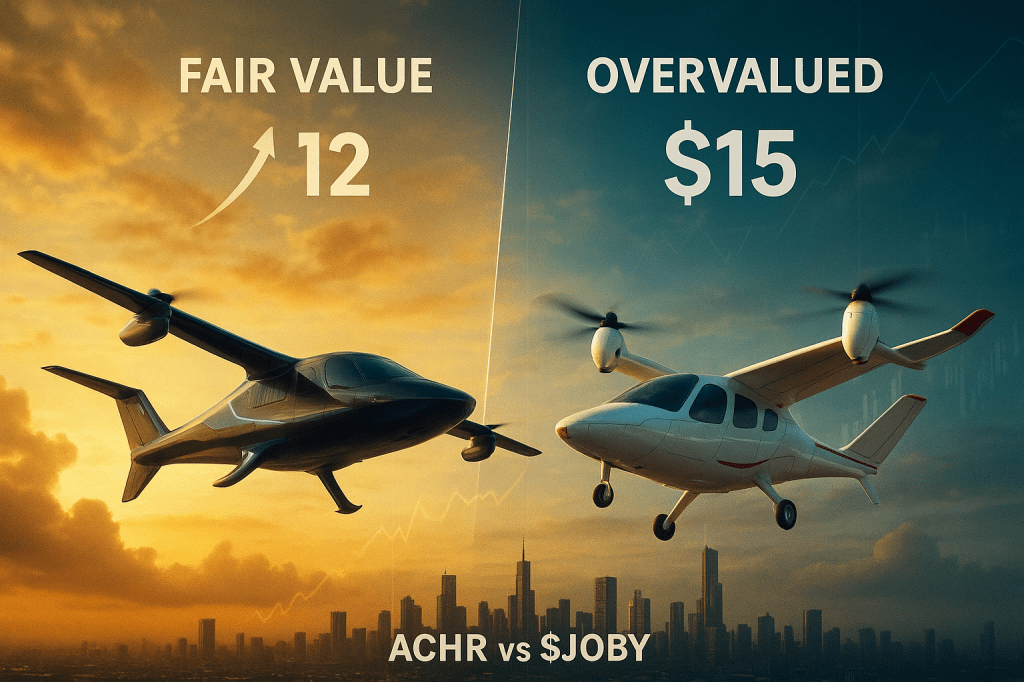
Our scenario-weighted DCF analysis—using 60% base case, 20% bull, and 20% bear probabilities—reveals fair values that should make every growth investor pause: $12 per share for Archer versus $10 for Joby. At current prices around $9 for ACHR and $15 for JOBY, Archer offers a 33% margin of safety while Joby trades at a 50% premium to intrinsic value.
The market is essentially pricing Joby for its bull case while Archer still trades below base case assumptions. That’s a risk-reward setup that would make Benjamin Graham proud—if he invested in flying cars.
The Pentagon’s Diversification Playbook
While Joby laser-focused on becoming the “Uber of the skies,” Archer quietly built what defense strategists call “optionality insurance.” The company’s recent acquisitions of military composite suppliers and tiltrotor IP through partnerships with Anduril aren’t just business moves—they’re chess moves three steps ahead.
This diversification shows up where it matters most: cash flow predictability. Military contracts provide non-dilutive funding and credible revenue streams while commercial eVTOL adoption still faces the classic “chicken-and-egg” infrastructure problem. Archer’s conditional United Airlines order for 200 aircraft, combined with U.S. Air Force partnerships, creates multiple pathways to success.
The balance sheet story reinforces this strategic advantage. Archer ended Q2 2025 with $1.8 billion in liquidity versus Joby’s $991 million—both impressive war chests, but Archer’s provides longer runway while burning similar $300-400M annually on development. More critically, Archer’s current ratio of 22.3 and debt-to-equity of just 0.05 creates what analysts call a “fortress balance sheet” in uncertain times.
The Technical Breakdown Wall Street Missed
Here’s where our analysis gets surgical. Both stocks experienced climactic runs in mid-2025, but their technical consolidation patterns tell different stories about institutional sentiment.
Joby peaked at $20.95 in July before retracing to current levels around $14-15, forming what appears to be a consolidation range between $13-17. The stock’s 14-day RSI cooled from overbought levels above 70 to the mid-50s, while MACD crossed negative but is flattening—suggesting selling momentum is fading but upside remains capped.
Archer’s journey proved more volatile but ultimately more constructive. After hitting $13.92, it pulled back sharply to $8.50 before rebounding toward $10—a classic “shakeout” pattern that flushed out weak hands. Critically, the stock found support right at its 200-day moving average around $9.39, suggesting institutional accumulation at technically significant levels.
The insider trading patterns reveal the real story: Archer insiders have been net buyers (bullish signal), while Joby’s management took profits during the rally. When executives put their own money where their mouth is, sophisticated investors notice.
The Monte Carlo Reality Check
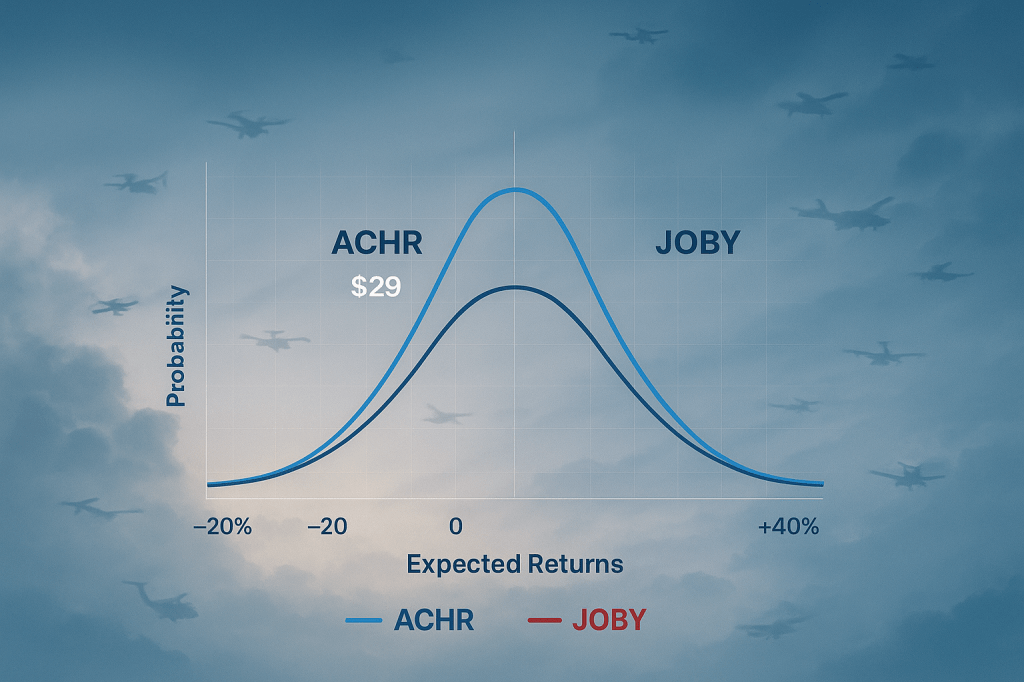
Our 10,000-trial Monte Carlo simulation reveals the brutal mathematics of current valuations. Archer shows an expected 1-year return of +20% with approximately 45% probability of loss, while Joby delivers slightly negative expected returns with over 50% probability of loss.
The distribution spreads tell an even more compelling story:
- Archer’s 95th percentile: ~$29 (220% upside potential)
- Archer’s 5th percentile: ~$4 (55% downside risk)
- Joby’s 95th percentile: ~$35 (135% upside potential)
- Joby’s 5th percentile: ~$5 (67% downside risk)
Translation: Archer offers better upside-to-downside ratios from current levels, with median outcomes favoring patient investors willing to stomach 3.1 beta volatility.
The Analyst Rebellion That Exposed Everything
The most revealing signal came from unexpected sources: analyst downgrades during good news cycles. Canaccord raised Joby’s price target from $12 to $17 while simultaneously cutting the rating to “Hold”—essentially saying “great company, wrong price.”
Current analyst consensus paints the picture clearly:
- Archer: 8 Buy ratings, 1 Hold (Moderate Buy consensus)
- Joby: 2 Buy ratings, 4 Hold (Hold consensus)
- Price targets: ACHR $10-18 range vs. JOBY $7-17 range
When even bullish analysts see 12-month downside risk in Joby while maintaining upside conviction in Archer, the Street’s real opinion becomes obvious.
The Fed’s $100 Billion Wild Card
Our tornado sensitivity analysis reveals the market’s dirty secret: eVTOL valuations are exquisitely sensitive to interest rate assumptions. A 1% increase in weighted average cost of capital slashes fair value by roughly 20% due to long-duration cash flow profiles.
Current macro conditions flag a “Rate-Spike” environment with inverted yield curves and restrictive Fed policy—exactly the backdrop that punishes richly valued growth stocks while rewarding companies with stronger near-term cash flow visibility.
This macro reality favors Archer’s mixed commercial-defense strategy over Joby’s pure-play urban air mobility bet. Defense spending provides more predictable cash flows in volatile rate environments.
The Execution Risk Matrix
Both companies face massive execution risks, but probability-weighted scenarios favor different outcomes:
Base Case (60% probability): Both achieve FAA certification by 2025-26, begin limited commercial operations. Archer appreciates to mid-teens (~$13-14), delivering 44% upside. Joby trades sideways or down to $10-11 as valuation normalizes.
Bull Case (20% probability): Rapid adoption, network effects, scaling success. Archer could reach low-$20s (140% upside), Joby mid-$20s (65% upside from current levels).
Bear Case (20% probability): Delays, safety issues, or economic recession. Both stocks drop to low-single-digits, with value determined primarily by cash positions.
The Smart Money Play
For growth investors seeking eVTOL exposure, the mathematics strongly favor Archer Aviation at current prices. Here’s the actionable framework:
Position Sizing Strategy
- Maximum allocation: 2-3% of total portfolio (satellite position only)
- Entry approach: Dollar-cost average on weakness rather than lump-sum buying
- Risk management: Stop-loss at 50% position decline to preserve capital
Specific Buy/Sell Zones
Archer Aviation (ACHR):
- Strong Buy Zone: Under $8 (30% discount to fair value)
- Current Zone: $8-10 (Buy/Accumulate range)
- Trim Zone: Above $15 (premium to bull case)
- 12-Month Target: $13 (44% upside)
Joby Aviation (JOBY):
- Buy Zone: Under $10 (at fair value)
- Current Zone: $13-17 (Hold/Reduce range)
- Strong Sell: Above $20 (extreme overvaluation)
- 12-Month Target: $10 (33% downside from $15)
The Infrastructure Reality Nobody Discusses
The elephant in the room remains infrastructure deployment. Urban air mobility requires massive coordination between aircraft manufacturers, vertiport developers, air traffic management systems, and regulatory bodies. This “ecosystem complexity” creates natural barriers to rapid scaling—but also massive first-mover advantages for companies that execute successfully.
Archer’s partnership approach with United Airlines and Stellantis creates multiple stakeholders invested in success, while Joby’s vertically integrated model provides more control but also more execution risk.
The Verdict: Betting the Undervalued Underdog
In a market that rewards execution over promise, Archer Aviation offers superior risk-adjusted returns for patient capital. The company trades below fair value while maintaining multiple pathways to profitability—exactly the setup sophisticated investors hunt for in emerging industries.
This isn’t a prediction that Joby will fail. The company’s technical achievements are remarkable, and first-mover advantages often prove durable in winner-take-all markets. But at 50% premiums to intrinsic value, Joby investors are paying for perfection in an industry where Murphy’s Law writes the playbook.
The sophisticated play: Accumulate Archer on any weakness below $10, treat Joby as a trading vehicle around the $10-15 range, and size both positions for maximum 2-3% portfolio allocation. In the race to revolutionize transportation, sometimes the tortoise with the fortress balance sheet beats the hare with the premium valuation.
The sky’s the limit—but only if you don’t overpay for the ticket.
Position Disclosure: This analysis reflects probability-weighted scenarios based on current data and should not constitute investment advice. eVTOL stocks involve substantial risk and regulatory uncertainty. Consult qualified advisors before making investment decisions.


Leave a comment