
The AI boom isn’t just transforming how we work—it’s creating a massive infrastructure investment opportunity that most retail investors are missing. While everyone chases the next hot tech stock, a diversified global infrastructure powerhouse is quietly positioning itself at the center of the digital revolution, offering a compelling 5.7% yield with credible mid-teens total return potential.
In a market obsessed with growth-at-any-cost technology plays, Brookfield Infrastructure Partners (NYSE: BIP) represents something increasingly rare: a high-quality, income-generating asset that’s both defensively positioned and offensively leveraging secular tailwinds. Trading at $29.95 as of August 14th, BIP sits squarely in our “Primary Buy” zone, offering patient investors a rare combination of yield, growth, and downside protection that’s becoming harder to find in today’s frothy markets.
The Hidden Infrastructure Play Behind the AI Revolution
While headlines focus on NVIDIA’s chips and Microsoft’s cloud services, the real infrastructure backbone enabling the AI revolution remains largely invisible to most investors. Every AI model requires massive computational power housed in data centers that consume enormous amounts of electricity, connected by fiber networks spanning continents, and cooled by sophisticated utility systems.
This is where BIP’s strategic positioning becomes compelling. The partnership operates a diversified portfolio of essential infrastructure assets across utilities, transport, midstream, and data infrastructure—exactly the “picks and shovels” benefiting from AI’s explosive growth. In Q2 2025, BIP’s data segment delivered a remarkable 45% year-over-year FFO growth, directly reflecting this digital transformation.
But here’s what makes BIP particularly attractive: unlike pure-play data center REITs or technology infrastructure companies that trade at premium valuations, BIP’s diversified approach provides multiple revenue streams and geographic exposure while maintaining an attractive entry valuation.
Dissecting the Numbers: Why the Scary Headlines Are Wrong
Recent analysis from various research platforms has highlighted some concerning-looking metrics for BIP—sky-high P/E ratios, massive payout ratios, and elevated leverage metrics. But dig deeper, and these apparent red flags reveal the analytical traps that often ensnare retail investors in partnership structures.
The key insight? BIP doesn’t operate like a traditional corporation. As a limited partnership using IFRS accounting, GAAP-based earnings metrics become largely meaningless due to depreciation schedules, foreign exchange translations, and mark-to-market adjustments that bear little relation to actual cash generation.
What matters for BIP—and what management focuses on—is Funds From Operations (FFO). In Q2 2025, BIP generated $638 million in FFO, translating to $0.81 per unit, representing solid 5% year-over-year growth. When compared to the partnership’s $0.86 in cash distributions paid during the first half of 2025, this reveals a healthy 53% payout ratio on FFO—comfortably within management’s targeted 60-70% range.
This distinction is crucial for retail investors evaluating BIP. The partnership maintains excellent dividend coverage on the metrics that actually matter, despite what traditional screening tools might suggest.
A Fortress Balance Sheet in Uncertain Times
One area where BIP truly shines is financial stability. The partnership maintains a BBB+ investment-grade rating from Fitch, which was reaffirmed with a stable outlook in July 2025. More importantly, BIP’s debt structure is intelligently designed for the current environment: approximately 90% is fixed-rate with an average term of 8 years, providing substantial protection against interest rate volatility.
This debt profile becomes particularly valuable in a “higher-for-longer” rate environment. While many REITs and infrastructure companies face refinancing pressure, BIP’s long-dated, fixed-rate structure means the partnership can focus on operational execution rather than financial engineering. For dividend-focused investors seeking stable, growing income streams, this financial foundation provides essential peace of mind.
The Growth Engine: Asset Recycling Meets Secular Trends
BIP’s growth strategy revolves around a sophisticated capital recycling program that continuously optimizes the portfolio’s risk-return profile. Management regularly sells mature, lower-growth assets at attractive multiples and redeploys proceeds into higher-IRR opportunities aligned with secular trends.
Currently, this means significant exposure to AI infrastructure, U.S. utilities benefiting from onshoring and electrification trends, and digital infrastructure supporting the global economy’s continued digitization. The strategy is already showing results: while total revenue growth has decelerated due to asset sales, FFO per unit continues growing at healthy mid-single-digit rates.
Management’s long-term distribution growth target of 5-9% annually reflects this disciplined approach. Rather than chasing growth through leverage or risky acquisitions, BIP focuses on sustainable, cash-flow-backed distribution increases that compound over time.
Vulcan Analysis: A 7.04 Composite Score
Our comprehensive Vulcan scoring methodology assigns BIP a solid 7.04 out of 10 composite score, driven by strong performance across multiple factors:
- Value (7.50): At current prices, BIP offers an attractive 5.6-5.7% forward yield with reasonable FFO multiples
- Growth (6.80): Credible 5-9% distribution growth trajectory supported by asset recycling and secular trends
- Quality (8.10): Investment-grade balance sheet, diversified global assets, and Brookfield’s institutional sponsorship
- Momentum (4.90): Recent underperformance versus benchmarks creates opportunity for patient investors
- Safety (7.90): Contracted and regulated cash flows provide defensive characteristics
This balanced profile appeals particularly to investors seeking total return opportunities that don’t rely solely on multiple expansion or speculative growth assumptions.
Monte Carlo Analysis: Quantifying the Opportunity
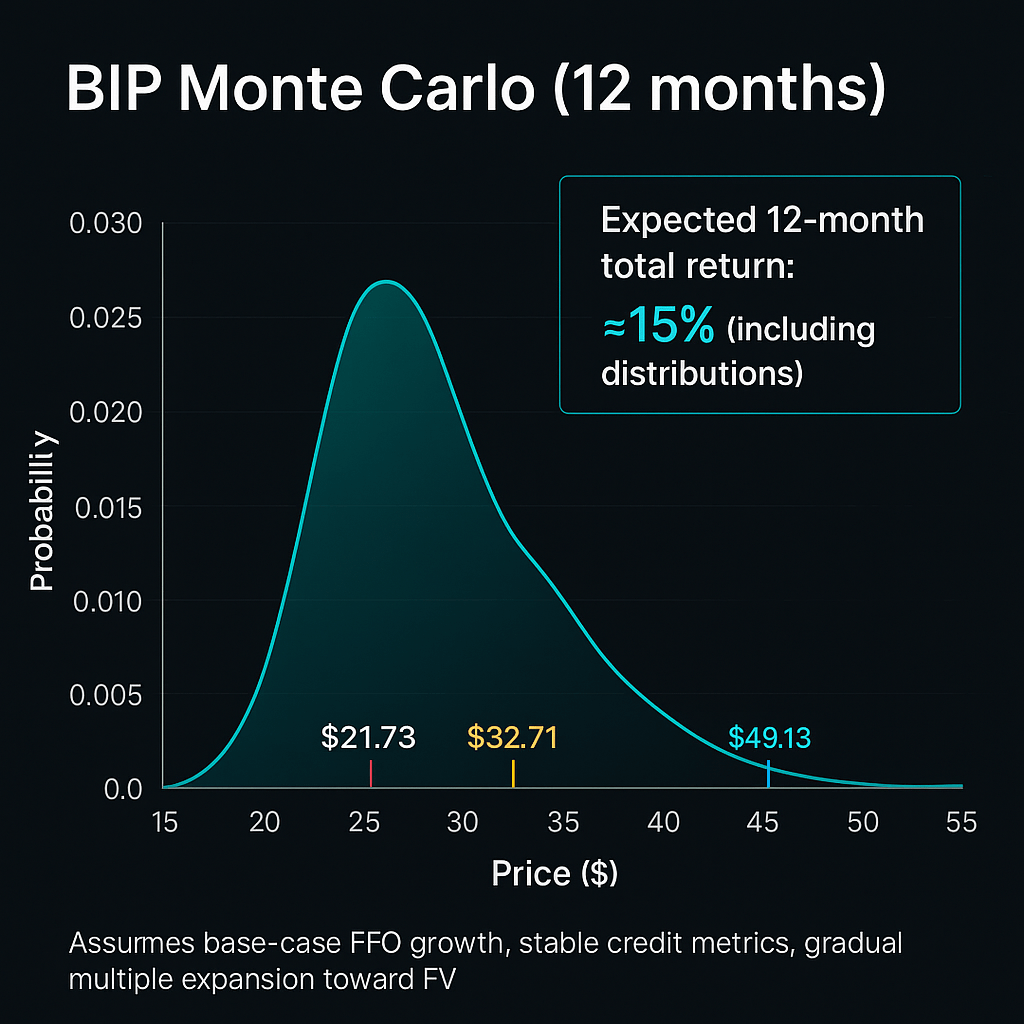
Our proprietary Monte Carlo modeling suggests compelling risk-adjusted return potential over the next 12 months. Using current market parameters and BIP’s historical volatility profile, our analysis indicates:
- Expected 12-month total return: Approximately 15% (including distributions)
- Median price target: $32.71
- 95th percentile outcome: $49.13 (nearly 70% total return potential)
- 5th percentile downside: $21.73 (approximately 22% total loss potential)
These projections assume BIP’s base-case scenario of continued FFO growth, stable credit metrics, and gradual multiple expansion toward fair value. The asymmetric risk-reward profile—with upside potential significantly exceeding downside risk—makes BIP particularly attractive for risk-conscious total return investors.
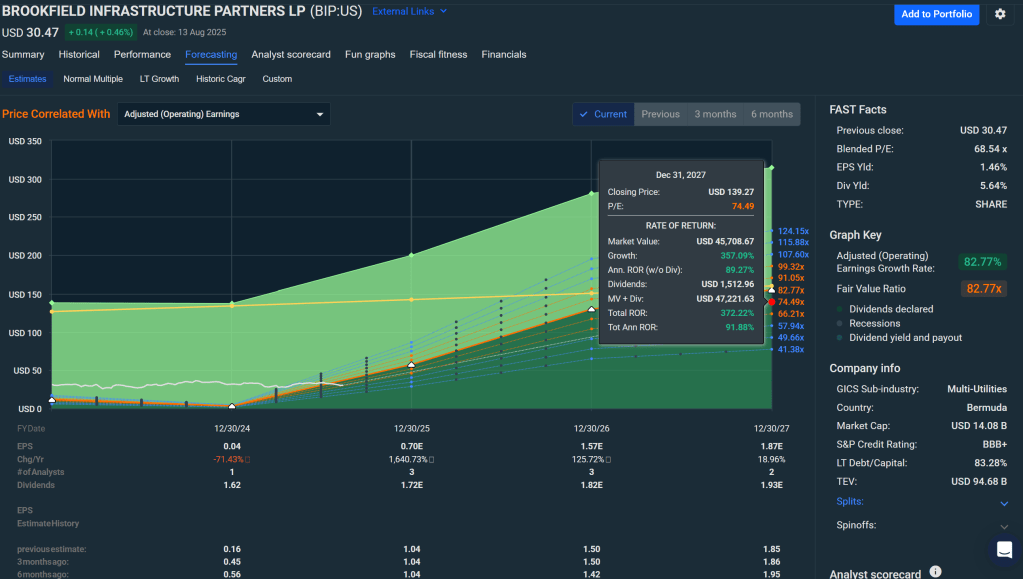
Fair Value Analysis: Multiple Paths to $35
Our blended fair value approach triangulates BIP’s intrinsic worth using both dividend discount modeling and third-party research. The dividend discount model, anchored on a $1.72 annual distribution, 6.5% growth rate, and 11% required return, suggests a $40.70 fair value. However, we blend this with Morningstar’s more conservative $30.98 fair value estimate to arrive at a blended target of approximately $34.87.
At current prices near $30, BIP trades at roughly a 14% discount to our fair value estimate, placing it firmly in “Primary Buy” territory. This discount provides a meaningful margin of safety while offering multiple paths to value realization.
Risk Management: What Could Go Wrong
No investment case is complete without acknowledging potential headwinds. For BIP, key risks include:
Interest Rate Sensitivity: Despite largely fixed-rate debt, persistent “higher-for-longer” monetary policy could pressure infrastructure multiples and increase future refinancing costs.
Foreign Exchange Translation: BIP’s global footprint exposes FFO to currency fluctuations, particularly USD strength versus emerging market currencies where several assets are located.
Execution Risk: The asset recycling strategy requires management to consistently sell assets at attractive multiples and redeploy proceeds into higher-return opportunities. Execution missteps could slow FFO growth.
Regulatory/Political Risk: Infrastructure assets face ongoing regulatory and political oversight that could impact cash flows or growth prospects.
Investment Recommendation and Position Sizing
Based on our comprehensive analysis, we rate BIP a Buy in the $26-31 range, with the stock’s current $29.95 price sitting comfortably within our Primary Buy zone. The investment thesis combines:
- Income Component: 5.7% current yield that should grow 5-9% annually
- Growth Component: FFO expansion driven by asset recycling and secular trends
- Value Component: Meaningful discount to intrinsic value with multiple catalysts for realization
- Defensive Component: Investment-grade balance sheet and contracted cash flows
For diversified portfolios, we suggest a 3-6% single-name weight in BIP, with income-focused mandates potentially extending to 8%. Combined Brookfield complex exposure (including BEP, BIPC, and other Brookfield entities) should remain below 12-15% to maintain appropriate diversification.
Master Metrics Table
| Metric | Value |
|---|---|
| Vulcan Score (0–10) | 7.04 |
| Pillars (V/G/Q/M/S) | 7.50 / 6.80 / 8.10 / 4.90 / 7.90 |
| Blended Fair Value | $34.87 |
| 12-mo Monte Carlo p50 (price) | $32.71 |
| 12-mo Monte Carlo p95 / p5 | $49.13 / $21.73 |
| 12-mo Base TR (incl. ~$1.72 dist’n) | ≈ ~15% |
| Buy Bands (Strong / Primary) | ≤ $26.15 / $26.15–$31.38 |
| Hold / Trim / Too Expensive | $31.38–$38.36 / $38.36–$43.59 / > $43.59 |
Audit Table (Input Validation)
| Item | Value | Source(s) | Note |
|---|---|---|---|
| Intraday price, day/52-wk range | $29.95; $29.91–$30.47; $25.72–$36.50 | Live widget + Yahoo quote | Live at 16:18:55 UTC |
| Forward yield (approx.) | ~5.6–5.7% | Yahoo (TSX listing stats), DividendMax | Range triangulated |
| Dist’n growth band | 5–9% | BIP IR (fact sheet; site) | Long-term target reiterated |
| Credit rating | BBB+ | Fitch + BIP corporate profile | Affirmed July 23, 2025 |
| Q2’25 FFO / NI | $638m / $69m | Yahoo News + IR PR | Headline figures match |
| Morningstar FVE | $30.98 (8/13/25) | Morningstar | Used in FV blend (60%) |
| Volatility proxy | ~24.9% (360d) | Solactive BIP-linked index | Used for MC/Bayesian σ |
| DDM inputs | D₀≈$1.72; g=6.5%; r=11% | BIP factsheet, house view | Yields FV≈$40.7; blended with M* |
| Model checksum (MC/Bayes/DCF block) | 494ea5c2257dd116…20d | Local manifest (saved) | File: BIP_audit_manifest.json |
The investment thesis for BIP combines compelling fundamentals with attractive risk-adjusted return potential in an environment where such opportunities are increasingly scarce. For patient investors willing to look beyond headline metrics and focus on cash-flow fundamentals, BIP offers a rare combination of yield, growth, and value that’s hard to find elsewhere in today’s market.


Leave a comment