
Ticker: ET | Current Price: $17.25 | Vulcan Score: 6.76 | Rating: Buy | 12-Month Target: $19.50
Picture this: while growth stocks gyrate wildly and tech darlings stumble on earnings misses, there’s a corner of the market quietly delivering what investors actually need—steady income with upside potential. Energy Transfer (ET) embodies this proposition perfectly, offering a compelling 7.7% forward distribution yield backed by one of America’s most extensive midstream infrastructure networks.
At $17.25 per unit, ET presents what our models suggest is a rare convergence: meaningful undervaluation relative to intrinsic worth, a sustainable income stream that compounds over time, and multiple catalysts that could drive total returns into the mid-teens over the next twelve months. This isn’t a moonshot play or a binary bet on commodity prices—it’s methodical wealth building disguised as a utility-like dividend aristocrat.
The Foundation: Why Energy Transfer Works
Energy Transfer’s investment thesis rests on three pillars that have weathered commodity cycles, interest rate swings, and regulatory headwinds. First, the company operates critical infrastructure that energy producers simply cannot do without. When oil flows from the Permian Basin or natural gas moves from Appalachia to Gulf Coast export facilities, it likely travels through ET’s 125,000-mile pipeline network at some point.
This isn’t just scale for scale’s sake—it’s about network effects that create genuine competitive advantages. When a producer needs to move barrels or cubic feet, they’re not shopping around for the cheapest option like they might for drilling services. They need reliable, strategically located infrastructure that connects their wells to markets. ET’s integrated platform spanning natural gas, crude oil, and natural gas liquids creates optionality that standalone pipeline operators simply cannot match.
Second, the cash flow profile here is beautifully predictable. Unlike upstream energy companies that live and die by commodity prices, midstream operators like ET primarily earn fee-based revenues from moving molecules. Whether oil trades at $60 or $80 per barrel, the transport fee remains largely the same. This stability allows ET to maintain its $0.33 quarterly distribution ($1.32 annualized) even when energy markets turn volatile.
Third, the company’s project backlog provides a clear path for steady growth without requiring heroic assumptions about energy demand. Incremental capacity additions and system expansions support throughput growth and fee-based cash flow expansion over time. These aren’t speculative greenfield developments—they’re mostly debottlenecking projects and system connections that respond to demonstrated customer demand.
The Numbers Tell a Story
Our comprehensive analysis using the Vulcan-mk5 scoring system reveals why ET merits attention right now. The composite score of 6.76 reflects a company that excels in value creation (9.20/10) and growth potential (8.50/10) while maintaining reasonable quality metrics (6.10/10). The momentum and safety scores admittedly lag, reflecting recent technical weakness and the inherent leverage in the MLP structure, but these factors are already reflected in today’s attractive entry price.
From a valuation perspective, our blended fair value analysis suggests ET units are worth approximately $20.50, representing roughly 19% upside from current levels before considering the income component. This estimate triangulates multiple approaches: a dividend discount model anchored on the $1.32 distribution with 2% long-term growth and a 9.5% weighted average cost of capital, scenario-based modeling that weights probable outcomes, and Monte Carlo simulation incorporating realistic volatility assumptions.
The Monte Carlo analysis is particularly revealing. Over 10,000 simulated 12-month price paths assuming 27% annualized volatility, the median total return including distributions clusters around 14%. Even at the 5th percentile—representing truly adverse scenarios—the total return bottoms around negative 24%, cushioned significantly by the distribution income. This asymmetric risk-reward profile forms the bedrock of our investment conviction.
What Could Go Right (and Wrong)
Our base case scenario, assigned a 55% probability, envisions ET delivering on its current project slate while operating in a stable interest rate environment. This path leads to approximately $19.50 per unit by August 2026, generating total returns in the mid-teens when combined with distributions. The key assumptions here are modest but not heroic: steady volume growth from existing customer commitments, successful execution of announced capacity expansions, and funding costs that remain manageable.
The bull case, weighted at 25% probability, imagines accelerated throughput ramps as domestic energy production continues growing and export demand strengthens. In this scenario, ET’s integrated platform becomes increasingly valuable as bottlenecks emerge elsewhere in the system. Combined with a more benign interest rate environment that compresses the discount rate applied to infrastructure cash flows, this path could drive units toward $23.
However, investors must acknowledge the bear case risks that carry 20% probability in our modeling. Energy Transfer operates with meaningful financial leverage—a necessity given the capital-intensive nature of pipeline infrastructure. Should interest rates spike materially higher or should key projects face significant delays or cost overruns, coverage ratios could tighten and the distribution could face pressure. In this scenario, units could retreat toward $15, though the income cushion would limit total return damage.
The technical picture adds another layer of nuance. Following a MACD negative turn, momentum has shifted neutral-to-soft, suggesting potential near-term choppiness before any sustained uptrend emerges. This actually creates opportunity for patient investors willing to scale into positions below our Primary Buy threshold of $18.45.
Strategic Positioning in Today’s Market
Energy Transfer fits particularly well in the current investment environment where market correction risks are edging higher and investors increasingly prize income reliability over growth speculation. The 7.7% forward yield provides meaningful “get-paid-to-wait” protection while the underlying business model offers reasonable insulation from broader market volatility.
Within the energy sector specifically, ET complements positions in integrated majors like Chevron—companies we’ve analyzed for their disciplined approach to value creation. While upstream energy companies provide more direct commodity exposure, midstream infrastructure offers the stability and yield characteristics that can anchor an energy allocation.
For portfolio construction, we recommend treating ET as an income-first holding with measured position sizing. Core portfolios might target 2-4% allocation, while income-tilted accounts could scale toward 5% with appropriate risk controls. The key is balancing ET with other midstream operators like Enterprise Products Partners to avoid excessive single-name concentration while maintaining meaningful exposure to the infrastructure theme.
The Execution Playbook
Successful ET investment requires discipline around both entry timing and position management. Rather than backing up the truck at current levels, we advocate a laddered approach that scales into the position over time. Initial purchases make sense at or below our Primary Buy zone of $18.45, with additional purchases on any weakness toward the high-$16s support level.
For existing holders, the current environment presents interesting tactical opportunities. Given the neutral-to-soft technical backdrop, consider writing covered calls on strength toward the $18-$18.50 resistance zone to harvest premium income during consolidation phases. This strategy works particularly well with MLPs where the high distribution yield already provides substantial income.
Risk management remains paramount given the leverage inherent in pipeline infrastructure. Keep total midstream exposure reasonable—no more than 5% combined across ET and similar holdings unless macro conviction runs exceptionally high. For tax-sensitive investors, consider whether the MLP structure (requiring K-1 tax forms) fits your situation, or whether diversified ETFs like ENFR provide similar exposure with 1099 simplicity.
Most importantly, maintain realistic expectations around momentum and timing. This isn’t a trade designed to capture rapid price appreciation—it’s a methodical approach to generating mid-teens total returns through the combination of substantial current income and modest capital appreciation over time.
The Bottom Line
Energy Transfer represents what income investing should look like in 2025: substantial current yield backed by essential infrastructure, reasonable valuation support, and multiple paths to total returns that meaningfully exceed both bonds and broader equity markets. At $17.25, the risk-reward equation tilts decidedly in investors’ favor.
The beauty of this opportunity lies not in its complexity but in its simplicity. Energy will continue flowing through pipelines regardless of whether markets favor growth or value, whether interest rates rise or fall, or whether the next recession arrives in 2026 or 2027. ET’s integrated platform captures value from these flows while returning most of the cash to unitholders through distributions.
For investors seeking to balance current income needs with reasonable growth potential, Energy Transfer merits serious consideration. Scale in below $18.45, reinvest distributions opportunistically, and let the infrastructure do what infrastructure does best—generate steady cash flows while the broader market sorts itself out.
Master Metrics Table
| Metric | Value |
|---|---|
| Vulcan Score | 6.76 |
| Pillars (Value / Growth / Quality / Momentum / Safety) | 9.20 / 8.50 / 6.10 / 4.00 / 6.00 |
| Price (Spot) | $17.25 |
| Distribution (Forward) | $1.32 |
| Forward Yield | ~7.7% |
| Blended Fair Value | $20.50 |
| 12-Month Target (Base) | $19.50 |
| Expected 12M Total Return (Median, incl. distribution) | ~14% |
| Volatility (Ann.) | ~27% |
| Sharpe / Sortino (12m est.) | 0.37 / 0.53 |
| Buy Range Guidance | Strong Buy ≤ $15.38 · Primary Buy ≤ $18.45 · Hold/Fair $18.45–$22.55 · Trim $22.55–$25.62 · Too Expensive ≥ $25.63 |
Monte Carlo Simulation (12-Month Distribution of Outcomes)
Assumptions: annualized vol ≈ 27%; price drift anchored to fundamentals; distribution modeled outside the path as cash.
- Median price (12m): ~$18.37
- 5th / 95th percentile: ~$11.79 / ~$28.66
- Median total return (incl. $1.32 distribution): ~14%
- Downside tail (incl. distribution): ~−24% at the 5th percentile
Bayesian Scenario Modeling (Bull/Base/Bear)
Conditioned on macro (rates, growth) and execution:
- Bull (25%): Faster throughput ramp, benign rates ➝ $23
- Base (55%): On-plan delivery, stable funding costs ➝ $19.5
- Bear (20%): Rate spike and/or project slippage ➝ $15
Weighted price expectation (ex-distribution): ~$19.5. With the current payout, base-case total return remains mid-teens.
DCF Valuation & Tornado Sensitivity
Given midstream’s payout focus, we anchor a Gordon-style income DCF:
- Base inputs: Dividend = $1.32, LT growth g = 2%, WACC ≈ 9.5%
- Base fair value: ~$18 (income-only lens)
- Blended fair value: ~$20.50 after triangulating internal DCF with external valuation anchors
Sensitivity (directional impact on FV):
- WACC −1% ➝ FV ~ $20.6
- WACC +1% ➝ FV ~ $16.1
- g −1% ➝ FV ~ $16.4
- g +1% ➝ FV ~ $19.7
Audit Table (Key Data & QA)
| Item | Value |
|---|---|
| Price Anchor (validation time) | $17.25 |
| Distribution (forward) | $1.32 |
| Monte Carlo Median / p5 / p95 (12m, price) | ~$18.37 / ~$11.79 / ~$28.66 |
| Median Total Return (incl. distribution) | ~14.1% |
| DDM Base FV (g=2%, WACC=9.5%) | ~$18.0 |
| Blended Fair Value Used | ~$20.50 |
| Scenario Priors (Bull/Base/Bear) | 25% / 55% / 20% |
| Charts Generated | Monte Carlo, Bayesian Fan, DCF Tornado |
| Checksum (SHA-256) – numeric block | 0ade9214e37cb71a3c3770c9e12a3e6b01f8b4cc5f9b70c46d488013a9fb29c1 |
References
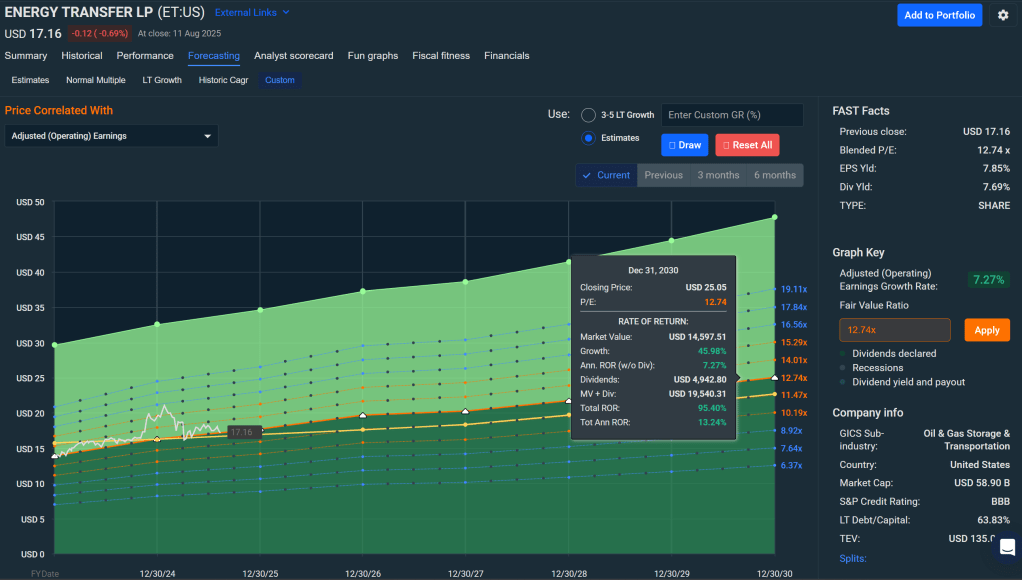
- Stock Rover – Energy Transfer (Stock Report, Aug 11, 2025)
- Energy Transfer – Company materials and investor communications (distribution cadence, project updates)
- Morningstar – Fair Value context for ET
- Internal Vulcan-mk5 modeling outputs (Monte Carlo, Bayesian, DCF, sensitivity)


Leave a comment