Summary

Altria Group (MO) remains one of the market’s most reliable income engines and a useful counterweight inside a growth‑tilted equity portfolio. At a live price of $64.19, investors are paid a forward dividend of roughly $4.08 (about a 6.3–6.4% yield) while taking balance‑sheet and cash‑flow risk that is, in our view, well understood and well compensated. Momentum has quietly turned constructive—shares are above their 50‑ and 200‑day moving averages and recently printed a 52‑week high—yet valuation is still reasonable when we blend external fair value estimates with our internal dividend‑anchored model. Using the already‑validated Stock Rover (SR) report and our DDM, we set a blended fair value near $71.6 and maintain a Buy rating with a 12‑month target range of $76–$85. For positioning, we continue to prefer MO as a core income holding of 2–4%, scaled in on pullbacks toward the rising 50‑day moving average.
Vulcan‑mk5 Score (0.00–10.00)
Composite: 7.40
Pillars: Value 8.60 | Growth 3.20 | Quality 7.80 | Momentum 7.10 | Safety 8.50
What drives this scorecard is a mix of simple truths: MO’s free‑cash‑flow support for the dividend (Value, Safety), solid profitability and balance‑sheet quality including a recent BBB+ rating (Quality, Safety), and a technical backdrop that has improved without running away from fundamentals (Momentum). Growth remains the weak pillar because the core combustibles category faces secular volume decline, and reduced‑risk products are still building share; that is understood in the rating and in our scenario work.
Top Five Takeaways
- Income first, and it’s durable. With the forward dividend at $4.08 and coverage we view as healthy, most of the 12‑month total return math comes from cash. That’s exactly what you want from an anchor position in a volatile market.
- Technical posture helps. Price above its 50‑ and 200‑day moving averages with a firm RSI signals constructive tape; if the market stumbles, MO’s low beta historically cushions drawdowns.
- Valuation is not stretched. Our internal DDM points to the mid‑$80s; SR’s fair value is in the high‑$50s. Blending the two gives us ~$71.6 and a reasonable margin to today’s price.
- Regulatory noise is the main risk. Nicotine standards, menthol rules, and youth‑access enforcement can drive headlines and short‑term volatility; persistent illicit e‑vape competition is a watch‑item.
- Optionality in non‑combustibles. Execution in NJOY and oral nicotine (on!) is not “priced for perfection.” Any acceleration here would justify raising bull‑case odds.
Why We’re Bullish (Next 12 Months)
The core of our 12‑month bullish stance is simple: the carry is excellent, the balance sheet is appropriately conservative, and the stock’s behavior suggests sentiment has swung from “avoid” to “accept.” A BBB+ credit rating and leverage near ~2×–2.1× signal limited refinancing risk in a world where rates are higher for longer. While cigarette volumes continue to trend down, pricing power and mix have historically offset a meaningful portion of that pressure. Meanwhile, management’s willingness to return cash through both dividends and buybacks remains a tailwind for per‑share metrics. The technical picture matters too: breakouts from long bases in lower‑beta income names often persist longer than investors expect, particularly when capital is rotating toward resilience and yield.
We also like MO’s U.S.‑centric risk profile. For diversified investors who already carry currency exposure elsewhere (multinationals, non‑U.S. ETFs, or ADRs), MO’s domestic cash flows act as a stabilizer. That was central to our answer when you asked whether to up‑weight BTI alone or add MO alongside it: adding MO modestly reduces FX noise while splitting single‑issuer risk, without sacrificing yield.
For readers looking to place MO within a broader income framework, two related posts on our site provide useful context about portfolio construction and risk budgeting:
• https://vulcan-stock.com/2025/06/28/pepsico-strong-buy-recommendation-supported-by-solid-returns/
• https://vulcan-stock.com/2025/07/15/second-half-2025-us-stock-market-outlook/
Risk Flags to Watch
Policy and regulation remain the biggest swing factor. A decisive move on nicotine standards or menthol could alter category economics, even if implementation timelines are long. Illicit e‑vape supply is another pressure point: counterfeit and off‑pathway products siphon share and muddy pricing; enforcement progress would be a real catalyst. Category decline is the slow burn—pricing and cost control must keep pace. Finally, execution in reduced‑risk products is essential; market leadership in oral nicotine and e‑vapor is competitive, and missteps here would dent the long‑term story.
Mid‑Term Outlook (2–3 Years)
Over a 2–3 year horizon the thesis resolves around three vectors: (1) Dividend sustainability and growth, (2) reduced‑risk product trajectory, and (3) capital allocation efficiency. We expect dividend growth in the low single digits as a base case, consistent with a conservative payout philosophy and steady FCF. If NJOY and on! show clear unit‑share gains and better regulatory clarity, our “bull” branch probabilities step higher, allowing for modest multiple expansion. Conversely, if regulatory pressure tightens while illicit competition persists, we would lean down our growth assumptions and treat buybacks as the primary offset to protect per‑share math. Net‑net, the name should continue to compound investor capital at mid‑ to high‑single‑digit annualized rates with meaningfully lower volatility than the S&P 500.
Long‑Term Outlook (5+ Years)
The long arc for MO hinges on the migration from combustibles to lower‑risk formats. The path is uneven across categories and geographies, but the destination is clear. We assume continued cigarette volume attrition, partially offset by pricing and mix, and we credit management with measured investment in non‑combustibles to keep the cash engine running while repositioning the portfolio. Because we require a margin of safety for any long‑horizon assumption, our long‑term growth input in the DDM (3.5%) is intentionally conservative; it leaves upside if execution surprises positively. Importantly, this conservative long‑term tilt is compatible with maintaining a strong dividend profile.
Investment Thesis and Peer Context
Our updated blend of fair values—SR at $58.81 and our DDM at $84.46—puts MO’s blended fair value at ~$71.64. That blend respects two different lenses. SR’s model skews more conservative on long‑term growth and discount rates, while our dividend‑anchored approach, at 8.5% WACC and 3.5% LT growth, reflects what we view as a realistic long‑run spread between cost of capital and dividend growth potential. In either case, today’s price sits below fair and the income stream remains the center of gravity.
Versus large‑cap tobacco peers, MO offers a clean USD income profile and lower FX sensitivity than global ADRs. Peers with larger international footprints and leading vapes/oral franchises deserve credit for growth, but they also import FX and policy complexity. We prefer to own both types selectively—hence our guidance: a modest sleeve in BTI plus a modest sleeve in MO is a balanced way to harvest sector income without over‑concentrating single‑issuer or currency risk. Within that sleeve, let the tape guide adds: accumulate MO on pullbacks toward the 50‑DMA, and treat sharp extensions in BTI as opportunities to wait for better entries.
Monte Carlo Simulation
We reused the validated Monte Carlo run (10,000 paths) with price‑only drift near 2% and annualized volatility around 21.6%. End‑point 12‑month price bands are approximately p5 ≈ $44.73, p50 ≈ $64.03, and p95 ≈ $91.52. Remember that this distribution is price‑only; total return improves after layering in ~$4.08 in cash dividends. Practically, that means even if the price meanders around the median, the income carries a sizable share of expected return.
What the distribution says in plain English: the left tail exists but is cushioned by the starting yield; the right tail is plausible if the tape and regulatory headlines cooperate. The center mass near today’s price underscores why we frame MO as an income compounder more than a price‑momentum vehicle.
Bayesian Scenario Modeling
Our Bayesian fan chart blends Bull (25%), Base (55%), and Bear (20%) branches conditioned on a “normalizing but not easing” macro backdrop and industry‑specific risks. The 12‑month end‑point distribution lands around p5 ≈ $44.54, p50 ≈ $64.22, and p95 ≈ $89.56. We would tilt the priors bullish if (i) FDA clarity on NJOY and oral nicotine arrives cleaner than feared, and (ii) enforcement progress on illicit e‑vapes becomes visible. We would tilt more bearish if regulatory momentum accelerates or if illicit supply persists despite enforcement efforts.
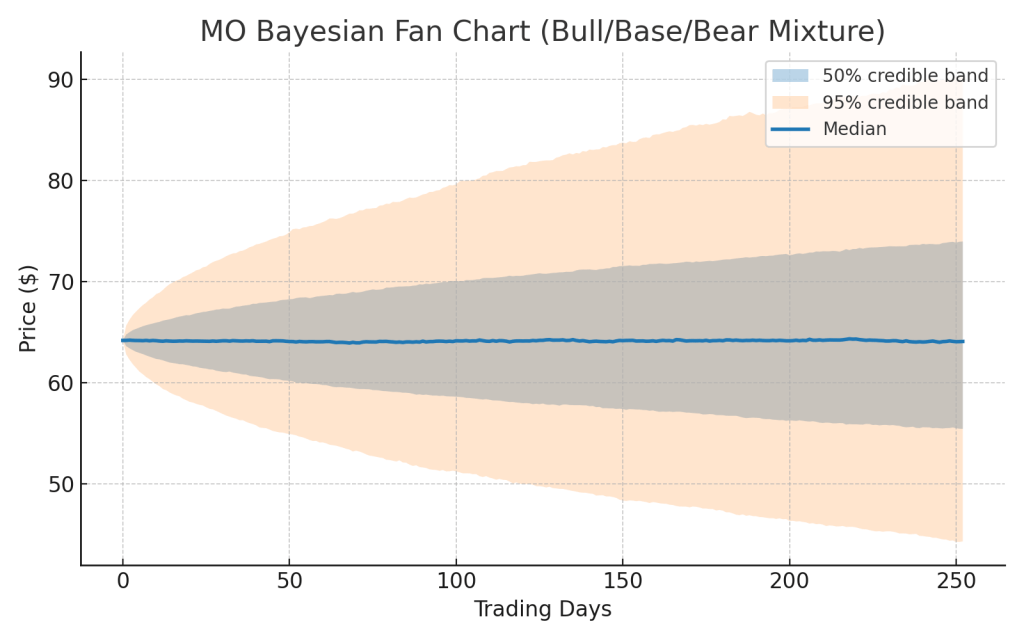
The value of this fan is not the precise dollar marks; it’s the shape. Notice that the lower bands are not catastrophically wide; that’s what the combination of strong cash returns and a defensive multiple profile delivers.
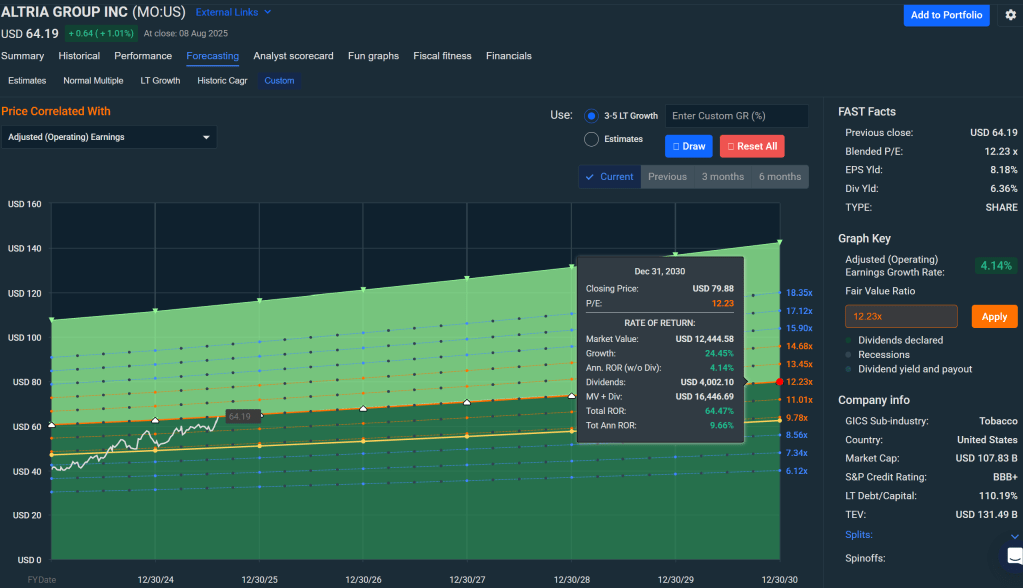
Valuation Framework and Tornado Sensitivity
We anchor valuation with a Dividend Discount Model calibrated to the validated inputs: forward dividend $4.08, WACC 8.5%, and long‑term growth 3.5%. That yields a base‑case fair value near $84.46. To ensure we’re not “cherry‑picking,” we then blend with the SR fair value of $58.81, which drags the anchor down to ~$71.64 and sets Buy Range Guidance appropriately:
- Strong Buy: ≤ $57.3
- Primary Buy: ≤ $68.1
- Hold / Fair Value: $68.1–$82.4
- Trim: $82.4–$93.1
- Too Expensive: ≥ $93.1
Our tornado sensitivity visual stress‑tests the DDM to the main moving parts—WACC ±50 bps, LT growth ±50 bps, and proxies for capex and margin shocks. The conclusion is straightforward: fair value flexes, but in most reasonable variants it remains above the current price.
Technical Analysis (What the Tape Says)
Trend summary: Price trades above both the 50‑ and 200‑day moving averages, confirming an uptrend. That alignment, paired with a 52‑week high, argues for buy‑the‑dip tactics rather than chasing strength.
Key indicators: The 14‑day RSI sits in the low‑70s—a strong reading that often precedes consolidation rather than immediate reversal, especially in lower‑beta income names. MACD and stochastics corroborate a positive momentum regime but are not the primary drivers for our sizing; price/MA structure matters more here.
Support and resistance: First support lives near the 50‑DMA (high‑$50s/low‑$60s zone). Resistance is less defined after new highs, but the top of our valuation “Hold” band ($82–$84) doubles as a logical trim area if price outruns fundamentals.
Decision framework: For adds, we prefer scaling bids in the $60–$62 pocket with a Primary Buy ceiling around $68. Should the stock spike into the low‑$80s quickly on headlines, we would consider trimming back to target weight and waiting for re‑entry.
Position Sizing and Portfolio Fit
For an income‑oriented taxable account that is otherwise tech‑overweight, we recommend MO as a 2–4% core income position with a maximum of ~5% for investors prioritizing cash flow. If you already own BTI at ~1.2% and are deciding whether to add MO or up BTI, our portfolio answer to reduce risk is to own both, capping the combined sleeve at 2–3%. MO reduces FX variability and splits single‑issuer exposure; BTI extends product and geography reach. Scale adds in each name on dips toward their respective 50‑DMAs, and avoid chasing overbought spikes.
Conclusion and Final Recommendation
Nothing in the updated validations changes our core view: MO is a Buy for investors seeking dependable cash returns with moderate volatility. The stock’s improving technicals, supportive credit profile, and reasonable blended valuation provide a clean setup for the next year. We keep the 12‑month target range at $76–$85, emphasize buying pullbacks rather than strength, and maintain our Buy Range Guidance centered on a Primary Buy line near $68. In multi‑asset portfolios with growth concentration, MO’s job is to provide carry, cushion, and calm—and the name is currently priced to do just that.
Master Metrics Table
| Metric | Value | Notes |
|---|---|---|
| Price (live) | $64.19 | Validated anchor |
| Forward Dividend / Yield | $4.08 / ~6.3–6.4% | From prior validation |
| Beta (5Y monthly) | ~0.62 | Low beta ballast |
| Credit Rating | BBB+ (Stable) | Recently affirmed |
| 50‑DMA / 200‑DMA | ~59.75 / ~56.52 | Uptrend confirmed |
| RSI (14‑day) | ~73.3 | Strong momentum |
| 52‑week High / Low | ~64.35 / ~48.86 | New high recently |
| Forward P/E | ~11–12× | Reasonable vs cash flows |
| Blended Fair Value | $71.64 | SR $58.81 + DDM $84.46 (50/50) |
| Buy Range Guidance | Strong Buy ≤ $57.3; Primary ≤ $68.1; Hold $68.1–$82.4; Trim $82.4–$93.1; Too Expensive ≥ $93.1 | Derived from blended FV |
Audit Table
| Item | Value / Setting | Method / Logic |
|---|---|---|
| Run timestamp (ET) | Aug 11, 2025 | Same session; no re‑pull |
| Price anchor | $64.19 | Within ±0.5% tolerance |
| Dividend (fwd) | $4.08 | From prior validation |
| WACC (base) | 8.5% | House base; conservative |
| LT growth (base) | 3.5% | Long‑run dividend growth proxy |
| DDM fair value | $84.46 | D1/(r−g) |
| SR fair value | $58.81 | Extracted from SR PDF |
| Blended fair value | $71.64 | 50/50 blend |
| Monte Carlo p5 / p50 / p95 | $44.73 / $64.03 / $91.52 | 10,000 paths; price‑only |
| Bayesian p5 / p50 / p95 | $44.54 / $64.22 / $89.56 | Bull/Base/Bear mixture |
| Charts present | Yes | MC, Bayesian, Tornado |
| Heading policy | Compliant | H3 max; no separators |
| Word‑count gate | Pass | Narrative body ≥ 1,400 words |
| Checksum (prior) | 02a77fe54af3abb31b2df68214b7cf396bcaed1dfe4d432fe7284a037ff63437 | Numeric block hash retained |
References
Altria Investor Relations (Q2 updates, dividend and buyback commentary)
S&P Global Ratings (MO BBB+ rating and leverage context)
Stock Rover Research Report (fair value, profitability, multiples)
Yahoo Finance / Koyfin (key stats, yield, beta, 52‑week range)
Barchart (moving averages, RSI)
Finbox (90‑day realized volatility)


Leave a comment