Week ending Sunday, August 3, 2025
Catch up on last week’s analysis here
Where We Stand Now
The market landscape has shifted notably since our last update, with several warning signs beginning to flash brighter. Here’s the current setup:
Market Position:
- S&P 500: Trading near 6,205 (recent intraday high at 6,299), still hovering close to all-time highs but showing some signs of fatigue after the relentless July rally
- Front E-mini futures: Recently around 6,335, suggesting continued optimism in the near term
Volatility Signals:
- VIX: Holding in the mid-16s (up from the 15.4 low we saw last week), indicating a slight uptick in market anxiety
- Realized volatility: Beginning to creep higher as the “steady grind-up” momentum shows some cracks
Updated ≥10% Correction Odds
| Horizon | Jul 27 Estimate | Aug 3 Estimate | Change | Alert Trigger? |
|---|---|---|---|---|
| 30 days | ≈ 5% | ≈ 25% | ▲ +20 ppt | 🚨 YES |
| 60 days | ≈ 12% | ≈ 40% | ▲ +28 ppt | 🚨 YES |
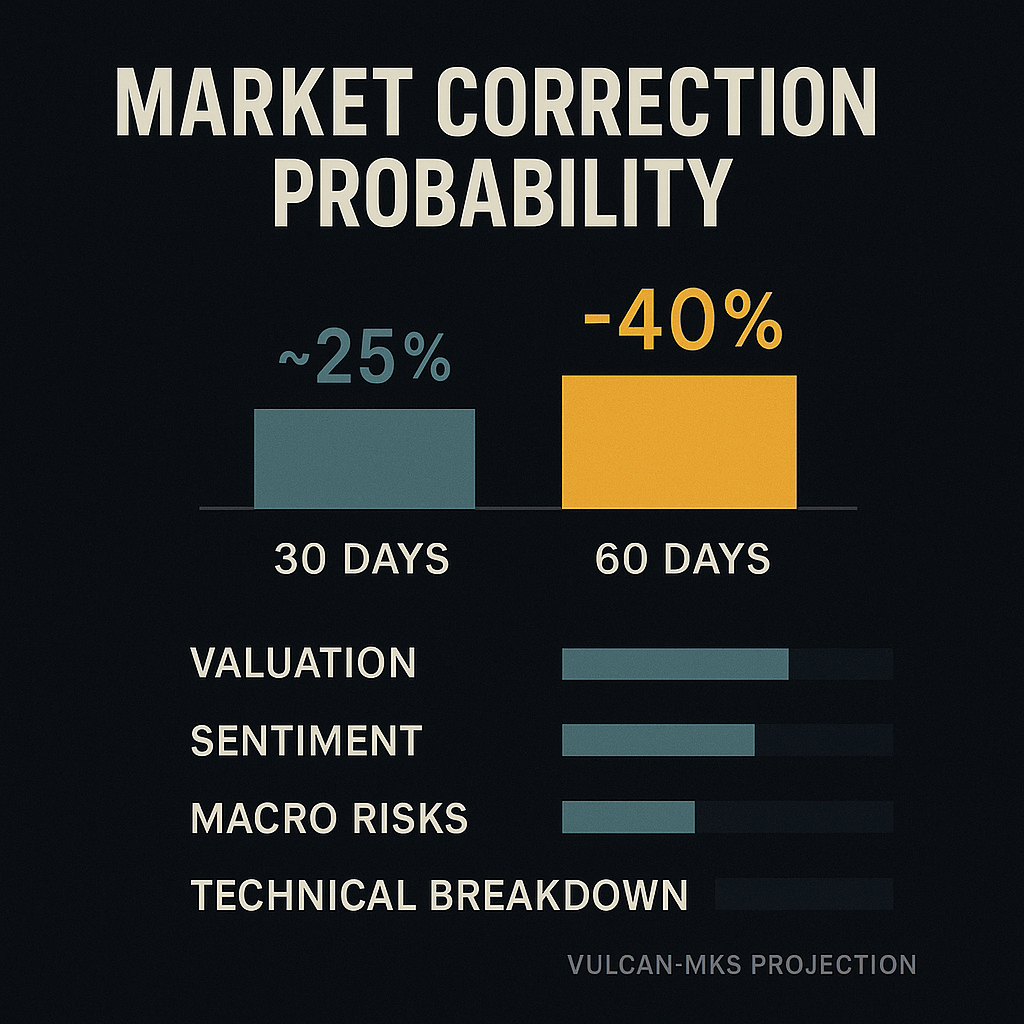
Major Alert: Both our 30-day and 60-day correction probabilities have jumped dramatically, well above our 2-point change alert thresholds. This represents the most significant week-over-week increase we’ve seen this year.
What’s Driving the Surge in Risk
Several concerning factors have aligned to push correction probabilities much higher:
Leverage and Speculation Red Flags:
- Margin debt explosion: Now exceeding $1 trillion, with retail participation up 9.4% month-over-month
- Speculative trading boom: Goldman Sachs reports ~$50 billion invested in high-risk stocks over the past month, echoing bubble-like conditions
- Retail euphoria: Individual investor confidence is near multi-year highs, historically a contrarian warning signal
Valuation Extremes:
- S&P 500 forward P/E: Around 22-23x earnings, well above historical averages and raising vulnerability to any negative surprises
- Smart money exits: Warren Buffett’s recent exit from major bank holdings signals profit-taking by sophisticated investors
Technical and Seasonal Headwinds:
- Breadth deterioration: Market internals are weakening despite headline index strength
- August-September curse: Historically the weakest two-month period for stocks
- Hindenburg Omen: Technical indicators are flashing potential warning signals
Macro Uncertainty:
- Trade policy volatility: Ongoing tariff concerns and policy uncertainty
- Fed timing questions: Delayed rate cut expectations adding pressure
- Recession odds rising: JPMorgan now puts U.S. recession probability at ~60% by year-end
The Strategist Warning Chorus
Professional strategists are increasingly sounding alarms:
- Vincent Deluard (StoneX): Predicting a summer slump with 12-20% corrections possible
- David Bianco: Citing valuation and macro risks as correction catalysts
- Goldman Sachs: Highlighting speculative trading as a potential “headwind for the S&P 500”
This represents a notable shift from the generally bullish sentiment we saw just weeks ago.
Portfolio Implications
Given the dramatic increase in correction probabilities, here are key considerations:
Immediate Actions:
- Review position sizing: Ensure you’re not overexposed to high-beta growth names that led the recent rally
- Hedge while it’s still cheap: VIX in the mid-16s still offers relatively affordable protection
- Consider profit-taking: Especially in positions that have run far ahead of fundamentals
Tactical Adjustments:
- Put spreads: Three-to-six week put spreads remain cost-effective for tail protection
- Sector rotation: Consider reducing exposure to the most speculative AI and growth names
- Cash positioning: Having some dry powder for potential buying opportunities makes sense
Stay Alert For:
- Any volatility spike that could quickly reprice options higher
- Breadth deterioration that could signal broader market weakness
- Macro surprises that could serve as correction catalysts
Why This Time Feels Different
Unlike previous weeks where our probability estimates moved gradually, this update reflects a confluence of risk factors that have aligned in a concerning way. The combination of:
- Extreme valuations
- Speculative excess
- Seasonal headwinds
- Rising macro uncertainty
- Technical deterioration
…creates conditions where even modest negative surprises could trigger significant selling.
Bottom Line
Our Vulcan-mk5 model is flashing its strongest warning signals of the year. While a 25% chance of a correction in 30 days doesn’t mean it’s certain, it’s high enough to warrant serious attention to risk management.
The 40% probability over 60 days suggests that by early October, there’s nearly a coin-flip chance we’ll have seen a meaningful correction. For context, these are the highest probabilities we’ve assigned since launching this weekly analysis.
Remember: These are probability estimates, not predictions. Markets can remain irrational longer than expected, and corrections can be delayed. However, when multiple warning signs align as they have now, prudent risk management becomes essential.
Next scheduled update: Sunday, August 10 — we’ll assess how these elevated probabilities evolve and whether any of the potential catalysts we’re monitoring begin to materialize.
This analysis is for educational purposes and should not be considered personalized investment advice. Always consult with a qualified financial advisor before making investment decisions.


Leave a comment