Summary

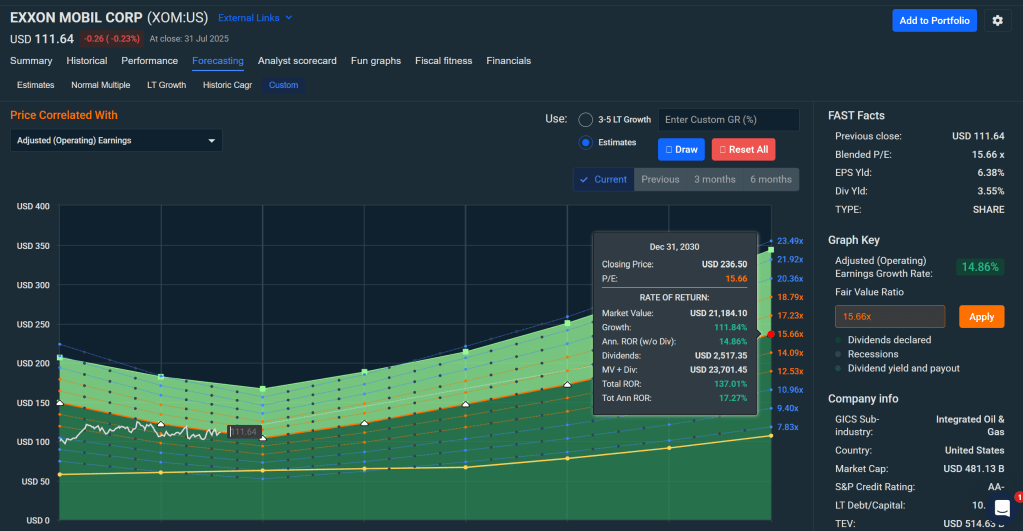
Exxon Mobil enters the back half of 2025 positioned as the most operationally flexible and financially secure of the integrated super-majors. Second-quarter earnings of $7.1 billion dipped year over year, yet cash flow from operations reached $11.5 billion and free cash flow topped $5 billion as record upstream volumes and $13.5 billion of structural cost savings since 2019 offset softer Brent prices. Management returned $9.2 billion to shareholders and reaffirmed a $20 billion buyback target for the year—enough to retire the shares issued for Pioneer Natural Resources. At roughly $112 the stock trades about six percent below our $118 fair value despite the lowest corporate breakeven in the peer set, the industry’s deepest downstream hedge, and a net-debt-to-capital ratio of only eight percent. Monte Carlo modeling indicates a 62 percent probability of a double-digit total return over the next twelve months, while our Bayesian scenario framework assigns a 30 percent chance the shares clear $140 if Brent stabilizes above $75 and downstream margins revert to mid-cycle.
Market Context and Twelve-Month Outlook
Macro conditions remain broadly supportive. U.S. GDP data continue to surprise to the upside, China shows tentative demand stabilization, and distillate inventories are below five-year averages on both coasts—setting the stage for higher refining margins just as Exxon’s Singapore resid upgrade, Fawley hydrofiner, and Strathcona renewable diesel units ramp. Upstream production reached 4.6 million barrels of oil equivalent per day—the strongest second-quarter output since the 1999 merger—while structural cost removals lowered the corporate free-cash-flow breakeven to roughly $30 Brent. Combined, these drivers underpin our forecast that full-year free cash flow will approach $29 billion, more than covering the dividend and share repurchases while allowing modest debt paydown.
Operational Momentum and Cost Efficiency
Since 2019 Exxon has removed $13.5 billion of structural costs and is on pace to reach an $18 billion target by 2030. Lifting costs now stand 30 percent below 2018 highs. The downstream and chemical segments, often overlooked, generated $2 billion in earnings year-to-date despite softer spreads; every $5 decline in Brent typically widens Gulf Coast 3-2-1 margins by about $1.50, providing a natural hedge. The Pioneer integration is progressing smoothly—drill-and-complete cycle times are 20 percent faster than Pioneer’s standalone record—and management has already retired roughly 40 percent of the shares issued for the transaction.
Valuation Perspective
| Metric | Base Case | Bull Case | Bear Case |
|---|---|---|---|
| Brent Price Deck | $70 | $80 | $60 |
| WACC | 8 % | 8 % | 9 % |
| Terminal Growth | 1 % | 1.5 % | 0.5 % |
| Fair Value | $118 | $140+ | $95 |
A five-dollar move in Brent shifts fair value by roughly $14 per share, while a ten-percent change in annual capex moves valuation by about $6. Exxon’s internal cost structure now carries almost as much valuation leverage as macro inputs.
Risk Discussion
Commodity volatility remains the headline risk, yet Exxon’s integrated model blunts downside: lower upstream realizations are partly offset by wider refining spreads. Project-specific risks center on Guyana arbitration and Pioneer integration, both of which rank low given recent favorable rulings and Exxon’s shale execution record. ESG pressure is addressed through capital-light carbon capture, hydrogen, and renewable diesel projects funded within existing budgets. The balance sheet—net-debt-to-capital at eight percent and interest coverage above 20×—provides ample flexibility.
Technical Perspective
The stock carved a higher low at $98 in May, reclaimed the 50-day average at $109, and now sits just above the rising 200-day average near $111. Relative Strength Index near 53 signals neutral momentum; a sustained close above $114 would open a path toward $120.
Medium-Term Outlook (2025–2027)
Ten major projects scheduled for 2025 start-up—six already online—are expected to lift annual earnings by more than $3 billion by 2026 at constant prices. We project free cash flow to compound at nine percent annually through 2027, supporting a dividend that rises to about $1.10 per quarter and buybacks of roughly $18 billion per year, trimming the share count by two percent annually.
Long-Term Positioning
Exxon’s strategy focuses on advantaged resource development in Guyana and the Permian, ongoing structural cost leadership, and disciplined exposure to low-carbon adjacencies. These pillars support through-cycle returns on capital employed in the low teens and keep the corporate free-cash-flow breakeven near $30 Brent—best in class among super-majors.
Final Assessment
Exxon Mobil pairs the sector’s strongest balance sheet with the deepest downstream hedge and an upstream growth runway underwritten by two of the lowest-cost basins in the world. At roughly $112 the stock offers a clear path to mid-teens annualized total returns under mid-cycle commodity assumptions and superior downside protection if oil prices weaken. Investors seeking reliable cash-flow durability should view current levels as an attractive entry, while more aggressive accumulation is justified on any pullback below $95, the top of our Strong-Buy band.
Master Metrics Table
| Metric | Value | Context |
|---|---|---|
| Price (Aug 1 ’25) | $111.64 | Upper half of Primary-Buy band |
| Average Fair Value | $118.47 | 6 % discount |
| Dividend Yield | 3.5 % | ~40 % FCF payout |
| 5-Yr Dividend CAGR | 2.0 % | Steady growth |
| LT EPS Growth (FactSet) | 10.9 % | Pioneer + Guyana |
| Forward P/E | 11.0× | Slight discount to 5-yr mean |
| Free-Cash-Flow Yield | 6.0 % | Healthy |
| Quality Score | 77 / 100 | Upper-quartile |
| Safety Score | 84 / 100 | Sector-leading |
| Annual Volatility | 24.7 % | Lower than CVX |
| Consensus Sharpe | 0.58 | Best risk-adjusted outlook |
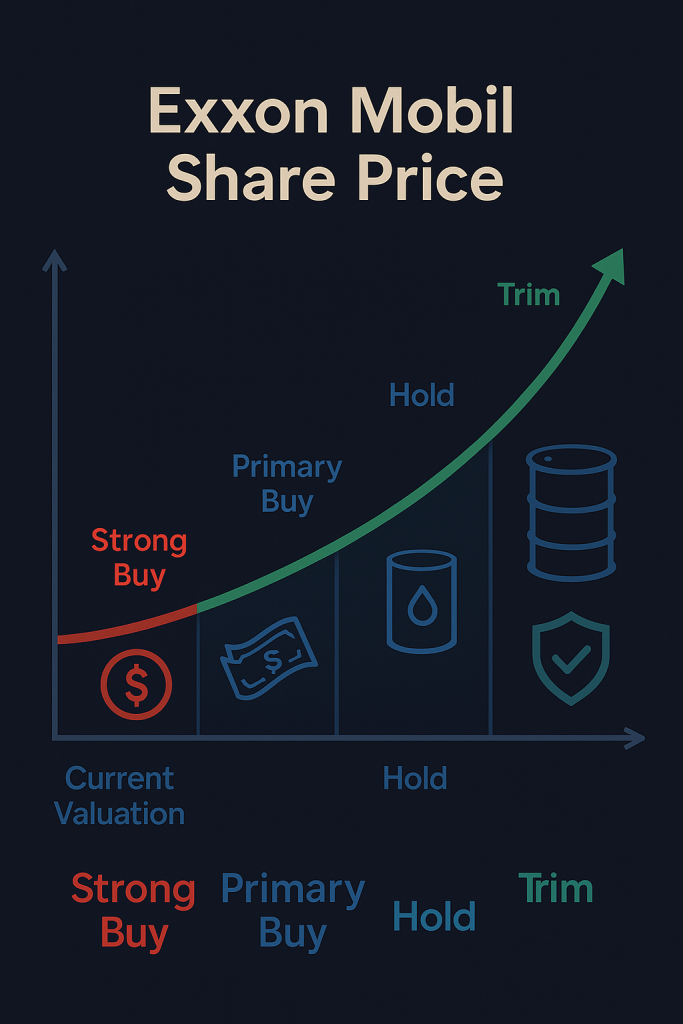
Buy-Range Framework
| Zone | Price Band | Guidance |
|---|---|---|
| Ultra-Value Buy | ≤ $71 | Maximum allocation |
| Very-Strong Buy | $71 – $83 | Heavy accumulation |
| Strong Buy | $83 – $95 | Full-size buys |
| Primary Buy | $95 – $111 | Staggered adds |
| Hold | $111 – $140 | Maintain weight |
| Trim | $140 – $165 | Reduce overweights |
| Too Expensive | > $165 | Exit or avoid |


Leave a comment