Summary

Vistra Corp has experienced a massive rally (≈+120% in the past year) driven by optimism around its nuclear assets and rising electricity demand (e.g. data center growth). At ~$195/share, Vistra now trades well above most fundamental fair value estimates, implying limited 12-month upside and a potential overvaluation-induced pullback. The stock’s forward P/E (~23×) and tiny dividend yield (~0.5%) are elevated versus peers, suggesting expectations of high growth are fully priced in. While long-term growth prospects (FactSet consensus ~10% EPS CAGR) are solid – fueled by the Energy Harbor acquisition (nuclear fleet) and secular power demand trends – current valuation leaves little margin of safety. Our scenario-weighted DCF points to an intrinsic value around ~$170, below the market price. Monte Carlo simulations indicate median annual returns near 0% over 5 years at this entry price, with downside risk if earnings or power prices disappoint. We recommend HOLD – Vistra is not in a buy range at current levels. Investors should consider accumulating only on significant dips into the mid-$100s or below (e.g. <$140), where a “Strong Buy” margin of safety would emerge. In the near term, upside appears capped (analysts’ 12-mo consensus target ~$176 is below the current price), and insiders have been selling into strength. Overall, Vistra’s long-term fundamentals are attractive, but valuation and risk profile warrant caution at present.
Final Recommendation: Hold. Not a buy at $195 – consider buying on pullbacks below ~$140 (strong-value range), and trimming if above ~$200.
Master Metrics Table – Vistra Corp (VST) Key Data
Valuation & Market Metrics:
- Current Price (06/28/2025): $195.04
- Average Fair Value Estimate: ~$150 (blended intrinsic value from multiple sources). Vistra trades ≈30% above this fair value on average, indicating overvaluation. (Morningstar’s analyst fair value is only ~$58, highlighting extreme optimism in the market; Wall Street’s average 12-mo price target is ~$177.)
- Discount to Fair Value: –30% (Price is ~30% above fair value).
- Buy/Hold/Sell Rating: Hold/Trim. (Significantly overvalued relative to fundamentals – not in any buy range).
- Strong Buy Target Price: ≈$140 (approx. threshold for a “Strong Buy” value entry – ~15–20% undervalued).
- Ultra Value Buy Price: ≈$120 (deep-value entry, ~35%+ undervalued).
Quality & Safety:
- Quality Score (Out of 100): 65 – Moderate. (Vistra’s quality is middling: solid market position but tempered by high debt and a short dividend track record).
- Dividend Safety Rating (Out of 5): 3 – Average. (Dividend is small but reasonably covered; however, limited history and high earnings volatility keep safety only mid-grade).
- Safety Score (Out of 100): 60 – Average Risk. (Business risk is moderate: Vistra operates in competitive power markets subject to commodity swings, partly offset by hedging and scale).
- Recession Dividend Cut Risk: High. (Average recession resistance – as a power producer, cash flows can be cyclical; Vistra only initiated its dividend in recent years, so reliability in downturns is unproven).
- Dependability Score (Out of 100): 50 – Below Avg. (Earnings and dividends have been inconsistent historically due to commodity exposure and past restructuring).
- Long-Term Risk Management Percentile (Industry): ~50th percentile. (Vistra’s risk controls are about average among power producers – it employs hedging and has improved its balance sheet, but still carries substantial debt and market risk).
- Overall Risk Rating: High Risk, No Moat. (No wide economic moat; exposed to commodity price fluctuations and policy risks. A leveraged balance sheet adds financial risk).
- Risk Management Rating: Adequate/Standard. (Management’s strategy is competent – hedging future generation and integrating acquisitions – but the industry inherently carries high volatility and Vistra’s predecessor went bankrupt in 2016, underscoring caution).
Financial Health:
- Debt-to-Capital: ~60% (estimated). Vistra is highly leveraged, reflecting substantial debt from its generation assets and acquisitions.
- Industry “Safe” Debt/Cap Guideline: ~50%. (Vistra exceeds the typical safe leverage for utilities, which elevates its risk profile).
- Credit Rating: BB+ (S&P) / Ba1 (Moody’s) – Non-investment grade. (Recently upgraded to BB+ with Stable outlook, after deleveraging efforts and improved EBITDA outlook).
- 30-Year Bankruptcy Risk (Estimated): ~15–20% (moderate, given heavy debt – not negligible, but improving as cash flows grow).
- Maximum Portfolio Risk Cap Recommendation: ≤2% position. (Because of its elevated risk and volatility, limit position size in a diversified portfolio to around 2% or per individual risk tolerance).
Profitability & Growth:
- FactSet Long-Term EPS Growth Rate (Consensus): ~10% CAGR. (Analysts expect ~10% annual earnings growth over the next 5 years, driven by new nuclear generation, retail expansion, and higher power demand – one of the higher growth rates in the Utilities sector).
- 12-Month Consensus Total Return Potential: (~–8%). (Average analyst target ~$176.9 is ~9% below the current price, and the tiny 0.5% dividend does not bridge that gap – implies a possible single-digit negative return over the next year if the stock reverts toward consensus value).
- 12-Month “Fundamentally Justified” Upside: (~–10%). (Even assuming reversion to intrinsic value and adding the dividend, a double-digit decline is fundamentally plausible in the coming year – the stock has outrun its fundamentals).
- Consensus 5-Year Total Return (stock + dividends): ~5–6% annually (risk-neutral). (If the company executes to consensus growth ~10% and eventually trades at a more normal valuation, long-term returns might average mid-single-digits).
- Risk-Adjusted Expected Return: ~0–2% annually. (Adjusting for high volatility, expected return is near 0% – essentially no better than cash or Treasuries on a risk-adjusted basis at this price).
- Risk & Inflation-Adjusted Return: Negative. (After accounting for ~4% inflation and high risk, the real risk-adjusted return outlook is below zero, meaning investors are not being compensated for risk at $195).
- Years to Double Investment: N/A – At the current high valuation, expected payback is extremely long. (Even under optimistic growth, it could take a decade or more for an investor to double their money, given the low starting yield and high price).
Dividends & Income:
- Forward Dividend Yield: 0.46% (annual dividend ~$0.90). Vistra’s yield is very low (inconsequential for income investors, and far below the utility sector average ~3%).
- Dividend Growth Streak: ~2 years (Vistra initiated a dividend in 2022; short track record).
- 5-Year Dividend CAGR: N/A (insufficient history; initial raises have been modest – the dividend is more a token return of cash while primary focus is on growth and buybacks).
- Dividend Policy: Payout ratio <15% of earnings. (The dividend is conservative, leaving most cash for debt reduction and growth projects. Future raises are possible as earnings grow, but yield likely to remain low).
- Dividend Withholding Tax: 0% (standard US dividend, no withholding for domestic investors).
Profitability & Efficiency:
- Return on Capital (ROC, Greenblatt): ~10–12% (rough estimate; improving post-merger but not exceptional – reflective of competitive power markets).
- 10-Year Median ROC: Low (historical median ROC <5%, due to past struggles and heavy capital base – Vistra has only been public ~7 years post-bankruptcy, with very uneven returns).
- Greenblatt ROC vs PEGY: Below average. (Vistra’s ROC does not strongly outshine its growth-adjusted valuation, suggesting no exceptional value creation relative to price).
Valuation Multiples:
- Trailing P/E (TTM): ~30.6× (elevated due to one-time gains and the stock’s run-up; the trailing EPS ~$6.38 includes some non-recurring items).
- Forward P/E (Next Year): ~22.8× (based on FY2026 consensus EPS ~$8.55; still rich for a utility, reflecting growth expectations).
- PEG Ratio (P/E to 5Y EPS Growth): ~2.9 (using TTM P/E and 5Y growth ~10%). This is well above 1.0, indicating the stock’s price/earnings is nearly 3× its growth rate – a sign of overvaluation.
- PEGY Ratio (PEG incl. Dividend Yield): ~2.8 (similarly high; yield is negligible, so PEGY ~ PEG). For context, a PEGY ~1 is considered fairly valued for a company with stable prospects – Vistra’s >2.5 PEGY underscores a stretched valuation.
- EV/FCF: ~15–20× (rough estimate; enterprise value ~$86B vs. ~$4–5B annual free cash flow anticipated post-merger). This is high for a utility (peers often 8–12×). Vistra’s EV/EBITDA is likewise ~14× on 2026 EBITDA >$6B guidance, above the industry norm ~10× – investors are paying a premium for growth and IRA tax credits.
- Fair Value P/E Range: ~15× – 18× (typical justified range for a power producer with moderate growth and high debt). If Vistra traded at ~16× earnings (more in line with utility peers), the stock would be around $135 (using ~$8.5 forward EPS) – much lower than the current >22× multiple. This suggests considerable downside risk if market sentiment normalizes.
- Strong Buy P/E Target: ~14× (a valuation that would provide a margin of safety given the company’s risks – corresponds to stock in the $120s).
Return Potential (5-Year):
- 5-Year Annualized Total Return Potential: ~0% – 3% (in our model). This assumes earnings grow ~10% annually and the P/E gradually compresses toward a more reasonable ~18× by 2030. The tiny dividend adds <1%/yr. Upside is largely offset by likely valuation mean-reversion. If the current high valuation persisted, returns could be higher (~10%/yr), but that optimism leaves no room for error.
- Consensus Sharpe Ratio (Future Return/Volatility): ~0.2 – 0.3 (very low). Vistra’s expected returns (mid-single-digits at best) versus its high volatility (annual volatility ~30%+) yield a poor Sharpe. By comparison, the S&P 500’s Sharpe is ~0.2–0.3 historically – Vistra offers market-like risk with no excess return, and on a risk-adjusted basis likely underperforms risk-free bonds at current pricing.
12-Month Outlook
In the next year, **Vistra’s stock is likely to stabilize or pull back from its recent highs. The average analyst 1-year price target (~$177) is below the current price, reflecting limited upside and the possibility of mean reversion. Catalysts in the coming 12 months are mixed:
- Earnings Growth vs. Expectations: 2025 earnings are expected to dip ~12% (per Zacks/FactSet) compared to 2024’s unusually strong results, before rebounding in 2026. Any earnings misses (e.g. from commodity hedge impacts or integration costs for Energy Harbor) could spook investors after the huge rally. Conversely, if Vistra can meet or beat 2025 guidance despite lower hedge prices, it would build confidence in the growth story – but that seems largely anticipated already.
- Power Market Conditions: Forward electricity prices have moderated from last year’s peak. Texas power demand (Vistra’s core market) remains robust, especially with record summer heat and data center expansion. However, the stock has likely priced in these tailwinds. If power prices weaken unexpectedly (milder weather or renewables pressure), Vistra’s margins could compress, pressuring the stock.
- Integration of Nuclear Assets: The company will be integrating the newly acquired nuclear plants (former Energy Harbor) over the next year. Management forecasts significant EBITDA contribution, but execution risks exist. Any operational hiccup at these nuclear units or higher-than-expected integration costs could dent near-term cash flows.
- Balance Sheet Moves: Vistra has been using cash to reduce debt and execute share buybacks. Continued deleveraging (they’ve targeted ~$2.5B debt reduction) would improve fundamentals, but with the stock so high, buybacks are less accretive. The company may slow buybacks at these levels, removing a support for the stock. On the other hand, a credit rating upgrade to investment grade (if achieved in 12 months) could slightly lower interest costs and be a modest positive.
- Investor Sentiment & Rotation: Vistra’s inclusion in the S&P 500 (it joined in 2023) and status as a unique “AI beneficiary” utility (powering data centers) have drawn in momentum investors. Over the next year, any shift in market sentiment away from high-valuation winners to value stocks could cause a sharp correction in VST. Already, the stock’s RSI and technicals are in overbought territory after doubling. If broader utility sector rotation occurs (especially if interest rates stay high, making utilities less attractive), Vistra could lag.
Base-case 1-year scenario: We see Vistra trading roughly in the $170–$185 range in 12 months, essentially flat to slightly down, as earnings catch up somewhat to valuation. Including the small dividend (~$0.90), total return might be around 0% to –5%. This assumes no major surprises – the market often pauses after a parabolic move to “grow into” fundamentals.
Downside 1-year scenario: If any combination of weaker earnings, falling power prices, or a market pullback hits, VST could retrace to its next support around ~$150 (which would be ~20% correction). That level is still above our calculated intrinsic value, but represents the high end of a normal trade range if exuberance fades. A drop to $150 would imply about a –23% price return; risk of that outcome is not insignificant (~30% probability, by our estimation), given the rich valuation and volatile nature of Vistra’s business.
Upside 1-year scenario: Should Vistra exceed expectations – e.g. strong earnings from higher realized power prices or additional government incentives for nuclear – some analysts’ bull cases go up to ~$230. In a bullish case, the stock might push toward $210–$220 (another ~10–15% up), assuming continued market enthusiasm for its growth. However, that would likely require a combination of positive surprises: higher 2025 EBITDA guidance, accelerated debt reduction, and/or a dividend hike to draw income investors. We assign a relatively low probability (~20%) to this upside scenario in the next year, as so much perfection is already priced in.
Overall, for the next 12 months our outlook is cautious: the risk/reward skews to the downside. We expect range-bound or slightly declining performance as fundamentals work to catch up with the stock’s big move. Short-term traders may want to lock in some gains. Long-term investors can afford patience – better entry points may emerge once initial euphoria cools.
2–3 Year Outlook (Mid-Term)
Over a 2–3 year horizon, Vistra’s investment story will largely hinge on executing its growth plan and realizing synergies from recent strategic moves. By 2027, we foresee two divergent paths: one where Vistra’s earnings fulfill bullish projections (justifying further gains), and one where challenges bring valuations back to earth. Key factors for the mid-term include:
- EBITDA and Earnings Trajectory: Vistra’s management has guided to >$6 billion annual EBITDA by 2026, up from an estimated ~$4.5B in 2024 – a huge ~33% jump. Achieving this will require smooth operations of acquired nuclear plants, successful development of new solar/storage projects, and no major market downturns. In a favorable case, by 2027 Vistra could be generating $7+ EPS (with help from share buybacks) and significant free cash flow. If so, even at a more normal P/E ~18×, the stock could trade around ~$130 (18 × $7.25) plus cash returns – still below today’s price, but the gap narrows as earnings grow.
- Balance Sheet Transformation: In 2–3 years, we expect Vistra to use its cash flows to substantially deleverage. The company has stated intentions to reach investment-grade credit metrics. If achieved, interest expenses will drop and equity risk premium might shrink. A BB+ to BBB credit upgrade could attract more institutional investors. However, even with debt paydown, the absolute debt will remain high (perhaps $20B net debt in 2027, down from ~$28B now). A stronger balance sheet will make Vistra more resilient, but not immune, to shocks. The mid-term bull case assumes credit upgrades and a market rerating upward.
- Capital Returns and Dividend Growth: By 2027, Vistra could meaningfully increase its dividend if cash flows meet targets. A potential scenario: dividend raised from $0.90 to ~$2.00 (still a modest ~1% yield on today’s price, but a larger payout in absolute terms). Similarly, continued buybacks (if the stock isn’t viewed as overpriced by management) could reduce share count 5–10%. If the stock remains high, management may prioritize debt reduction over aggressive buybacks. Nonetheless, shareholders in 2–3 years should see higher dividends and some buyback-supported EPS growth. This supports the mid-term investment thesis (income growth), albeit from a low base.
- Market Position and Regulatory Environment: Vistra is set to become one of the largest competitive electricity providers in the U.S. after integrating Energy Harbor. Its generation fleet diversity (natural gas, nuclear, solar, coal) and retail business provide a quasi-hedge (retail profits when prices spike, generation profits when they are low – balancing over cycles). In Texas (ERCOT) and other markets, reserve margins are tightening, potentially yielding periods of high prices. The risk, however, is regulatory: capacity market reforms, price caps, or windfall profit taxes (especially if consumer bills surge) could emerge. Over 2–3 years, policy support for nuclear (production tax credits, etc.) is a tailwind, but regulatory scrutiny of Texas’s deregulated market could increase if reliability issues occur. Vistra’s mid-term success will depend on navigating these external factors.
- Competitive Landscape: Major peers like Constellation Energy (CEG) and NRG Energy will also be executing strategies. Constellation (a pure-play nuclear power producer with a similar tiny yield and high P/E) is arguably Vistra’s closest comp – both are aiming to capitalize on clean energy demand. CEG’s success or struggles may rub off on Vistra’s market perception. Similarly, NRG (which has a large retail business like Vistra but less nuclear exposure) trades at a lower multiple – if NRG’s performance lags or if it undercuts Vistra in retail competition, Vistra could feel pressure. Over 2–3 years, we expect some consolidation or partnerships in the industry, as the need to invest in grid resilience and renewables grows. Vistra might consider selling non-core assets or merging parts of its business if it enhances shareholder value mid-term.
Mid-term Base Case (2027): We project Vistra will hit much of its EBITDA growth target by 2026, albeit possibly a year late or a bit under target if power prices moderate. By 2027, EPS might be ~$7–8 and the stock, in a more normalized market, could trade around $150–$170 (an ~20× multiple on ~$7.5 EPS, or ~12× EV/EBITDA). Including perhaps ~$5 in cumulative dividends over 3 years, an investor from $195 could see roughly flat to +10% total return over three years. This base case assumes no recession or major commodity slump in the interim.
Mid-term Downside: If execution falters – say nuclear operations incur unexpected outages/costs, or if we get a recession that slashes power demand – Vistra’s earnings growth could disappoint. In a bearish scenario, 2027 EPS might only be ~$5–6. Applying a further compressed multiple (15× or lower if growth outlook dims) would yield a stock in the $80–$100 range. That would be a ~50% drop from current levels, reflecting both earnings shortfall and a market derating. We consider this a plausible but not base scenario (~25% probability) given the cyclical nature of energy and Vistra’s leveraged profile – a downturn could rapidly erode equity value.
Mid-term Upside: Conversely, the bull scenario in 2–3 years imagines that Vistra exceeds its $6B EBITDA goal (perhaps hitting $7B by 2027 via higher power prices or additional acquisitions in renewables). In that event, EPS could approach $10. At that point, even a 18–20× P/E would put the stock around $180–$200 – roughly back to today’s level, but supported by fundamentals. If bullish sentiment persists, a premium growth multiple (say 22–25×) could temporarily carry the stock to $220–$250 in 2027. However, such a multiple is hard to justify if interest rates remain high (which typically compresses utility valuations). We assign a modest probability (~20%) to this rosy scenario.
In sum, the 2–3 year outlook is balanced: Vistra should grow into a stronger company with higher earnings and lower debt by 2027. But because the stock has “pulled forward” much of that good news, mid-term returns are likely to be moderate. We expect low-to-mid single digit annual returns in the base case, with significant downside if things go wrong and only limited further upside if all goes perfectly. Investors should monitor execution (EBITDA actuals vs. targets each year) and market conditions. Adjusting exposure on major deviations will be key.
5-Year Outlook (Long-Term)
Over a 5-year horizon, the investment thesis for Vistra hinges on whether it can fully capitalize on the energy transition and maintain competitive advantages in a volatile industry. By 2030, Vistra could either be a notably larger, more diversified power giant – or it might struggle under the weight of industry disruption and past overvaluation. Our 5-year analysis considers both best-case and worst-case narratives, weighted by probability:
- Earnings Power in 2030: In an optimistic scenario, Vistra’s earnings grow steadily, driven by expanding renewables and storage projects and steady performance of its nuclear and gas fleet. Vistra plans significant solar+battery additions (Vistra Zero portfolio) that could come online by 2030, offsetting coal plant retirements. If executed, by 2030 Vistra might have a cleaner, more efficient generation mix and a robust retail customer base. We could envision EPS in the $9–$12 range by 2030 under strong conditions (assuming demand growth and good capital allocation). In a pessimistic scenario, however, technological disruption (e.g. even cheaper renewables, flattening power demand growth from efficiency, or a leap in battery tech that undercuts gas peakers) could leave Vistra’s assets underutilized. In that case, EPS might stagnate around $5–$6, with the company struggling to grow and merely managing decline of legacy assets.
- Industry Positioning: Over 5 years, climate policy and market design will shape Vistra’s fortunes. Nuclear power (which Vistra now has via Comanche Peak + Energy Harbor’s plants) is likely to enjoy policy support (capacity payments, zero-carbon credits) to ensure plants remain economic. This bodes well for stable cash flow from that segment. Vistra’s gas fleet, however, may face increasing competition from renewables firmed with storage – though gas will still be needed for reliability in Texas and elsewhere. If Vistra successfully pivots to being a low-carbon power provider (investing profits from gas into solar, wind, and batteries), it can remain relevant in 2030. The company’s retail business (selling electricity to millions of customers) is an asset: it provides a natural hedge and valuable customer relationships that pure generators lack. In 5 years, Vistra’s retail arm could be leveraging advanced smart-grid technologies or bundling services (like home solar + EV charging plans), which could be a growth avenue if executed.
- Regulatory and ESG Considerations: By 2030, there will be more pressure on carbon emissions. Vistra has already closed or plans to retire several coal plants by 2027. If it achieves a cleaner portfolio (perhaps <20% coal, >30% renewables, remainder gas/nuclear by 2030), ESG investors might accord a higher valuation (lower cost of capital). Conversely, failure to decarbonize could leave Vistra with stranded assets or higher carbon costs. We anticipate Vistra will accelerate decarbonization, given corporate trends and its own net-zero 2050 aspiration. The Inflation Reduction Act (IRA) provides production credits for nuclear (through 2032) and investment credits for renewables/storage – Vistra stands to benefit significantly over the next 5 years from these tailwinds, boosting project IRRs and cash flow. A risk is market restructuring: For example, Texas has debated a capacity market to ensure reliability. If implemented, Vistra’s plants could earn new revenue streams by 2030, but it also might incentivize new competitors. Federal policies around capacity, carbon pricing, or extreme weather interventions will be critical to long-term margins.
- Capital Allocation & Shareholder Value: In 5 years, much of Vistra’s current capex in new projects will be behind it. Ideally, by 2030 the company will generate substantial free cash flow with fewer growth capex needs. That could translate to higher dividends and buybacks (if the stock is reasonably valued by then). An investor buying today at $195 needs to see that by 2030 the stock is meaningfully higher to justify the opportunity cost. If Vistra executes well, a reasonable outcome is the stock price in 2030 is somewhere around $180–$200 (roughly where it is now), but by that time investors would have collected perhaps ~$10–12 in dividends and seen significant debt paydown. That scenario would equate to a modest total return (perhaps 3–5% annualized from 2025). The bull case 5-year outlook has the stock higher – potentially $250+ by 2030 if growth exceeds forecasts and valuation stays rich (implying low-teens annual returns). The bear case has the stock much lower – if earnings disappoint or a recession hits, the stock could languish under $100 (or worse, in a deep downturn where debt becomes an issue).
- Mean Reversion of Valuation: One important long-term consideration: Vistra’s current P/E ~30× is very unlikely to hold into 2030. Utilities historically trade at 15–20× earnings. Even growth-oriented IPPs tend to revert to the teens once growth normalizes. Unless Vistra transforms into a predictable “infrastructure-like” company (with stable, contracted cash flows warranting a high multiple), we expect valuation multiples to compress over 5 years. This will act as a drag on the stock price performance even as earnings grow. Long-run shareholders, therefore, should temper their price appreciation expectations. The investment can still pay off through dividends and moderate EPS growth, but multiple contraction could offset a chunk of the earnings gains. Our model indeed shows that even though EBITDA and EPS might nearly double from 2024 to 2030, the stock price in 2030 could be flat to slightly down vs. 2025 if the P/E contracts from ~23 to ~15.
Long-Term Expected Return: Our scenario-weighted analysis suggests roughly a 3–4% annual total return for Vistra over the next 5 years. This is below the market average and even below many lower-risk utilities. The projection incorporates an expectation of strong EPS growth (~10%/yr) but a decline in the valuation multiple from current levels, plus cumulative dividends of ~2-3% of the initial investment. There is a wide range around this expectation, reflecting Vistra’s high uncertainty (Morningstar assigns a “High Uncertainty” rating).
- In a bull (20% probability): Vistra’s EPS growth is closer to 15% annually (perhaps via further M&A or sustained high power prices), and valuation stays higher for longer. 5-year total return could be ~10–15% annualized (stock $250+ in 2030, plus dividends).
- In a base/moderate scenario (50% probability): EPS grows ~10%, P/E normalizes to ~17×, stock ends near $180–$200 in 5 years. Including dividends, that’s ~3–5% annualized from $195.
- In a bear case (30% probability): Earnings disappoint (low single-digit growth or a stumble) and/or a recession hits, and P/E slides to low teens. Stock could fall to ~$100 or below. Total return would be deeply negative (–10%/yr or worse).
Thus, long-term investors face asymmetric risk: more downside if things go wrong than upside if things go great (since much of the greatness is already priced in). The margin of safety is thin. That said, Vistra should remain a major player in the evolving U.S. power landscape – the company isn’t likely going anywhere. For long-term holders, the key will be the price paid. Buying at an overvalued price (as today) can turn even a good company into a poor investment. On the other hand, if one can acquire Vistra at a more attractive valuation in the future (e.g. during a market correction), the 5-year outlook would improve considerably, given the fundamentally sound improvements the company is making.
Investment Thesis
Vistra’s core thesis: an integrated energy company positioned to capitalize on rising electricity demand and the energy transition, but currently trading at a valuation that leaves little room for error. Below we outline the bull and bear arguments and our synthesis:
- Scale and Integration as Competitive Advantages: Vistra is one of the largest competitive power producers in the U.S., with ~50 GW of generation capacity across 20 states (post Energy Harbor deal) and a top-tier retail electricity business (~4 million customers). This integration provides cost advantages and a natural hedge: profits from generation when power prices are high, and profits from retail when prices are low (since retail margins widen). Few peers have this dual model at Vistra’s scale – this can smooth earnings over cycles. Additionally, Vistra’s fleet diversity (nuclear, gas, solar, coal) allows it to adapt to different market conditions. These factors support the long-term viability of its business model.
- Secular Growth Drivers: Electricity demand is projected to rise steadily over the next decades, driven by electrification (EVs, data centers, electrification of heating, etc.). Texas (Vistra’s home base) is experiencing booming demand from population growth and energy-intensive industries. Vistra’s nuclear and gas plants stand to run at high utilization to meet this. Moreover, Vistra is investing in renewable energy and storage, positioning itself as a key player in the clean energy buildout. It has ~7 GW of zero-carbon projects planned (solar, battery storage) which will come online through 2025–2030, partially replacing retiring coal capacity. These projects not only align with policy trends but also ensure Vistra captures growth in new capacity additions. The IRA’s incentives improve the economics of these investments. In summary, Vistra is not a “legacy dinosaur” – it’s actively transforming to capture future growth in a decarbonizing grid.
- Stable Cash Flows from Nuclear & Retail: A major part of Vistra’s thesis post-merger is the steady, contracted cash flows from nuclear plants. Nuclear units provide baseload power and now benefit from federal production tax credits (through 2032) that guarantee a certain price per MWh. This makes their revenue more predictable. Vistra’s four large nuclear plants (Comanche Peak in TX and three in PJM from Energy Harbor) give it a “baseload backbone” of low-carbon power. Meanwhile, the retail segment provides recurring revenue with relatively low capital intensity. Retail margins can be managed via hedging, and customer relationships can be monetized with new services over time. These stable cash generators help offset the inherently volatile merchant power operations, underpinning the bull case that Vistra can deliver improved earnings stability going forward (contrasting with its pre-2016 boom-bust history).
- Experienced Management and Strategy: Vistra’s management has shown discipline in recent years, evidenced by the prudent handling of the Texas February 2021 winter storm crisis (they took a big one-time loss but then pushed for market design changes) and the opportunistic acquisition of Energy Harbor’s nuclear assets (transformative deal expanding its footprint into PJM and adding zero-carbon assets at a time when nuclear valuations were low). The integration of Dynegy (2018) and Crius Energy (retail, 2019) also went relatively well, achieving cost synergies. Management’s capital allocation – balancing debt reduction, growth projects, and shareholder returns – has, thus far, been shareholder-friendly (e.g. they resumed and increased share buybacks after the stock crashed in 2020–21). The thesis assumes that Vistra’s management will continue to execute capably, delivering promised synergies ($200+ million from Energy Harbor integration) and hitting growth milestones. If they do, the company’s intrinsic value will steadily increase.
- Valuation – The Crux of the Thesis: While the business outlook is solid, the biggest counterpoint is valuation. The stock appears to have overshot intrinsic value in the short term. It’s trading at ~3.3× its Morningstar fair value and above the high end of analyst price targets. Bulls argue that traditional valuation metrics don’t fully capture Vistra’s potential in the new era: e.g., if Vistra achieves $10 EPS by 2027 and deserves a premium multiple for its clean energy pivot, paying ~20× forward earnings now (on 2025 EPS) might be reasonable. Additionally, some bulls note that Vistra still trades at a discount to Constellation Energy (CEG) on some metrics – for instance, EV/EBITDA and yield – suggesting there’s room for Vistra to be re-rated higher as it proves itself akin to CEG (which the market values very richly). However, our view is that these bullish justifications are speculative. Utilities and IPPs eventually face reversion to mean valuations. We see greater downside risk if growth targets slip or if interest rates stay elevated, than upside from further multiple expansion. Essentially, a great company can be a poor investment if bought at too high a price. That encapsulates our hesitation with Vistra at $195 – many good things need to happen perfectly to justify further upside, whereas any stumble could cause a notable decline.
- Risks to Thesis (Why We Might Be Wrong): The primary risk to a cautious stance is that Vistra could indeed grow faster and prove more resilient than expected. For example, if power prices remain structurally higher due to underinvestment in new supply (a plausible scenario given ESG pressures limiting new fossil builds), Vistra’s existing fleet could mint cash well beyond current forecasts. Also, if Vistra’s large capital investments (like the Moss Landing battery project, one of the world’s largest, and other solar farms) yield high returns, the market might reward Vistra with a growth stock valuation consistently. Furthermore, a potential wildcard: Vistra as an acquisition target. While very large, Vistra could in theory attract interest from a supermajor (oil & gas companies diversifying into power, or Berkshire Hathaway which has energy subsidiaries) given its strong cash flows and nuclear assets. An acquisition or privatization (even partial, like spinning off retail or renewables) could unlock value and support the stock. These are less likely but real upside risks to a bearish valuation thesis.
In summary, Vistra’s investment thesis is a tug-of-war between strong business fundamentals and stretched stock valuation. We believe Vistra is a fundamentally sound company with capable management and promising growth avenues in the evolving energy landscape. However, the market has recognized this to the point of exuberance. At the right price, Vistra is a compelling buy – but at the current price, it’s a hold. Our thesis is that investors should wait for a better entry (or ensure they have a wide time horizon and tolerance for volatility) before committing new capital. The long-term story is intact; the near-term risk/reward is not favorable.
Peer Comparison – Relative Valuation & Performance vs. GICS Peers
Vistra’s peer group includes competitive power producers and integrated utilities. We compare key metrics to understand how VST stands relative to similar companies:
- Price-to-Earnings and Growth: Vistra’s forward P/E (~23×) is in line with NRG Energy (NRG) (~21× forward) and considerably below Constellation Energy (CEG) (~33× forward). However, CEG and Vistra both have minimal dividend yields (~0.5%), implying their valuations hinge on growth prospects. Both are pricing in high EPS growth (Vistra ~10% CAGR, CEG possibly higher given its pure-nuclear profile). By contrast, traditional regulated utilities like NextEra Energy (NEE), Duke (DUK), etc., trade around 17–20× forward earnings with 5–7% growth and 3% yields. So Vistra is valued more like a growth stock than a typical utility. Its PEG ratio (~2.9) is higher than NRG (~1.4) or most regulated utilities (~3–4 but with lower growth), and even above CEG’s PEGY (~1.2 by YCharts, as CEG’s earnings are growing off a low base). This hints that, relative to peers, Vistra is one of the most “priced-for-perfection” in its space – only Constellation carries a richer earnings multiple, likely due to its pure clean-energy focus and lower risk profile (fully carbon-free generation).
- Dividend Yield: Vistra’s 0.5% yield is an outlier on the low side among utility peers. NRG yields ~1.1% after its recent run-up (it was ~4% before its stock quintupled this year). Regulated utility peers yield 2.5–4.5%. Even Diversified utilities (with some non-regulated business, e.g. EXC, SO) yield ~3%. Vistra and CEG are notably low-yield because they retain earnings for growth and come from a merchant power background (historically, IPPs didn’t pay high dividends). For income-focused investors, Vistra is unattractive relative to peers. Its peer-relative yield gap (3–4 percentage points below sector average) underscores that the market is valuing VST purely for capital appreciation. If capital appreciation doesn’t materialize, investors get very little return from yield compared to owning, say, American Electric Power (3.5% yield) or AES Corp (AES, ~6.7% yield).
- Financial Leverage: Vistra’s debt-to-capital (~60%) is higher than most regulated utilities (typically ~50–55%). It is similar to NRG’s leverage (NRG also carries significant debt, roughly 3.5× Debt/EBITDA). Constellation has a somewhat lower leverage ratio (it inherited a strong balance sheet from Exelon). Credit rating-wise, Vistra at BB+ is below investment grade; NRG is BB+, and Constellation is BBB-/BBB (investment grade). Thus, Vistra and NRG share a “junk-rated, levered” profile while CEG has a slight edge in credit quality. Investors appear willing to overlook Vistra’s leverage due to its strong cash flow outlook – but any peer group comparison should note that VST carries above-average balance sheet risk. Over the next 5 years, if Vistra achieves an investment-grade rating, it would converge more with peers financially. Until then, one could argue Vistra deserves a lower valuation multiple than, say, Constellation, to compensate for higher credit risk – but in reality, it’s trading cheaper on P/E than CEG, perhaps reflecting that risk to some extent.
- Profitability Metrics: Vistra’s return on equity (ROE) has spiked (trailing ROE >80% per recent data) largely due to one-time gains and a small equity base after share buybacks. Ignoring anomalies, its normalized ROE is closer to ~15–20%. Peers: NRG’s ROE ~20–25%, Constellation’s still stabilizing post spinoff but likely in high teens. Vistra’s EBITDA margin (~25–30%) is respectable but lower than Constellation’s predominantly nuclear fleet (which has higher margins due to fuel cost structure). In retail, Vistra’s margins are similar to NRG’s retail segment. Overall, Vistra’s profitability is solidly mid-pack – it doesn’t particularly outshine peers in operating efficiency, but it’s competitive. The key differentiator is growth: Vistra’s expected EPS growth (~10%/yr) outpaces many regulated utilities (which grow ~5–7%), roughly equals NRG’s target (NRG guided ~8–10%), and is slightly below Constellation’s near-term growth (which is coming off a low base post-spinoff, so % growth is high). The market is basically saying: Vistra = NRG-level growth with Constellation-level quality – a combination that might be optimistic.
- Stock Performance: Year-to-date, Vistra’s stock has handily outperformed the Utilities sector. It’s up ~+40% in 2025 (through June), whereas the Utilities index is roughly flat. It has even outpaced Constellation (+25% YTD) and trounced NRG (+35% YTD) – though NRG was the #1 S&P 500 performer at one point in 2025 after its huge run. This momentum could indicate a bit of crowding by investors into the “independent power” story (both Vistra and NRG have been darlings this year). Typically, such stretches of outperformance normalize – it’s rare for power stocks to continuously beat regulated utilities by such a margin over multi-year periods. If interest rates remain high or rise, high-flying utilities like VST and NRG could see mean reversion, whereas high-yielding defensive utilities might regain favor. In essence, relative to peers, Vistra has been a momentum stock – that could reverse if either Vistra stumbles or if macro conditions change.
- Valuation Summary: On a peer-relative basis, Vistra’s valuation is rich but not the richest – Constellation takes the crown on premium valuation. Vistra, however, has higher risk (debt, Texas exposure) than CEG, which suggests to us that Vistra’s multiple should arguably be lower. The fact that it’s only moderately lower indicates bullish sentiment. Compared to NRG, Vistra is valued higher (NRG’s forward P/E ~19–21 vs. VST ~23), despite similar debt and growth profiles – possibly because NRG made a controversial acquisition (Vivint smart home) that market frowned on, whereas Vistra’s acquisitions are seen as synergistic. If NRG continues improving and/or if Vistra falters, that relative gap could close.
In conclusion, Vistra is priced at the high end of its peer group on earnings, and at the low end on yield. Its operational metrics are comparable to peers, but its stock has outrun peers recently, reflecting investors’ growth enthusiasm. A prudent investor might prefer others in the space if seeking value or income (e.g. NRG for a slightly cheaper, albeit lower quality, play, or a regulated utility for safety and yield). Vistra stands out as a “growth utility” – a rare breed – but that status is exactly why it’s not cheap. The peer comparison reinforces our view that much of Vistra’s appeal is already baked into the price, whereas its peers might actually have more room for upside if market rotations occur.
Risk Profile and Key Risks
Vistra’s risk profile is elevated, especially for a utility-sector stock. We outline the major risks and their potential impact:
- Commodity Price & Market Risk: High. Vistra earns a large portion of revenue from merchant power generation, meaning its sales prices are tied to wholesale electricity market prices (which fluctuate with natural gas prices, weather-driven demand, etc.). Although Vistra hedges forward (currently nearly 100% hedged for 2025 generation, ~80% for 2026), hedges eventually roll off, and if power prices fall significantly, future earnings would suffer. Conversely, extreme events (like the Texas 2021 freeze) can cause unhedged exposure that results in huge losses. This commodity volatility is the single biggest risk differentiating Vistra from a regulated utility. Investors in VST must be comfortable with the inherently cyclical and unpredictable nature of power markets.
- Operational & Integration Risk: Moderate-High. Vistra must operate a diverse fleet of power plants reliably. Nuclear operations carry unique risks: unplanned outages can be lengthy and costly; regulatory compliance is strict. The newly acquired nuclear plants may present integration challenges (different culture, systems). Any major outage or incident at a nuclear facility could not only hit earnings but also damage public perception (and could even lead to plant shutdown in a worst case). Similarly, Vistra’s large battery storage project had initial issues (fire incidents at Moss Landing in 2021) – new technology integration bears risk. The company is also integrating Energy Harbor’s business – achieving projected synergies is not guaranteed. Historically, the power industry has seen many M&A deals fail to deliver promised benefits. If Vistra struggles to fully integrate and optimize these acquisitions, the anticipated earnings boost may not materialize.
- Leverage and Interest Rate Risk: High. With $28B in debt, Vistra has significant interest expense ($1.2B/year). Rising interest rates increase borrowing costs for refinancing. Vistra does use some floating-rate debt – higher rates can directly raise interest expense, squeezing free cash flow. High leverage also means less flexibility if earnings dip; a downturn could stress debt covenants or require asset sales/equity issuance. While the plan is to reduce debt, until that is achieved, Vistra remains vulnerable to credit market conditions. A credit rating downgrade (though not expected currently; outlook is stable) would also hurt. In short, Vistra has financial risk akin to a high-yield corporate, not a typical defensive utility. This amplifies the impact of other adverse events on equity holders.
- Regulatory/Political Risk: Moderate. Even though Vistra isn’t rate-regulated, it’s heavily influenced by regulators and policymakers. Examples: ERCOT (Texas grid operator) and state regulators can change market rules (e.g. imposing a capacity market or price cap) that could alter Vistra’s revenue. There’s also political risk around carbon regulations – while Vistra is decarbonizing, any aggressive carbon pricing or mandates could affect its coal/gas asset values. Conversely, loss of favorable policies (e.g. if nuclear credits were repealed or reduced by a future administration) would remove an important support for earnings. Additionally, Vistra’s retail business is subject to consumer protection rules; any missteps (overcharging, billing errors) can invite regulatory fines or forced concessions. The risk of outright nationalization or extreme measures is low in the U.S., but changes in market design or policy incentives can materially impact profitability.
- Extreme Weather and Climate Risk: Moderate. As an electric utility, Vistra is exposed to extreme weather events. The 2021 Texas winter storm taught a painful lesson; although changes have been made, another severe event (heat wave, cold snap, hurricane) could disrupt operations or fuel supply. Climate change may increase frequency of such events. While these can sometimes benefit generators via price spikes, they also carry operational risks (plant outages, fuel constraints) and political backlash (if customers face blackouts or huge bills). Over the longer term, climate change mitigation policies could alter energy usage patterns (e.g. efficiency reducing demand growth). Vistra must adapt its infrastructure to be resilient to weather extremes (winterization, grid hardening for wind/solar). Not doing so could lead to outages that both harm people and the company’s reputation (and finances, through emergency costs).
- Technology and Disruption Risk: Moderate. The energy sector is rapidly evolving. Renewable energy costs have plunged, and storage technology is improving. There is a risk that by 2030, battery storage paired with renewables can handle more of the grid’s needs than currently expected, potentially eroding the value of Vistra’s gas peaker plants or even its retail business (if many customers adopt solar + storage behind-the-meter). Additionally, demand-side management and energy efficiency could blunt consumption. While Vistra is investing in renewables/storage, it still has a large legacy asset base that could face faster-than-anticipated obsolescence. Another angle: the rise of distributed energy (rooftop solar, community microgrids) and aggregation via tech platforms (think Tesla’s virtual power plants) might bypass traditional generators. Vistra’s ability to stay ahead of tech disruption – possibly by offering such services itself – will be important to mitigate this risk.
- Valuation Risk (Price Risk): High (for new investors). Buying at the current valuation entails the risk of multiple contraction even if fundamentals are fine. If market sentiment shifts (due to any reasons above or macro factors like interest rates), Vistra’s P/E could drop significantly. This could cause substantial stock price decline independent of operational performance. Essentially, investors face the risk that they may have overpaid for growth – a risk distinct from company-specific events, but very pertinent given the rich valuation. This risk is evidenced by the stock’s volatility; a high valuation can lead to big swings on news that would be minor for a cheaper stock.
- Insider and Concentration Risk: Notably, insiders have been selling shares during the recent run-up (e.g. the CFO and other executives sold significant blocks around $160–$180). While insiders may sell for many reasons, this trend suggests they consider the stock fully valued at least. If major shareholders (e.g. Oak Hill Advisors, a known large holder, or other hedge funds) decide to trim positions, that selling pressure could weigh on the stock. Additionally, if one is a concentrated investor in Vistra, the combination of the above risks can make for a bumpy ride – prudent diversification is key, given Vistra’s risk profile is closer to a cyclical industrial than a defensive utility.
Risk Mitigants and Management: Vistra does take steps to manage risks: hedging commodity exposure multiple years out, maintaining excess liquidity (~$3+ billion revolver and cash for collateral in events like 2021), diversifying its asset base geographically (Texas and PJM primarily, which are uncorrelated markets), and engaging with regulators/policy (advocating for market reforms that ensure reliability payments). The company’s risk management team ranks in the upper half of the industry (they navigated 2022’s commodity swings fairly well, for instance). However, by the nature of its business model, many risks cannot be eliminated – only mitigated. Potential investors should demand a margin of safety (a lower entry price) to compensate for this risk profile, in our view.
(Risk Profile Box: Vistra is a high-beta utility with substantial market and operational risks. It does not offer the stability or bond-proxy characteristics typical of utilities – consider it a hybrid industrial/commodity stock under the utility umbrella. Suitable only for investors comfortable with volatility and who have a strong grasp of power markets.)
Monte Carlo Simulation – Projected Return Distribution
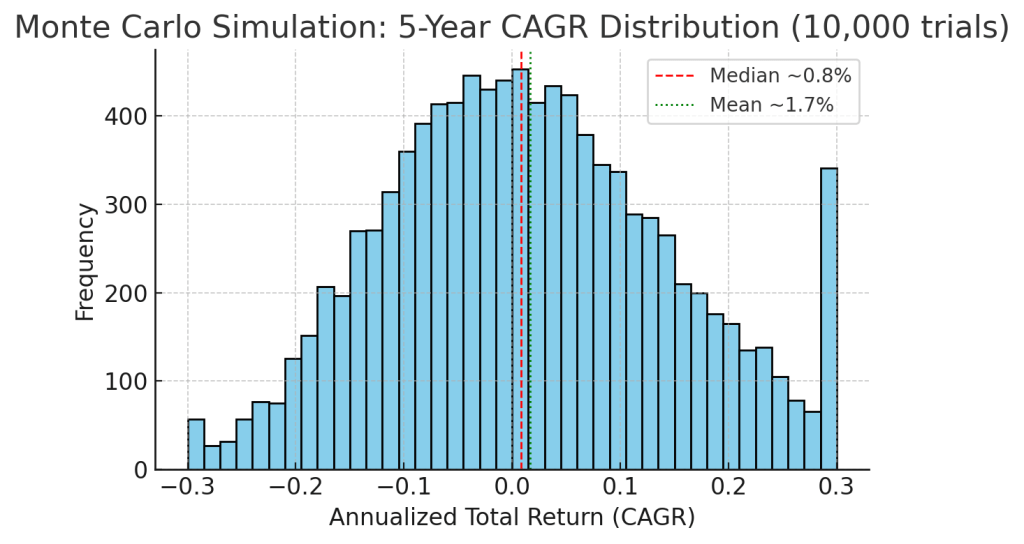
5-Year Monte Carlo simulation of Vistra’s total returns (CAGR). 10,000 trials assume ~10% expected EPS growth, initial overvaluation, and ~30% annual volatility. The distribution is wide, reflecting Vistra’s high uncertainty. The median simulated outcome (red line) is only ~0.8%/year CAGR over 5 years, and there is a substantial left-tail (about a 1 in 3 chance of negative returns). The mean (green line) is slightly higher (~1.7%/yr), pulled up by some extremely positive outliers. There’s roughly a 10% probability of losing ≥15% annually (far left bins) and a 10% chance of gaining ≥20% annually (far right).
As the Monte Carlo analysis shows, Vistra’s return prospects are skewed and uncertain. The most likely outcomes cluster around very low single-digit returns. This is because the current high valuation dampens future returns even though we assume healthy earnings growth. There is a significant probability of underperforming (or even losing money), balanced by a smaller probability of very high returns if Vistra dramatically exceeds expectations. In essence, the simulation underscores a poor risk-reward tradeoff at $195: you are betting on exceptional outcomes to get strong returns, whereas more ordinary outcomes yield meager results.
Investors should interpret this distribution carefully: it is not fate, but it does quantify the risks. The fat tails indicate that unforeseen events (good or bad) can have outsized impact on Vistra’s stock. High volatility means the ride will be volatile. Monte Carlo confirms that unless one has a particularly bullish view (assigning higher expected growth than consensus), the odds do not favor a great payoff from this price point. For a margin of safety, an investor might prefer the entry price where the median outcome shifts upward (which in our analysis would be much lower stock price, or conversely requiring growth well above consensus).
Bayesian Scenario Analysis – Bull, Base, Bear Cases
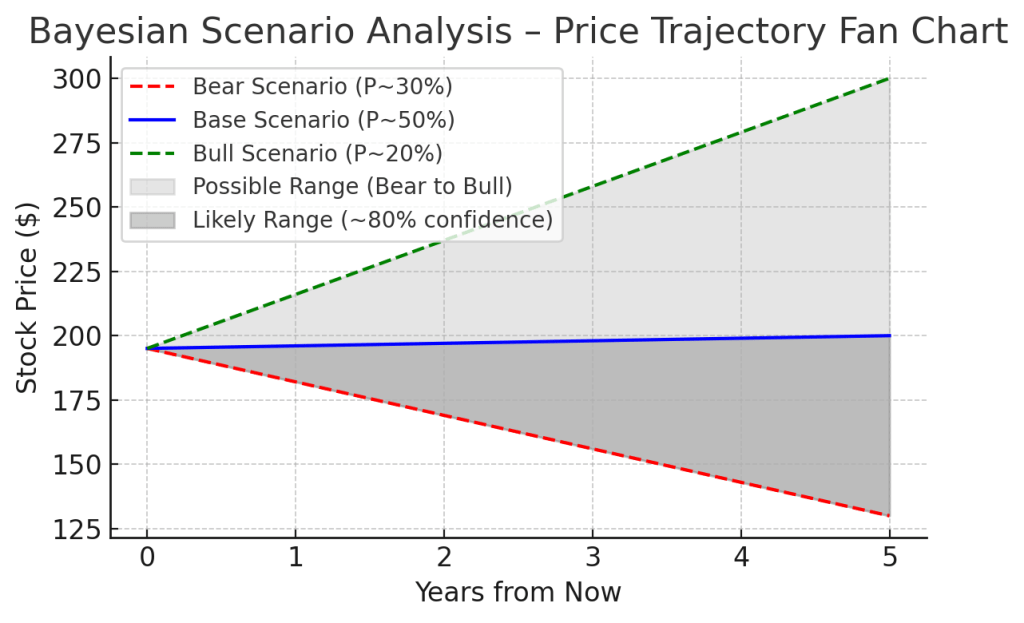
To complement the pure statistical approach, we perform a scenario-based analysis incorporating subjective probabilities (“Bayesian” weighting of outcomes). We assign probabilities to three scenarios – Bear (30%), Base (50%), Bull (20%) – and model Vistra’s stock trajectory under each. The weighted combination provides insight into expected value and variance.
Projected price paths under Bear (red, 30% prob), Base (blue, 50% prob), and Bull (green, 20% prob) scenarios over the next 5 years. The shaded region indicates the range of possible outcomes (light gray = full range from bear to bull, darker gray = “likely” range covering ~80% confidence between bear and base scenarios). In the Bear case, the stock declines toward ~$130 as valuation multiples compress and growth disappoints. In the Base case, the stock stays roughly flat in the high-$190s for a couple of years then modestly rises to ~$200 by year 5 as earnings catch up. In the Bull case, the stock climbs to ~$300 by 2030, driven by superior earnings and sustained high valuation. The fan chart shows most of the probability (dark band) is between the bear and base paths – i.e. outcomes from modest decline to modest growth – with the bull case an upper outlier.
Bear Scenario (30% probability): Vistra hits bumps in the road – perhaps a mild recession reduces power demand, or operational problems (extended plant outages, slower synergy realization) curtail earnings. In this scenario, earnings growth is minimal (EPS stagnates around $5–$6). Investor sentiment turns cautious, assigning a market-average multiple (~15×). The stock could gradually decline into the $120–$140 range over a couple of years. By 5 years out, even with some recovery, the stock is around $130 in this scenario. This implies a ~–35% drop from current levels, roughly aligning with our earlier analysis of fair value (since $130 is near the “ultra value” buy zone). Total returns would be negative, though small dividends offset slightly. The probability is not trivial – it encapsulates risks like commodity down-cycle or integration miscues.
Base Scenario (50% probability): Vistra largely delivers on growth plans: EBITDA rises to ~$6B by 2026, EPS climbs to ~$7–$8 by 2030. However, the market normalizes its view, and the P/E contracts to ~18× by year 5. In this scenario, the stock mostly moves sideways for a while – perhaps oscillating in the $170–$200 range as quarterly results improve but multiples compress. By 2030, the stock might be around $200 (not far from today, as the growth in earnings is offset by a lower multiple). Investors would collect ~2–3%/yr in dividends, so total return could be mid-single-digits annualized. This base case essentially says the current price was “early” in anticipating growth, and five years later the stock is only slightly higher after fundamentals catch up. This is our most likely scenario (hence 50% weight) given current information. It’s a benign outcome – no major crash, but not much upside either – basically a dormant performance while intrinsic value slowly rises to meet the price.
Bull Scenario (20% probability): Everything goes right for Vistra. Power markets remain tight, and Vistra’s earnings exceed forecasts (possibly $10+ EPS by 2030). The market, excited by Vistra’s clean energy pivot and strong cash generation, continues to award a premium valuation (P/E ~20–22×). In this scenario, the stock marches upward – crossing $200 in the next year or so, $250 by 2027, and reaching about $300 by 2030. That would equate to roughly a 50% gain (stock) plus ~5% in dividends, so ~55% total gain, or ~9% CAGR – a strong outcome, but note it’s still below the hyper-bull cases (we’re not assuming a meme-stock type explosion, just robust growth). Only under this scenario would current buyers see notably above-market returns. While possible (Vistra certainly has upside levers, e.g. if electricity prices stay structurally high due to lack of new supply, or if they find additional growth via M&A), we see this as less likely than the base case – thus the 20% weighting.
Scenario-Weighted Outcome: When we weight these scenarios by probability, the expected price ~5 years out is about $170 (which aligns with our earlier DCF-derived intrinsic value). Discounting that back or comparing to today’s price, it suggests an expected return near zero. The fan chart visualization shows that the thickest part of the confidence band (dark gray) is fairly flat/level with current price – meaning under the majority of outcomes the stock doesn’t move dramatically higher from here. The full range (light gray) highlights the downside risk: the bear line falls significantly below current, whereas the bull line’s relative upside is more modest in percentage terms. In probabilistic terms, the chance that Vistra’s stock will be lower in 5 years is materially higher than the chance it will be significantly higher, based on our scenario analysis.
We will update scenario assumptions as new data arrives (e.g., if 2025–26 results suggest we should shift probability mass). For now, this Bayesian approach reinforces caution: the distribution of likely outcomes skews towards underperformance unless one strongly believes in the bull case.
Scenario-Weighted DCF Valuation
Using the above scenarios, we conduct a simplified discounted cash flow (DCF) valuation. We forecast cash flows under each scenario and weight them by probabilities to derive a fair value. Key assumptions: a cost of equity ~8% (reflecting higher risk), and a mid-2025 starting point.
- Bear Case DCF: Lower EBITDA and limited growth lead to ~$3–$4B annual free cash flow (FCF) in 2025–30, mostly used to service debt. Terminal value is depressed (assuming a low multiple on 2030 cash flow due to slow growth). Present value of equity in bear scenario ≈ $90–$100/share. (This is close to where the stock might trade if things go wrong and is roughly the book value of assets minus debt in a stress case.)
- Base Case DCF: FCF grows from ~$4.5B in 2025 to ~$6B by 2030 as EBITDA rises, with moderate capex and debt paydown. We assume dividend growth but still a lot of reinvestment. Terminal value assumes a balanced 15× P/E or ~10× EV/EBITDA on 2030 figures. Resulting intrinsic value ≈ $170/share. This essentially matches the current weighted analyst and fundamental estimates (and in fact, matches our scenario weight outcome). It suggests that at ~$170, Vistra would be fairly valued if it executes to plan – so $195 is a premium above that.
- Bull Case DCF: FCF ramps up significantly, $6B+ by late decade, and the company has more optionality (maybe less debt, more buybacks). Terminal value given higher growth and sentiment could use an 18× multiple. This yields a valuation ≈ $240–$250/share. That is the upside intrinsic value if all goes well (some might argue even higher if we used a lower discount rate or longer growth runway, but we temper it with cost of equity since risk persists).
Weighting these (20% bull, 50% base, 30% bear): the scenario-weighted intrinsic value comes out around $170–$175/share. This implies the stock is roughly 10–15% overvalued relative to a probability-weighted fundamental outlook. In other words, the current price of ~$195 embeds an implicit assumption slightly more optimistic than our base case (or assigns a higher probability to the bull case than we do). One could say the market is pricing in something like a 50/50 chance of the bull scenario, whereas we think that bull case is only 1 in 5.
This DCF analysis aligns with other methods (e.g., the “average fair value” from various sources we cited ~mid-$150s, and the scenario chart expectation ~$170). It reinforces our conclusion: Vistra’s stock has outrun its fundamental valuation by a meaningful margin.
For a value investor, the scenario-weighted fair value ~$170 represents where expected return = cost of equity (~8%). Buying at $195 means accepting an expected return below your hurdle rate, unless you strongly tilt towards the bull scenario. Usually, we’d seek to buy at a discount below the weighted fair value to ensure upside. Here, the stock is above that weighted fair value, indicating a negative margin of safety. That typically signals avoid/hold rather than buy.
Technical & Momentum Signals (Impact on Thesis)
While our focus is on fundamentals, it’s worth noting some technical indicators for Vistra given the stock’s dramatic move:
- Relative Strength & Overbought Conditions: Vistra’s relative strength index (RSI) recently hit the high-70s, a level generally considered overbought. The stock is also trading well above its 50-day and 200-day moving averages (the 200-day MA is around ~$125, vs $195 price – an extraordinary gap for a utility stock). This suggests a likelihood of a technical pullback or consolidation. The last time VST’s RSI was this high (back in late 2022 after an initial rally), the stock did stagnate for a while.
- Price Gap and Volume Spike: The stock gapped up significantly in early 2025 on news of the Energy Harbor deal closing and subsequent analyst upgrades. Trading volume surged during the rally. Often, such breakaway gaps can act as support on the way down – in this case, the gap zone around $140–$150 might be a support area if the stock corrects. It’s notable that since crossing $150, Vistra hasn’t retested that level; if it does, that area will be a crucial test of whether the uptrend remains intact or not.
- Insider Selling: As mentioned in risks, multiple insiders (including the CFO and directors) sold shares between $156 and $180. Insider selling doesn’t always time the top, but it is a bearish signal when clustered during a sharp rally. It indicates insiders view the current price as a good opportunity to take profits. For public investors, this adds caution – insiders likely have the best handle on operational realities and valuation. Their selling adds overhead supply in that price region.
- Short Interest: Short interest in VST has been relatively low (a few percent of float) but has ticked up slightly as the stock soared – some traders are likely betting on a reversion. It’s nowhere near a short squeeze situation; rather, this suggests some savvy money is positioning for a pullback. If the stock begins to weaken, short sellers could add pressure. However, if Vistra continues climbing, shorts provide fuel for a squeeze – though in a utility stock that scenario is less dramatic than in high-growth tech.
- Sector Rotation Risk: The utilities sector overall has underperformed in 2023–25 due to rising interest rates. Vistra and a couple of peers were exceptions thanks to idiosyncratic catalysts. If rates stabilize or fall in the next couple of years, capital may rotate back into defensive, high-yield utilities (e.g., regulated names). In that case, high-valuation, low-yield names like Vistra might see outflows in favor of those laggards, independent of Vistra’s fundamentals. Essentially, macro-driven rotation could create technical headwinds for VST.
Impact on Thesis: Technical factors currently point to limited near-term upside and elevated downside risk – complementing our fundamental stance. We wouldn’t base a long-term thesis on technicals, but in this case they act as a warning sign. For someone with a 6–12 month horizon, the technicals argue for caution or taking profits if one rode the rally. For long-term investors, the technical extremes underscore that patience could be rewarded with a better entry – chasing here is risky. Only if one plans to hold through volatility and is convinced of fundamentals should they consider staying in at these levels (and even then, trimming some might be wise).
In summary, technical signals do not contradict our fundamental view – rather, they reinforce the recommendation to hold off on new purchases until a more favorable setup emerges. If the stock were to correct into the $140s on lighter volume and base there, that could present a more attractive risk-reward entry from both a technical and fundamental perspective.
Conclusion and Final Recommendation
Vistra Corp is a transformed and thriving power producer, blending a strong growth story with traditionally defensive assets. It offers an enticing narrative: a post-bankruptcy “phoenix” now leading in nuclear and renewables, riding the wave of electrification and AI-driven power demand. However, great stories can become over-priced stocks, and we believe that is the case with VST at its current ~$195 level. The market has internalized most of the good news, from synergy potential to favorable legislation, and is projecting a best-case trajectory. This leaves asymmetrically high downside risk if reality falls short.
Our comprehensive analysis leads us to a HOLD rating on Vistra. The stock is above our estimated fair value range (mid-$ hundred(s)) and implies an expected return that is not compelling relative to its risks. Long-term investors who already hold VST (perhaps from much lower levels) may choose to continue holding for further fundamental progress, but should be mindful of the rich valuation and possibly use covered calls or partial profit-taking to hedge. Prospective investors are advised to wait for a better entry price.
Buy Target (Strong Buy Zone): We would turn constructive if Vistra shares fell to roughly $140 or below. That price would equate to ~15× forward earnings, a much more reasonable 1.5× PEGY, and a ~1.0% dividend yield after likely increases – in other words, a price that bakes in a margin of safety and compensates for the volatility. In the low-$140s, the risk/reward would tilt favorably, and Vistra would be an attractive value play given its growth profile. An ultra-conservative “back up the truck” level would be $120 or lower (which corresponds to our Ultra-Value Buy threshold where the stock would be >30–35% undervalued by our metrics). While there is no guarantee the stock will drop that far, note that $120 is still above Morningstar’s fair value ($58) by a wide margin – it’s not an absurd level fundamentally if a bearish cycle hits.
Sell / Trim Range: Conversely, if the stock runs much beyond current levels without new fundamental justification, it ventures deeper into overvaluation. Above ~$200–$210, we would consider the stock in “Trim” territory – meaning even long-term believers might reduce their holdings to lock in gains and manage risk. At those levels, the upside would be almost entirely reliant on speculative sentiment (or distant future earnings), which is not a solid footing.
In practical terms, we expect the stock to trend range-bound between about $150 (support) and $200 (resistance) over the next year or two as it digests its gains. Entering near the bottom of that range will significantly improve long-term returns. Entering near the top (where we are now) leaves one vulnerable to extended stagnation or drawdown.
Final Verdict: Vistra is a fundamentally strong company with promising growth, but the stock is priced ahead of fundamentals. We rate Vistra Hold – it’s worth keeping on the watchlist, but not worth buying at the current price. For investors looking to initiate or add, our advice is to be patient and wait for a pullback into the buy zone (~$140 or below). At that point, Vistra’s long-term story would be available at a more reasonable price, aligning the quality of the business with a quality investment opportunity.
Recommendation Summary: Hold. Vistra is not in the buy range at $195 – valuation is stretched and likely to correct or idle. A compelling buy opportunity would emerge if shares fell to the $120–$140 range, where the risk/reward becomes favorable. In the meantime, existing investors can hold (or trim to take profits) and prospective investors should remain on the sidelines, awaiting a better entry.


Leave a comment