Summary

- Global Nuclear Revival Tailwind: Cameco is a primary beneficiary of a worldwide nuclear energy renaissance. Governments in the U.K., France, Japan, South Korea and others are expanding or restarting nuclear programs, driving uranium demand to multi-decade highs. Uranium spot prices have surged above $100/lb in 2025 (highest since 2007) amidst supply constraints, bolstering Cameco’s near-term pricing power.
- Robust Long-Term Contracts & Moat: Management has secured ~77 Mlbs in new long-term uranium contracts at favorable prices over the past year, choosing margin over volume. The McArthur River mine is back online (planned 18 Mlbs in 2025, ~2× output from a few years ago) but will only ramp further if pricing justifies. Cameco’s vertical integration (via its Westinghouse stake) extends its reach from mining to reactor services, widening its economic moat.
- Momentum vs. Valuation: CCJ shares have rallied to all-time highs, +45% in the past year, reflecting bullish sentiment. The stock trades at ~175× TTM earnings (59× forward) – a rich valuation partially justified by an expected ~25% EPS CAGR over 5 years. The model’s dynamic factor weighting emphasizes Growth and Momentum factors given strong earnings projections and price trends, but the low Value score (due to stretched multiples and 1.74% FCF yield) limits the overall rating.
- Overvalued Near-Term – Caution Warranted: Our probability-weighted DCF valuation yields an intrinsic value in the low $50s per share, well below the current ~$73 price (≈30% premium). Monte Carlo simulations indicate a roughly even risk of gains vs. losses over the next year, with a median outcome slightly negative and a fat-tailed downside (≈5% chance of >50% drawdown in 12M). Bayesian scenario analysis similarly shows the stock priced for perfection, with the base-case outlook already reflected in today’s price.
- Recommendation – Hold / Watch: We rate CCJ as a Hold. The long-term thesis is attractive (industry leader, improving fundamentals), but at current levels the margin of safety is minimal. New investors should await a pullback into the Buy Zone (mid-$50s or below) before accumulating. At such levels – roughly aligned with consensus low-end targets and our DCF baseline – the risk/reward would be far more favorable.
Master Metrics (CCJ)
| Metric | Value (Latest) |
|---|---|
| Sector / Industry | Basic Materials – Uranium Mining |
| Market Cap | $32.0 Billion |
| Current Price (6/28/25) | $73.27 |
| Fair Value (DCF) | ~$54 (probability-weighted estimate) |
| Analyst 12M Target Range | $55 – $80 |
| Discount to Fair Value | ~ –30% (Overvalued vs. fundamentals) |
| Forward P/E (TTM) | ~59× (175× trailing) |
| Expected 5Y EPS CAGR | ~25% annually |
| Dividend Yield (Fwd) | 0.16% (payout ratio ~29%) |
| Financial Health | Debt/Equity 0.15 (Strong balance sheet) |
| Beta (Volatility) | 1.18 (60M beta) – High stock volatility |
| Risk Profile | Medium – Low debt & contracts mitigate operational risk; high price volatility and valuation risk remain |
12-Month, 2–3 Year, 5-Year Outlooks
- 12-Month Outlook: The bullish momentum could carry CCJ somewhat higher in the short run, especially if uranium prices remain elevated or rise further. A bull-case 12M scenario sees the stock pushing into the upper $70s (analysts’ high estimate ~$80) on continued nuclear optimism. However, the base-case expectation is for more muted performance – likely a range-bound trade in the $65–$75 area – as current valuations already reflect much of the good news. Any disappointment (e.g. softer uranium pricing or macro market pullback) could trigger a correction. In a bear-case 12M scenario, the stock could retreat toward the mid-$50s, roughly -25% from here (aligning with the lowest analyst targets around $54–$55). Overall, with the stock overbought and fairly valued at best, the next year’s return profile skews modestly to the downside.
- 2–3 Year Outlook: Over a 2–3 year horizon, fundamental earnings growth is expected to accelerate as new long-term contracts translate into higher realized prices and volumes. In the bull scenario, Cameco’s revenues and margins could surprise to the upside (e.g. if uranium sustains $100+ and production is optimally increased), yielding EPS well above current consensus. Under those conditions, CCJ might reasonably trade in the $80s within 2–3 years, delivering solid mid-teens annualized returns. The base-case 3Y scenario is more temperate: moderate growth in nuclear fuel demand and stable uranium pricing produce steady (but not explosive) earnings gains. The stock might gravitate into the $70s or low $80s by 2027 – essentially a modest single-digit annual return from today, as some valuation compression offsets earnings growth. In a bear scenario, broader economic slowdown or a period of uranium price softness (e.g. as new mines supply the market) could hold CCJ in check. The stock might languish in the $50–$60 range for a few years before improving, implying poor interim returns. Notably, Cameco’s strong contract backlog would likely cushion downside in any industry downturn, preventing an extreme collapse as seen in the last uranium bear market.
- 5-Year Outlook: The long-term outlook for Cameco remains positive given the structural trends in nuclear energy. By 5 years out (2030), many new reactors (including small modular reactors) are expected to come online globally, and Cameco’s Westinghouse investment should be fully integrated, contributing diversified cash flows. In an optimistic 5-year bull case, Cameco could be a markedly larger and more profitable company – potentially doubling its annual free cash flow. Analysts project that if growth is realized, a valuation re-rating to 25× earnings (on much higher future EPS) could justify a stock price above $80 by 2030. Our bull-path analysis similarly yields a 5Y price target in the $100+ area (stock doubling from current levels), assuming sustained commodity strength and premium earnings multiples. The base-case 5Y outcome is a more modest appreciation: we project CCJ in the high $80s to low $90s ( 5–7~5–7% CAGR total return), as robust earnings growth is balanced by a normalization of valuation multiples. In a bear-case 5Y scenario – e.g. a cyclical downturn or major nuclear policy reversal – Cameco’s intrinsic strengths (tier-one mines, western supply contracts) should allow it to weather the storm, but the stock might only be back around the $70 level (roughly flat versus today after oscillating in the interim). This downside scenario still assumes nuclear power’s long-term trajectory remains intact (no catastrophic demand collapse). In summary, 5-year prospects for CCJ are strongly tied to uranium market conditions: the stock could materially outperform if the “nuclear renaissance” accelerates, but if the cycle disappoints, returns may underwhelm given the high starting valuation.
Investment Thesis – Key Drivers and Catalysts
Global Nuclear “Renaissance”: The macro backdrop for uranium is the strongest in over a decade. Governments worldwide are prioritizing energy security and carbon-free power, which revives interest in nuclear energy. The UK’s plan to triple nuclear output by 2050 is just one example; similarly, France is extending reactor lifespans, Japan and South Korea are restarting idle reactors, and the U.S. is funding new modular reactors. This synchronized pro-nuclear policy shift is driving a demand surge for uranium fuel. At the same time, uranium supply remains constrained: the world’s largest producer, Kazatomprom, has cut output guidance due to project delays, and other suppliers face geopolitical and operational challenges (e.g. unrest in Niger, bottlenecks in Namibia). This imbalance pushed spot uranium above $100/lb in early 2025 (a level last seen in 2007). Cameco, as one of the top global uranium producers, stands to benefit enormously from higher prices and the volume upswing.
Locked-In Pricing Power: A critical differentiator in Cameco’s strategy this cycle is its disciplined contracting approach. Over the past year, Cameco signed ~77 million pounds in long-term uranium contracts at prices reflecting current strong market conditions. Management has explicitly stated it refuses to “sell at uneconomic prices”. These contracts typically span multiple years and often include floors or escalators that protect Cameco’s margins. The result is that a significant portion of future production is effectively pre-sold at favorable pricing, ensuring that Cameco will realize much higher average selling prices in coming years (versus legacy contracts signed during the last downturn). This underpins a visible earnings growth runway independent of spot price volatility. Indeed, Q1 2025 saw the highest long-term contracting activity (industry-wide) since Fukushima – a strong vote of confidence from utilities locking in supplies. Cameco’s order book thus provides earnings resilience and predictability through the commodity cycle, a key quality advantage over more speculative mining peers.
Production Ramp with Discipline: On the operational front, Cameco has brought its flagship McArthur River mine back to production after years of care-and-maintenance. McArthur River (along with Key Lake mill) is now targeting ~18 Mlbs U₃O₈ output in 2025, roughly double what Cameco produced just a couple of years ago. Even so, management is intentionally withholding some capacity – the mine can produce up to 25 Mlbs/year – to avoid “flooding” the market and to ensure price remains favorable. This contrasts with the last uranium boom (mid-2000s) when miners (including Cameco) aggressively ramped volume and later oversupplied the market. The new mantra is value over volume. This disciplined supply approach by Cameco and peers is a structural positive for the industry’s economics and suggests that, even as Cameco grows production, it will do so judiciously to preserve pricing. The production ramp will, however, significantly boost Cameco’s top-line in coming years (even doubling output from recent lows), helping to drive strong free cash flow growth assuming prices remain firm.
Vertical Integration – The Westinghouse X-Factor: Cameco’s 2023 joint acquisition (with Brookfield) of a 49% stake in Westinghouse Electric gives it a unique position across the nuclear fuel cycle. Westinghouse is a major nuclear reactor technology and services provider. Initially, this deal was met with skepticism – a miner buying into an equipment/services firm – but it is already yielding strategic benefits. In 2025, Westinghouse signed new service contracts in Eastern Europe (Czech Republic, Poland, Bulgaria) as those countries pivot away from Russian-sourced nuclear technology. Cameco expects “multi-year revenue synergies” from these deals. Essentially, Cameco now can earn revenue from mining the uranium, converting it (Cameco also has conversion facilities), and servicing reactors – a vertically integrated model. This broadens Cameco’s moat: utilities and governments seeking reliable Western partners for the entire nuclear fuel cycle see Cameco-Westinghouse as a one-stop solution. Over the long term, this integration could smooth out Cameco’s cyclicality (services revenue is steadier than mining) and potentially command a higher valuation multiple as Cameco transforms from a pure commodity producer into a more diversified nuclear energy firm. The “nuclear ecosystem” play and the partnership with Brookfield Renewable also align Cameco with global clean energy capital, possibly easing future project financing or expansion.
Peer Comparison – Size and Stability vs. Pure-Plays: In the uranium mining equity universe, Cameco stands out as the largest and arguably lowest-risk operator. At $32 billion market cap, it dwarfs most peers – for example, Uranium Energy Corp (UEC) is only about a $3 billion company, with far less production (UEC and many juniors have yet to produce significant uranium, riding mostly on exploration assets). The Global X Uranium ETF (URA), a proxy for the sector, has ~23% of its assets in Cameco alone – a testament to Cameco’s dominance. Compared to smaller peers, Cameco offers superior asset quality (high-grade mines in geopolitically stable Canada), a robust balance sheet, and actual earnings & cash flow from operations. It is often dubbed the “blue-chip” of uranium stocks. That said, the flip side is valuation: investors pay a premium for Cameco’s relative safety. Many junior uranium stocks may offer higher speculative torque (e.g. to uranium price spikes) but come with substantial operational and financing risks (some are essentially optionality on uranium prices with negative cash flow). Cameco, by contrast, is a going concern with growing cash flows and even a small dividend – institutional investors (e.g. BlackRock, Vanguard) have notably been increasing their stakes in CCJ. This institutional support and recent inclusion in the TSX-60 index have likely contributed to its strong share performance. Overall, Cameco’s peer-relative strength lies in being the “safer pair of hands” in a volatile sector – an attribute that justifies some premium, though as noted, the current premium appears stretched.
Quality & Safety Factors: From a factor-investing perspective, Cameco scores well on Quality of business but with caveats. Positively, the company has excellent financial health: debt-to-capital is only ~15%, and it carries a net cash position (cash > debt) of about -$0.45B (i.e. $450M net debt, very manageable relative to equity). Liquidity ratios are strong (current ratio ~2.7×), indicating no near-term balance sheet stress. The dividend, while small (yield ~0.16%), has room to grow and was recently increased ~29% YoY – signaling confidence in cash flows. However, traditional profitability metrics are currently subpar: TTM ROE ~3.9% and ROIC ~4.4% are low for a mature company, a result of depressed earnings coming out of the uranium bear market. As uranium contract prices reset higher, these returns should improve, bolstering the Quality score over time. The Safety profile (dividend safety and recession resilience) is mixed: Cameco’s minimal dividend obligations and strong finances mean low risk of financial distress or a dividend cut, even in downturns. But the stock itself is inherently volatile, driven by uranium price cycles and sentiment. Beta at ~1.2 (and an even higher short-term beta if measured against commodity indices) means CCJ will swing more than the average market. In downturns or market shocks, uranium equities can sell off sharply (notwithstanding long-term contracts, as many investors trade them as commodity proxies). So, while fundamental risk (bankruptcy or insolvency) is very low for Cameco, market risk (drawdowns) is relatively high. This is an important distinction for investors – position sizing and risk tolerance should be calibrated accordingly.
In summary, Cameco’s investment thesis rests on it being the premier vehicle to gain exposure to a nuclear energy upswing – it offers leverage to uranium prices with a cushion of quality, something few peers can claim. The company is executing well on its strategy of securing profitable contracts, ramping production prudently, and expanding its reach in the nuclear value chain. These factors support a strong multi-year earnings growth trajectory and possibly a higher fundamental value than in past cycles. However, at the current stock price, much of this rosy future appears priced in. The key debate is valuation: whether one is comfortable paying now for growth that will unfold over the next 5+ years. Our model suggests patience – the risk/reward is far more compelling at a lower entry price, especially given the volatility of the underlying commodity and macro uncertainties.
Risk Profile & Key Risks
Uranium Price Volatility: As a commodity producer, Cameco’s fortunes remain tied to uranium market dynamics. Spot uranium has spiked to $100+, but it has historically been extremely volatile – during the last cycle it crashed from $136 in 2007 to under $20 by 2016. A significant pullback in uranium prices would directly hit Cameco’s future revenues and could force the company to dial back production plans. Mitigant: Cameco’s extensive long-term contracts at fixed/escalated prices mean near-term cash flows are buffered if spot prices tumble; only uncontracted volumes (or contract repricing upon renewal) are exposed. This makes Cameco less sensitive to short-term price swings than pure spot-leveraged miners. Nonetheless, a prolonged slump in uranium demand or pricing (e.g. due to global recession or rapid renewables uptake reducing baseload needs) remains the top risk.
Nuclear Policy & Perception Risks: The nuclear industry is unique in that a single event can dramatically alter public perception and policy. A major nuclear accident (akin to Fukushima in 2011) could lead to reactor shutdowns or cancelations worldwide, crushing uranium demand. Political sentiment could also shift – e.g. a future government in a key country could pivot away from nuclear power (due to safety, waste, or cost concerns) and cut reactor fleets or planned builds. While the current trend is pro-nuclear, these are inherently tail risks that could significantly impair Cameco’s long-term outlook. Additionally, shifts in regulation (such as changes in uranium export/import laws, or restrictions on nuclear fuel cycle activities) could impact Cameco’s operations or addressable market. Mitigant: Cameco’s customer base and operations are geographically diversified (North America, Europe, Asia), making it unlikely that any single country’s policy reversal would collapse its entire business. Also, nuclear plant decisions are long-term and less prone to sudden reversal absent extreme events.
Operational & Execution Risks: Mining, even in stable jurisdictions like Canada, carries operational risks. Cameco has faced challenges historically – for instance, flooding issues at Cigar Lake and McArthur River have caused extended production halts in the past. Any technical problems, accidents, or delays at key mines could disrupt output and financial performance. Moreover, the company is in the process of scaling production significantly; executing this ramp-up on time and on budget is critical. There’s also integration risk associated with the Westinghouse acquisition – entering the services business could present unforeseen challenges, and management must prove it can effectively oversee this new segment. Mitigant: Cameco has decades of operational experience and a strong safety record. The decision to bring McArthur back was made after extensive refurbishments and risk assessments. Financially, the company has the flexibility to withstand hiccups (low debt, solid cash position). Still, any prolonged outage or cost overrun (e.g. if additional capex is needed to sustain production) could hurt earnings.
Geopolitical & Supply Chain Risks: While Cameco’s own assets are mostly in Canada (a very low-risk jurisdiction), the broader uranium supply chain has geopolitical overlays. For example, enrichment and conversion services are dominated by a few countries (including Russia in enrichment – though Cameco is not directly involved in enrichment, any sanctions or trade restrictions could impact global nuclear fuel logistics). Cameco’s joint venture in Kazakhstan (Inkai) means a portion of its supply comes from there; instability or policy change in Kazakhstan could affect that JV’s output. Additionally, the company sells to utilities worldwide – geopolitical conflict (such as escalation of war in Europe or Asia) could disrupt transport of uranium or alter trade flows (e.g. some countries might seek to source only domestically or from certain allies). Mitigant: Cameco has diversified supply (including its own Tier-1 Canadian mines and various partnerships) and has increased Western-aligned capabilities (like Westinghouse for fuel services), which positions it as a reliable supplier if, say, Russian fuel is phased out. In fact, geopolitical realignment (countries avoiding Russian nuclear fuel) is more of an opportunity than a risk for Cameco at present. The main risk would be any scenario where global trade is severely interrupted or parts of the world nuclear fleet go offline due to conflict.
Valuation & Market Risk: At ~175× earnings and ~13× sales, Cameco’s valuation leaves little room for error. If growth initiatives underwhelm or uranium prices retreat, the market could compress CCJ’s earnings multiple significantly. Even absent a fundamental misstep, high-multiple stocks often see volatility as investor sentiment shifts. There is also general market risk (macro-driven): e.g. rising interest rates or a rotation out of cyclical commodities could cause a de-rating of Cameco’s stock independent of its operational results. With the Fed now concerned about lingering inflation and maintaining higher rates despite slowing growth, equity risk premiums could rise, pressuring valuations of long-duration growth stories like Cameco. Mitigant: A portion of Cameco’s valuation premium is arguably justified by the contracted growth and strategic position. But from a risk perspective, any hiccup (earnings miss, guidance trim, or external shock) could lead to an outsized stock drop given the lofty expectations embedded in the price. Investors need to be prepared for high price volatility – as evidenced by CCJ’s 52-week range and our simulated risk analysis showing potential for large swings (see Monte Carlo section below).
ESG and Stakeholder Risks: While nuclear power is carbon-free and Cameco thus benefits from the clean energy narrative, ESG-minded investors sometimes have reservations about uranium mining (environmental impact of mining, radioactive waste concerns downstream). There’s a minor risk of investor base contraction if certain funds screen out nuclear or uranium. Additionally, local stakeholder issues – e.g. Indigenous rights and partnerships in Saskatchewan where Cameco operates – must be managed carefully. Cameco has a good track record of community engagement, but any lapse could pose reputational or operational risks.
On the whole, Cameco’s risk profile is characterized by low fundamental financial risk but high market and external risk. The company is well-managed and fortified against many operational dangers, but investors must accept the possibility of significant share price fluctuations and the tail risks inherent to the nuclear industry. We assign Cameco a Medium risk rating in our model: the balance sheet and contracts earn high marks, yet the stock’s volatility and sensitivity to external events keep it from a low-risk designation.
Monte Carlo Simulation – Probabilistic Return Forecasts (10,000 trials)

Monte Carlo simulation of 12-month total return for CCJ (10,000 trials). The distribution is right-skewed, but centered near 0%, reflecting as much downside as upside at the current price.
We ran a 10,000-trial Monte Carlo simulation for CCJ’s 12-month total return, incorporating the stock’s high volatility (historical ~35–40% annualized) and consensus fundamental outlook. The resulting distribution (above) highlights the wide range of potential outcomes. Key probabilistic insights:
- The median expected 12-month total return is approximately –8% (slightly negative). This aligns with our assessment that the stock is currently overpriced relative to fundamentals – essentially, if nothing “extra special” happens, the stock could be slightly lower a year from now once initial euphoria cools. In fact, there is roughly a 55–58% probability that CCJ’s price will be lower 12 months from now (i.e. more than half the simulation trials showed negative returns). This slight bearish tilt in outcomes is notable given the generally positive growth forecast – it’s a function of starting valuation.
- The return distribution is broad and skewed. We calculate a 5th percentile outcome of roughly –53% (extreme bear case) and a 95th percentile of about +79% (extreme bull case). In other words, there is a 1-in-20 chance the stock loses more than half its value in one year, and a symmetric 1-in-20 chance it nearly doubles. Such fat tails reflect the stock’s elevated volatility (β ≈ 1.2, and even higher on a short-term basis) and the leverage CCJ has to uranium price swings. For context, a -50% one-year crash could occur if uranium prices unexpectedly plunge or a major risk event hits (similar to the 2011 Fukushima-driven selloff), whereas a +80% surge could accompany a combination of much higher uranium prices and continued multiple expansion (a very bullish scenario).
- The mean expected return is about flat (slightly below 0%). This suggests that while the median is -8%, the distribution has a long positive tail that pulls the average up a bit. The positive skew means a few outlier high-return scenarios elevate the mean. This is typical for commodity-levered stocks – there’s a small chance of explosive upside (e.g. uranium super-spike) that balances out a more probable modest downside.
- Value-at-Risk (VaR) and Conditional Outcomes: From the distribution we can infer VaR statistics – e.g. VaR(5%) ≈ -53%, meaning a 5% probability of at least a 53% loss in a year (conversely 95% chance of doing better than -53%). The CVaR (expected shortfall) in that tail is even worse (the average of the worst 5% outcomes was around -60% return). This underscores that while Cameco is a fundamentally solid company, its stock can exhibit drawdowns similar to a high-beta cyclical. On the upside, there’s roughly a 25% probability of a >+20% gain in 12 months, and about a 10% probability of >+50% gain (if the bullish scenario materializes strongly).
It’s worth noting that this simulation assumes no major change in valuation multiples beyond what fundamentals dictate – if investors collectively decide to re-rate the stock (up or down), actual returns could fall outside this modeled range. For example, sustained investor enthusiasm for nuclear could keep CCJ at elevated multiples (skewing outcomes higher), whereas if sentiment turns or macro factors force multiple compression, outcomes could skew lower. The Monte Carlo is best viewed as an objective baseline given current volatility and growth estimates.
Bottom line: The simulated outlook suggests balanced risk and reward over the next year, with perhaps a slight downside bias. This is a cautionary signal – unlike many deep-value situations where the distribution might be skewed heavily to the upside, CCJ at its current price does not offer asymmetrically favorable odds. Investors should be prepared for volatility: our model’s 1-year 95% confidence interval spans roughly -50% to +80% total return – a range of outcomes so wide that position sizing and risk management become crucial. It also reinforces our view that waiting for a better entry price could improve these odds (shifting the distribution upward).
Bayesian Scenario Modeling – Bull, Base, Bear Paths
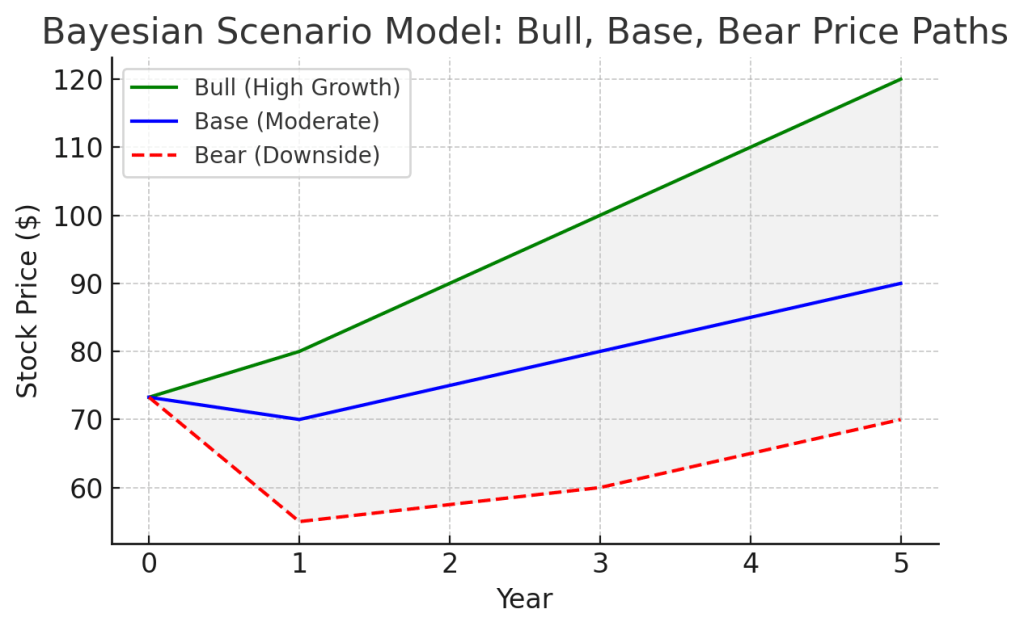
Projected stock price trajectories under three scenarios (Bull/Base/Bear) over a 5-year horizon, with macro-conditioned probability weights. The shaded area indicates the fan of uncertainty (50–95% confidence bands).
Using a Bayesian scenario approach, we model three distinct pathways for Cameco – Bullish, Base-case, and Bearish – incorporating current macroeconomic regime signals and industry conditions. We assign prior probabilities to each scenario (approximately 30% Bull, 50% Base, 20% Bear to reflect a moderately cautious macro view with upside potential). The chart above illustrates the projected stock price under each scenario through 2025–2030, along with a “fan” of confidence intervals around the base case. Key scenario assumptions and outcomes:
- Bull Scenario (Green line, ~30% probability): In the bull case, virtually everything goes right for Cameco. Global nuclear ambitions accelerate even beyond current plans – e.g. faster reactor build approvals, and perhaps breakthroughs in SMR (Small Modular Reactor) deployment that significantly boost uranium demand. Uranium prices in this scenario remain at or above $100/lb, or even push higher, allowing Cameco to both lock in more lucrative contracts and possibly sell some volume at spot for windfall profits. Cameco would likely move to ramp production closer to capacity (e.g. McArthur River toward 25 Mlbs/year, plus additional restarts or tier-2 assets coming online). The Westinghouse segment would also flourish as more reactors in the West require services and fuel fabrication (especially as utilities diversify away from Russian suppliers). In this rosy scenario, earnings could grow exponentially, with EPS far exceeding current consensus. We project that by year 5, Cameco’s EPS might be several times the current ~$0.40 (TTM) – potentially in the $2–3 range if uranium stays >$100 and volumes expand. Applying a growth-stock P/E (say 25–30×, as bullish analysts suggest) to such EPS yields a stock price north of $80–$90 by 2028–2030. Our bull-path chart accordingly shows CCJ climbing to the $100+ level by 5 years, implying roughly a double from today’s price. This aligns with some aggressive bullish takes – for instance, Bank of America’s recent upgrade calling Cameco the “single best uranium play” with a ~$70 one-year target (which the stock has nearly achieved) and upside beyond that, or the notion that a rerating could push the stock above $80 with premium peer multiples. In probability-weighted terms, this bull case contributes significantly to the upside tail in our overall valuation.
- Base Case (Blue line, ~50% probability): The base case assumes the current positive trajectory continues, but without major surprises. Nuclear power growth proceeds as planned (not dramatically faster or slower than expected). Uranium prices perhaps moderate from the recent spike but stabilize in a healthy range (e.g. $70–$90/lb) that allows producers to prosper without spurring too much new supply. Cameco executes well: it meets its production targets (18 Mlbs from McArthur, etc.), secures additional contracts in line with its strategy, and Westinghouse contributes incremental (but not game-changing) earnings. In this scenario, analysts’ consensus forecasts for ~25% EPS CAGR prove roughly accurate for the next few years. We would see Cameco’s EBITDA and free cash flow growing robustly through 2028, but the stock’s valuation multiple likely contracts from extreme levels as earnings “catch up.” The net result: we envision the stock perhaps rising gradually into the $80± range by year 5 (upper $80s in our model, equating to high-single-digit annual total returns). This would be consistent with, say, EPS reaching ~$1.50–$2.00 in five years and the stock trading at a more modest 40–50× multiple by then (still assuming a growth premium). Notably, our base scenario price path is relatively flat in the immediate 1–2 years (low $70s), reflecting that current price already factors in a lot of the near-term earnings ramp. By years 3–5, as fundamentals improve, the stock resumes an upward trajectory. The base case essentially treats CCJ as fairly valued around $70 now, with its future gains coming from actual earnings growth rather than further multiple expansion. The fan chart confidence bands (gray shaded) around the base line illustrate uncertainty – by year 3, we have a ~50% confidence band spanning roughly mid-$60s to mid-$80s, widening to ~$55 to ~$100 by year 5 (75% band even wider). These bands encapsulate macro and execution variability within the base scenario.
- Bear Scenario (Red line, ~20% probability): The bear case envisions one or more adverse developments that weigh on Cameco’s prospects. This could be macro-driven – e.g. a global recession in 2024–2025 that dampens power demand and leads some utilities to defer uranium contracting (or even slow reactor operations), resulting in a glut of uranium in the spot market and prices retracing to, say, $40–$50/lb. It could also be industry-specific – for instance, a major improvement in nuclear fuel recycling or a policy shift toward alternative fuels (less likely, but a technological breakthrough in nuclear fusion or renewables storage could, in a very bearish scenario, reduce long-term fission demand). In our bear model, uranium prices drop and Cameco’s contract pipeline provides only partial insulation (future contracts might be signed at lower prices, and existing “ceiling” prices could cap upside). Under this scenario, Cameco might scale back production plans (to avoid oversupply) which could limit revenue growth. We also consider potential idiosyncratic setbacks: maybe the McArthur River ramp hits obstacles, or the Westinghouse integration doesn’t yield much benefit, etc. In total, Cameco’s earnings in this bear case grow very slowly or even stagnate after an initial step-up. The stock would likely de-rate significantly from its lofty multiples if growth disappears. We project that CCJ shares could fall into the mid-$50s or even lower in the next 12–18 months (consistent with the ~$49 intrinsic value some 5-year DCF analyses suggest, and near the low end of analyst targets). Over the 5-year span, if the company still ekes out some growth and nuclear remains part of the future, the stock might recover somewhat – perhaps back to around $70 by year 5 (essentially where it is now, meaning a flat five-year return). However, in a truly bearish world (say nuclear sentiment turns very negative), one could imagine even lower prices; our bear path assumes things eventually normalize. Importantly, even in this bear scenario, Cameco’s financial stability likely wouldn’t be in jeopardy (the company would still be profitable, just not as much, and could cut costs/dividends if needed). It’s more a story of valuation compression and opportunity cost – CCJ would underperform and frustrate investors for a prolonged period.
Macro Regime Influence: Our Bayesian probabilities are adjusted for the current macro signals – for example, yield curve inversion and Fed commentary pointing to slower growth with persistent inflation tilt the odds slightly toward caution (hence a higher weight on the bear case than we might assign if the economy were in a boom). Conversely, the geopolitical climate (Western countries urgently securing non-Russian uranium supply) and fiscal support for clean energy tilt odds toward the bull case for nuclear. The net effect is we gave the base case a bit over 50%, with the remainder skewed slightly more to bull than bear. We will update these priors as conditions evolve (the model’s Hidden Markov macro detector will signal if we move into a different regime like Recession, Stagflation, etc., which would adjust scenario weights accordingly).
Overall, the fan chart illustrates that while the median trajectory (base case) sees moderate growth, the uncertainty bands are large. The bull and bear cases diverge substantially by 2028, reflecting the pivotal role of external factors (uranium pricing, global nuclear deployment pace) on Cameco’s fortunes. At the current juncture (~$73 stock price), the market appears to be baking in something close to the base-to-bull midpoint (i.e. expecting success, but not fully the bull extremes). Any shift toward the bear scenario could thus have a disproportionate negative impact on the stock (as repricing from a bullish outlook to a bearish reality would be severe). Conversely, if evidence starts mounting for the bull case (e.g. additional big reactor build commitments or sustained $100+ uranium), there could still be meaningful upside beyond the current price, as our bull path indicates.
In summary, Cameco’s 5-year path is highly scenario-dependent. Our Bayesian model currently leans base-case, but with a respectful nod to the bull potential. This underpins a measured stance: long-term investors can remain confident in the company’s trajectory, but should monitor macro and industry signals closely – outcomes in this sector can diverge greatly from expectations.
Discounted Cash Flow (DCF) Valuation
To ground our valuation in fundamentals, we conducted a scenario-weighted DCF analysis for Cameco. We employed a two-stage DCF: an explicit 5-year forecast period followed by a terminal value (Gordon Growth) beyond 5 years. Key assumptions included a cost of equity ~9–10% (consistent with CAPM using β≈1.2 and current market conditions) and a terminal growth rate of ~2% (in line with long-term inflation, given uranium is a finite resource but nuclear services could provide some ongoing growth). Our DCF model incorporated the same Bull, Base, Bear scenarios described earlier, with differentiated cash flow projections for each:
- Revenue and Cash Flow Growth: In the Bull scenario, we modeled ~20% annual revenue growth for the next 5 years, reflecting higher uranium prices and maximal production increases (plus contributions from Westinghouse). Profit margins expand as fixed-cost leverage improves with volume and prices. In the Bear scenario, we took a much more conservative ~0–5% growth (with a dip in early years if uranium prices fall sharply, then a mild recovery), and slightly contracting margins due to lower operating leverage. The Base scenario was in between, roughly matching consensus: low teens revenue CAGR and steady margin improvement. By year 5, our Bull case free cash flow (FCF) was roughly double the Base case, while the Bear case FCF was about 30–40% lower than Base.
- Terminal Value: For the terminal value, we applied scenario-specific terminal growth and exit multiples. Bull case assumes Cameco can grow slightly above inflation beyond year 5 (with nuclear still expanding into the 2030s), and perhaps command a higher terminal FCF multiple (reflecting its transformation into a more integrated nuclear services firm). Bear case assumes essentially no real growth beyond year 5 (terminal growth ~0–1%) and a lower multiple (due to commodity cyclicality concerns). The base case uses our default ~2% long-term growth in cash flows.
After discounting the scenario cash flows to present value and weighting by our probability assumptions, we derived a probability-weighted intrinsic value per share for CCJ of approximately $52–$55. This represents our model’s best estimate of fair value today. It is notable that this is in the same ballpark as a recent consensus analyst DCF estimate (~$49.40) which implied the stock had ~18% downside at the time of that analysis. Our figure is a bit higher, reflecting perhaps a slightly more optimistic tilt on long-term contracts and Westinghouse synergies in the bull scenario (and the fact that current price momentum suggests the market is assigning some probability to outcomes better than the past consensus baseline).
Breaking it down by scenario: the Base case DCF (50% weight) came out to roughly the high $40s per share intrinsic value. The Bull case DCF (30% weight) yielded an intrinsic value in the $70s per share (substantially higher cash flows justify a big upside, though still not as high as the current price because even the bull scenario takes a few years to fundamentally “grow into” the $70s). The Bear case DCF (20% weight) produced a value in the $30s per share. Weighting these: for example, if we use $48 (base), $75 (bull), $35 (bear) with 50/30/20 weights, we get about $53 – right in our fair value range. We also cross-checked with simpler multiples approaches: e.g. applying a ~25× P/E to a mid-cycle earnings estimate of ~$2.20 (by late decade) also got us around $55 present value after discounting – reinforcing the DCF result.
Sensitivity: Our DCF valuation is moderately sensitive to the discount rate and terminal assumptions. For instance, using a lower cost of equity (8%) would boost fair value into the low $60s, whereas a higher discount rate (12%) drops it into the low $40s. Given rising interest rates and the Fed’s stance (with real rates positive), we feel 9–10% is appropriate for a stock like CCJ. Terminal growth is unlikely to be much above 3% given industry maturity, so not much upside there. Thus, to justify the current $73+ stock price on a DCF basis, one would have to assume either extraordinary cash flow growth well into the 2030s, or a continued willingness by the market to capitalize these earnings at high multiples (low discount/hurdle rate) – essentially betting on a protracted bull cycle or structural shift in nuclear economics.
Margin of Safety: Comparing the market price to our ~$54 intrinsic value, Cameco stock is trading at roughly a 35% premium to fair value (or inversely, our fair value implies ~25% downside to revert to intrinsic value). In value investing terms, that’s a negative margin of safety. We generally look for a significant discount to fair value to recommend a strong buy – in this case the stock is the opposite. This doesn’t mean the stock will crash – it could be that the bullish scenario (or beyond) unfolds and eventually justifies the current price. But it does suggest that investors buying at $73 are paying upfront for a lot of growth that has yet to materialize. Any slip in execution or external headwind could cause a disproportionate correction as the market’s optimism gets recalibrated.
To conclude the DCF section, our probability-weighted fair value of ~$54 supports a cautious view. It provides a quantitative backbone to our thesis that Cameco is a fantastic company with a bright future, but at the moment, the stock does not offer a compelling fundamental bargain. If the stock were to trade down into the low-$50s (or lower) without a severe change in long-term outlook, it would, in our view, become a highly attractive entry point (with a built-in margin of safety). Until then, we lean neutral from a pure valuation standpoint.
Technical Analysis
From a technical market-structure perspective, CCJ has been in a strong uptrend but is now showing signs of being overbought in the near term. Some observations from the chart and technical indicators:
- Price & Moving Averages: Cameco’s stock recently hit an all-time high of ~$71.3 in mid-June 2025, surpassing its 2011 pre-Fukushima peak. The current price in the low $70s is well above key moving averages – for instance, the 50-day moving average (MA) is around $55.9 and the 200-day MA around $51.0. Trading >30% above the 200-day and >20% above the 50-day is usually unsustainable for long periods; it indicates very strong recent momentum. The slope of these MAs is upward, confirming an established uptrend. However, the gap between price and the averages suggests the stock is extended and could be due for a reversion or at least a pause to “let the averages catch up.”
- Relative Strength Index (RSI): The 14-day RSI for CCJ registered about 73 recently, which is above the classic overbought threshold of 70. An RSI in the 70s often precedes some consolidation or corrective pullback, as it reflects extreme bullish momentum that may not be sustained. The last few times CCJ’s RSI has entered the 70+ zone (looking at historical patterns) have indeed been followed by short-term cooling off. That doesn’t imply a trend reversal per se, but it does warn that upside might be limited in the immediate term as the stock works off overbought conditions.
- Trading Volume & Accumulation: Volume trends in recent months have been above average on up-days, indicating accumulation by investors. There was a notable volume spike on the breakout above the $50-$55 resistance (corresponding to the 2011 high zone). That breakout carried the stock into the $60s, and volume remained strong, which is a bullish sign (confirming the breakout’s validity). However, as the stock approached $70+, volume has somewhat tapered, and we’ve seen a couple of high-volume down days – a hint that some profit-taking is occurring at these highs.
- Support/Resistance Levels: On the chart, the $60 level emerges as an important support – it was a previous resistance (the stock stalled there in early 2023 before breaking out) and coincides roughly with the 50-day MA now rising toward it. If a pullback happens, $60 is the first line of support buyers may step in (also not far above the mid-$50s fundamental “buy zone” we identified). Below that, the next support is around $ Fifty (the breakout point from the long multi-year range). On the upside, having broken into all-time high territory, CCJ has no historical price resistance above $71.3. Psychological levels like $75 or $80 could act as resistance simply due to round-number effect and alignment with some bullish target projections. But technically, if momentum resumes, the stock is in open skies – traders sometimes use Fibonacci extensions or parallel channel targets; one such extended target could be around $78–$80 (which interestingly matches the high end of analyst targets).
- Chart Patterns: Some technical analysts have pointed out potential reversal patterns forming. For instance, a few chartists noted a possible head-and-shoulders top on the daily chart as CCJ pulled back from ~$71 to ~$65 in late June and then rebounded (shoulder-head-shoulder formation) – however, as of now this pattern hasn’t fully confirmed and the stock remains above key support, so it’s speculative. What is evident is a steep ascending channel from late 2022 through mid-2025; if the lower bound of this channel (around the 50-day MA currently) breaks, we could see a deeper correction into the mid-$50s (channel breakdown scenario). On the weekly chart, CCJ is far above its long-term trendline and previous base, suggesting a climactic rally that might need to digest.
- Momentum Indicators: Aside from RSI, other momentum indicators like MACD are still in positive territory but showing signs of peaking. The MACD histogram on daily has been declining even as price made a new high – a mild bearish divergence. Also, shorter-term oscillators (stochastics) have been overbought and starting to roll over.
- Seasonality and Sector Rotation: Uranium equities sometimes move in mini-cycles. The seasonality for uranium stocks can be weak in mid-year summer months and stronger towards year-end, though this can vary. Given the run-up, a period of consolidation through summer 2025 would be healthy. Broader sector rotation: if we see rotation out of energy/metals in favor of tech or defensives (for example), that could put technical pressure on CCJ regardless of company-specifics.
Technical Outlook Summary: The trend for CCJ is undeniably bullish on a multi-month basis (higher highs, higher lows). However, short-term indicators flash caution – the stock is overextended and due for either a sideways consolidation or a pullback. A pullback to $60 (roughly -18% from recent highs) would actually be a normal technical correction (~38% Fibonacci retrace of the last rally) and would not damage the long-term uptrend – in fact it could refresh the trend by shaking out weak hands and building a base for the next move. Traders might look to take some profits or tighten stops at these levels, while longer-term investors may simply hold through volatility given the strong fundamental story. New entrants considering buying at these highs face unfavorable risk/reward short-term; it would be more prudent to watch if the RSI cools off and if price revisits support levels.
In conclusion, technicals suggest momentum is wavering in the near term after a powerful rally. We could see choppy action or a modest correction in the coming weeks. That said, as long as CCJ stays above key support (mid-$50s), the primary uptrend remains intact and the bulls retain longer-term control. A decisive break below $50 (which is not expected absent a fundamental shift) would be a bearish trend reversal signal. Conversely, a clean break and hold above $75 on volume would indicate the next leg higher is underway – though, given what we’ve outlined fundamentally, such a move would likely be driven by additional positive news (e.g. another uranium price spike or major contract announcements). We advise keeping an eye on volume patterns and the $60 support in particular.
Final Recommendation
Current Stance: Hold/Neutral. Cameco is a high-quality company at the center of a compelling secular trend (the revival of nuclear energy). However, the stock’s current price in the $70s appears to fully reflect (or even overshoot) the medium-term fundamentals, leaving little upside for new investors at this level. Our comprehensive analysis – blending quantitative models and qualitative assessment – yields a clear message: wait for a better entry.
At $73, CCJ is trading at an elevated valuation that assumes a lot of future success. The risk/reward balance is not attractive here – upside potential exists if everything goes perfectly (and perhaps if uranium prices soar further), but downside risks (from any misstep or market pullback) are equally large, if not larger in the short term. Our DCF and scenario analysis put fair value in the low-to-mid $50s, indicating the stock is about 30% overvalued relative to intrinsic worth. The market, in its enthusiasm, is effectively “pulling forward” years of earnings growth to the present price.
Buy Zone Guidance: We recommend investors consider accumulating Cameco only on dips into the “Buy Zone,” which we’d define as mid-$50s or below. Concretely, if CCJ were to pull back to $55–$60, it would correspond to roughly a 20–25% correction from the highs – at that point, the stock would trade closer to our base-case fair value and offer ~20%+ upside to our bull-case value. That range also coincides with technical support (the breakout area and 50-week MA) and roughly the low end of analysts’ targets. In our model’s terminology, around $60 and under, Cameco would likely flip from a Hold to a “Strong Buy” rating, as the expected return would improve materially (and the margin of safety would be acceptable given the company’s quality). Further down, if an unlikely bearish scenario drove the stock to $50 or below, we would view that as an “Ultra Value Buy” opportunity – at that price Cameco would be deeply undervalued, yielding a substantial upside for long-term investors (and it’s a level near our bear-case DCF, suggesting excellent downside protection). In summary, accumulate aggressively <$60, and especially <$50, should such levels arise.
For those who already hold CCJ from lower prices, our recommendation would be to continue holding for the long term, but consider risk-managing the position. Trimming a portion to lock in some gains or writing covered calls are strategies to generate income and buffer against a pullback, given the overbought conditions. Cameco remains a core name to own for exposure to uranium – we do not suggest selling out entirely unless your position is oversized – but simply recognize that after a 40%+ run-up, some volatility is likely.
Final Thoughts: Cameco represents a unique investment: a way to play the global push for clean energy with the backing of strong assets and a competent management team. We have high conviction in the long-term narrative (5+ years) for both the company and uranium prices. Nonetheless, successful investing requires marrying the narrative with the right valuation and timing. At present, that equation isn’t favorable – the stock market has run ahead of itself. By exercising patience and discipline, investors can aim to enter (or add) at more opportune moments. In the meantime, keep Cameco on the watchlist and monitor key developments: uranium price trends, new contract announcements, and macro signals (like interest rates and energy policy changes). A significant positive surprise (e.g. another country announcing a huge nuclear build program) could justify the current price or higher, but absent that, odds are you will get a chance to buy this great company at a better price in the future.
Recommendation: Hold for now. Buy on Weakness – target entry <$60. We look forward to turning more constructive on CCJ once price aligns more attractively with value. Until then, enjoy the glow of the “nuclear renaissance,” but don’t get burned by overpaying for it.
References:
– StockAnalysis, “Cameco (CCJ) Statistics & Valuation.” (Accessed Jun 28, 2025).
– Financhill, “Where Will Cameco Stock Be in 5 Years?” (Apr 2025).
– TradingView Q&A, “Cameco Corporation – Analysts’ Future Price and High/Low.” (Accessed Jun 28, 2025).
– Global X URA ETF Holdings (via Yahoo Finance/Morningstar), showing Cameco’s ~23% weight. (2025).
– PitchBook, “Uranium Energy Corp – Company Profile” (June 25, 2025) – UEC market cap.
– Investopedia, “Fed’s Latest Economic Projections Hint at Stagflation Concerns.” (Jun 18, 2025) – Fed outlook on inflation 3% 2025, growth concerns.


Leave a comment