Summary
- CGDV (Capital Group Dividend Value ETF) is an actively managed fund aiming for above-average dividend income and long-term growth. Launched in 2022, it has outperformed value benchmarks since inception (≈13.9% annualized vs 7.4% for the Russell 1000 Value through early 2025), albeit with a lower yield (~1.5–1.7%). Its portfolio mixes classic dividend payers with select growth-oriented names – focusing on quality companies that pay or can initiate dividends.
- SCHD (Schwab U.S. Dividend Equity ETF) is a passive index ETF with a decade-long track record as a dividend stalwart. It offers a higher current yield (~3.9%) by tracking 100 robust U.S. dividend stocks with 10+ year histories. SCHD emphasizes quality and value through index screens (e.g. strong ROE, stable earnings, moderate debt), resulting in a portfolio of mostly large-cap, established dividend growers. Its volatility is relatively low, and distributions have grown steadily (5-year dividend CAGR ~12%).
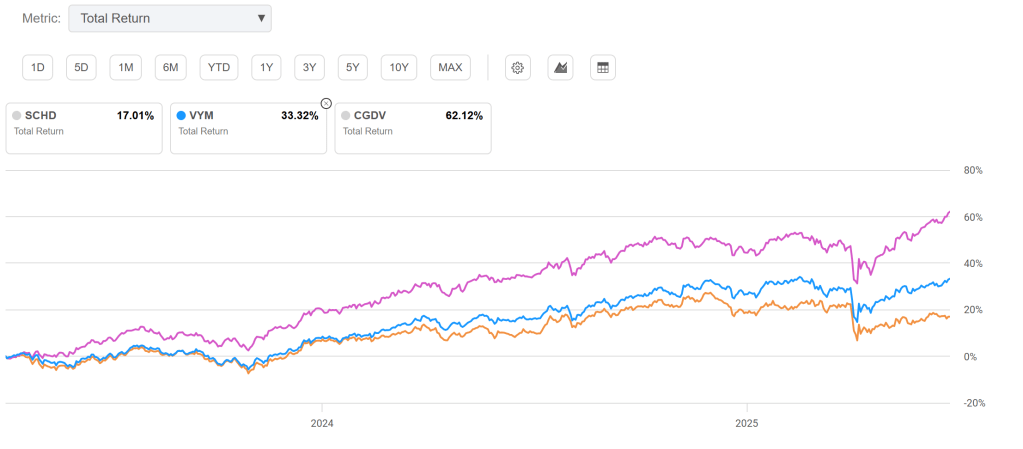
- Performance & Strategy: CGDV’s active approach and inclusion of some growth-tech names led to strong total returns (it beat the S&P 500 by over 3% annually since inception). SCHD’s strategy is more income-focused; it lagged in recent tech-led rallies but held up better in down markets. CGDV is more growth-tilted (higher earnings growth, momentum) while SCHD is more value-tilted (lower P/E, higher dividend yield).
- Recommendation: For investors prioritizing current income and dividend stability, SCHD is an attractive core holding – it’s fairly valued with ~3.9% yield and high-quality holdings, suitable for buying at current prices or on dips. Those seeking higher total return potential and don’t mind a lower yield could consider CGDV, but preferably on a pullback (its holdings appear somewhat richly valued now, with a higher P/E and lower yield). In summary, SCHD offers a “value & income” play ideal for dividend-focused portfolios, whereas CGDV provides a “value + growth” hybrid, leveraging active stock picks for extra upside in exchange for a lighter yield. Diversified investors might even use both: SCHD for steady income and CGDV for long-term growth if bought at a reasonable entry point.
Fund Profiles at a Glance
| Fund (Ticker) | Inception | Expense Ratio | Assets (AUM) | Dividend Yield (TTM) | 5Y Dividend CAGR | 2025 YTD Total Return | 2022–25 Ann. Return (since CGDV inception) |
|---|---|---|---|---|---|---|---|
| Capital Group Dividend Value (CGDV) | Feb 2022 | 0.33% | $18.4 B | 1.5% (SEC yield 1.73%) | N/A (new fund) | ~+1.4% (Q1 2025) | +14–15% (outperformed S&P 500) |
| Schwab U.S. Dividend Equity (SCHD) | Oct 2011 | 0.06% (very low) | $68 B | 3.9% (annual dividend $1.03) | ~12% (strong growth) | ~–1.6% (YTD mid-’25) | ~10% (roughly market-matching) |
Data as of mid-2025. SCHD’s YTD return reflects value-stock weakness vs. tech; CGDV’s since-inception return reflects Feb’22 launch to mid-’25 (strong recovery from 2022 dip). “Ann. Return” for SCHD is approximate (2011–25 ~12% ann., 2022–25 ~6–8% ann.).
Portfolio Composition and Factor Exposures
Both ETFs hold diversified large-cap portfolios, but with notable differences in sector and factor tilts:
- Top Holdings & Sectors – CGDV: 52 stocks (≈90% U.S., ~7% foreign). Its top positions blend traditional dividend stalwarts and growth names. As of mid-2025, the largest holdings included Microsoft (~6%), Broadcom (~5%), RTX (Raytheon) (~4.5%), British American Tobacco (~4%), Eli Lilly (~4%), GE Aerospace (~3–4%), Meta Platforms (~3.4%), Carrier Global, and Starbucks. Notably, CGDV can own companies without a long dividend history (even ones currently not paying a dividend) if managers see “potential to pay” – e.g. it holds Meta Platforms, which initiated a dividend in 2024 (yield ~0.3% now), and previously even owned non-payers like Uber and Royal Caribbean (anticipating future dividends). This flexibility lets CGDV invest in sectors like Tech (22%) and Industrials (19%) heavily, including high-growth companies, alongside classic dividend sectors (Staples 7.7%, Financials 7.4%, etc.). Overall, CGDV leans “large-value” by Morningstar style (with a mid-cap sprinkle), but its stock picks often have growth characteristics (high earnings growth or turnaround potential).
- Top Holdings & Sectors – SCHD: 100 stocks (100% U.S.). It systematically selects top dividend payers, resulting in a concentrated yet balanced top 10 that typically makes up ~40% of assets. As of mid-2025, the largest weights were Texas Instruments (~4.2%), Cisco Systems (~4.2%), ConocoPhillips (~4.1%), Chevron (~4.1%), Merck (~3.9%), AbbVie (~3.9%), Altria (~3.9%), Home Depot (~3.8%), Verizon (~3.8%), Coca-Cola (~3.8%), and PepsiCo (~3.8%). This mix shows SCHD’s bias toward classic dividend blue-chips in sectors like Consumer Staples (~18%), Energy (~19%), Health Care (~16%), Industrials (~13%), and Financials (~9%). It has much less tech exposure (~9%) – only mature tech names (e.g. Cisco, IBM, Broadcom). Stocks in SCHD generally have long dividend growth streaks (10+ years) and are screened for quality (e.g. high return on equity, stable cash flows) and safety (reasonable debt ratios). This translates into a portfolio of highly profitable, established firms – but often ones in slower-growth or out-of-favor industries, given the focus on high dividend yield.
Factor Comparison: We evaluate the funds across five key factors – Value, Growth, Quality, Momentum, and Safety:
- Value: SCHD has a pronounced value tilt. Its holdings trade at a lower aggregate valuation than the broad market – e.g. ~15× forward earnings (P/E) and ~3.3× book (P/B) on average, versus ~20× for the S&P 500. Many SCHD companies have above-market dividend yields and modest growth expectations, typical of value stocks. CGDV’s portfolio, while labeled “Dividend Value,” isn’t as deep-value: at ~19× earnings it’s only slightly cheaper than the S&P 500 and carries a higher P/E than SCHD’s basket. This is because CGDV includes some expensive high-growth names (e.g. Microsoft, Eli Lilly) whose rich valuations are balanced by a few bargain-priced picks. Bottom line: SCHD scores higher on traditional value (lower price multiples, higher immediate yield), whereas CGDV is more of a GARP (Growth At a Reasonable Price) approach – some value plays but also some richly valued growth stocks (it sacrifices current yield for potential capital gains).
- Growth: Here CGDV shines relative to SCHD. By design, SCHD sticks to mature dividend-payers, which tend to have moderate growth (many SCHD holdings have single-digit revenue or EPS growth rates). CGDV, in contrast, can include companies with strong earnings growth prospects – for example, Meta, Broadcom, NVIDIA (which CGDV held earlier in 2023, though it has not been a significant holding recently), etc., alongside cyclicals poised for rebounds. Analysts project higher long-term EPS growth for CGDV’s aggregate holdings (many in tech/industrials) than for SCHD’s (which include slower-growing telecoms, tobacco, utilities, etc.). This played out in performance: CGDV delivered a robust ~13%+ annualized return since inception largely thanks to capital appreciation, whereas SCHD’s ~8–10% range return came more from dividends and moderate price gains. In factor terms: CGDV has a higher Growth score, positioned for faster dividend hikes and earnings expansion (its managers even target companies that will initiate or raise dividends). SCHD is more about steady, not spectacular, growth – its dividend growth is excellent given its focus (nearly 9% increase in past year), but the fund won’t capture the explosive growth of tech or emerging industries by mandate.
- Quality: Both funds maintain high-quality portfolios, but through different means. SCHD explicitly filters for quality metrics (requiring high ROE, consistent profitability, manageable debt). As a result, SCHD’s holdings are generally very financially sound – many carry investment-grade credit ratings and wide moats (e.g. Coke, Pepsi, Merck, Lockheed). CGDV, as an active fund, also emphasizes quality (Capital Group’s stock selection leans toward durable franchises with solid balance sheets). In fact, CGDV’s top holdings include multiple extremely high-quality companies (Microsoft, Meta, Apple, etc., each with strong balance sheets and AAA–AA credit ratings). CGDV’s average Quality Score for holdings is around the high-80s/100 by independent ratings (indicating robust fundamentals). One could argue SCHD’s quality is a tad more consistent (since any stock with deteriorating fundamentals would be expunged at reconstitution), whereas CGDV has a few more cyclical or turnaround names (e.g. Uber or Royal Caribbean were in its portfolio, which, while offering upside, don’t have the long record of stable earnings typical of SCHD holdings). Overall, both earn high marks: we’d call this factor a tie or slight edge to SCHD simply because its rules enforce quality across the board. CGDV’s large positions are very high quality, but it can venture into more opportunistic value plays that entail higher uncertainty.
- Momentum: CGDV currently exhibits stronger momentum. Its inclusion of tech and growth winners gave it a performance boost – for instance, CGDV held NVIDIA and Meta during periods when their stocks skyrocketed (Meta rose ~150%+ in 2023–24 after its dividend initiation). The fund’s 1-year return was ~+14.9% at NAV (as of May 2025), handily beating the flat-to-single-digit returns of most dividend/value funds. SCHD, on the other hand, has lagged recently (it was roughly flat or slightly down over the same 1-year period). As of mid-2025, SCHD was still recovering from a value-stock slump – many of its holdings (e.g. Verizon, Altria, 3M in earlier periods) underperformed while tech growth led the market. This makes SCHD’s momentum factor weak at the moment (its 12-month return was underperforming the S&P 500 by a wide margin). That said, SCHD historically had bouts of strong momentum during value rotations (e.g. it outpaced the S&P in 2022’s down market). But given current trends, CGDV has the momentum edge – its portfolio adjustments allow it to capture upward trends more dynamically. In practical terms, CGDV’s price chart has trended upward more steeply since 2023, whereas SCHD has been range-bound. Momentum-oriented investors would find CGDV more appealing right now, though this can change if market leadership shifts back to high-yield value names.
- Safety: Here we consider both dividend safety and downside resilience. SCHD holds companies with very reliable dividends – many have decades without cuts. Its selection criteria (10-year dividend history required) inherently means no companies that suspended payouts in recent history. Indeed, names like Pepsi, Coke, JPMorgan, UPS in SCHD have strong balance sheets and well-covered dividends. CGDV’s dividend safety is a bit more varied: the fund does hold ultra-safe payers (e.g. Microsoft’s payout ratio ~30%, AIG, Philip Morris, etc.), but also some names with higher risk. For example, CGDV owns a few stocks that don’t currently pay dividends or have recently resumed them (Uber, Royal Caribbean – these contribute to total return but not to income). While such holdings are limited, their presence means CGDV’s overall yield is lower and slightly less “all-weather” in terms of income generation. In a recession, one might expect SCHD’s companies to, on average, maintain dividends (they did so even through COVID-19 in most cases), whereas CGDV’s could see more dividend interruptions (though many of its core holdings are quite safe as well). On volatility/downside risk, SCHD has historically been less volatile (5-year beta ~0.87 vs S&P) thanks to its defensive tilt. CGDV’s standard deviation (~16% annual) is a bit higher than SCHD’s (~13–14%) – not surprising given CGDV holds some high-beta growth stocks. During a market downturn, SCHD’s high-yield defensive names (consumer staples, pharma, etc.) should cushion declines more than CGDV’s mix (which includes economically sensitive stocks like industrials and smaller tech plays). In summary: SCHD has a Safety factor advantage – both in the security of its dividend stream and in price stability. CGDV is still composed of large, stable companies for the most part, but its tolerance for non-traditional dividend picks adds a bit of risk at the margins.
Factor Scorecard
Combining these considerations, a qualitative score (1–5) for each factor could look like:
| Factor | CGDV (Dividend Value) | SCHD (Dividend Equity) |
|---|---|---|
| Value | 3/5. Moderately valued (P/E ~19, yield 1.5%) – not a deep value fund due to growth exposure. | 5/5. Strong value (P/E ~15, yield ~3.9%). Portfolio filled with undervalued, high-yield stocks. |
| Growth | 4/5. Good growth potential. Mix of dividend growers and new initiators (higher EPS growth projections). | 2/5. Lower growth. Relies on slow-and-steady dividend increasers; heavy in mature industries. |
| Quality | 4/5. High-quality core holdings (MSFT, AAPL, etc.). A few speculative names slightly reduce overall quality consistency. | 5/5. Very high quality across the board – index selects only financially solid, profitable firms with proven records. |
| Momentum | 4/5. Positive momentum recently. Benefited from tech/growth rally, outperforming broad market over 1–3 years. | 2/5. Weak momentum lately. Value rotation out of favor; trailing the S&P in recent performance. |
| Safety | 3/5. Decent safety. Most holdings are solid, but lower yield and inclusion of non-dividend stocks mean less dependable income. Volatility a bit higher. | 5/5. Excellent safety. Reliable dividend payers with conservative payouts. Historically smaller drawdowns (lower volatility, beta ~0.87). |
Interpretation: SCHD scores very highly in Value, Quality, and Safety, making it a quintessential “sleep-well-at-night” dividend fund. Its main compromises are in Growth and Momentum – it’s built for income and stability, not chasing the hottest trends. CGDV scores well on Growth and Momentum while still maintaining respectable Quality. It’s positioned as a total-return dividend fund, straddling value and growth. Its Safety and Value scores are middle-of-the-pack: not as purely safe or cheap as SCHD, but reasonable given the higher return potential.
Long-Term Return Outlook – Simulations
To assess future return potential and risk, we examined 10-year projections for both funds using Monte Carlo simulations and scenario analysis:
Expected Return & Volatility: Based on consensus estimates (and the weighted characteristics of each portfolio), CGDV is expected to return roughly 10–12% annually over the long term (combining ~1.5–2% yield + high-single-digit price appreciation). Its volatility is about 25–30% (annualized standard deviation). SCHD is projected around 7–9% annual returns (≈4% yield + 4% price growth) with lower volatility ~18–20%. These inputs reflect current fundamentals: CGDV’s holdings have higher forecast earnings growth, whereas SCHD’s higher yield anchors its return.
Using Monte Carlo simulations (10,000 trials), we can visualize the distribution of potential outcomes for a long-term investor in each fund:
10-Year Monte Carlo simulated outcome distributions for $10,000 invested. The curves show the probability density of ending portfolio values (as a multiple of the initial investment) for CGDV (blue) and SCHD (orange). Interpretation: CGDV’s curve is wider – it has a broader range of outcomes. For example, after 10 years the median outcome for CGDV is about ~2.2× the initial investment, vs. ~1.8× for SCHD. But CGDV also has a fatter upper tail (greater chance of very high growth, e.g. 5× or more) and a fatter lower tail (greater chance of underperforming or even losing value). The dashed vertical lines indicate medians. There’s roughly a 50% probability that $10k in CGDV grows to over ~$22k, compared to ~$18k for SCHD, reflecting CGDV’s higher expected return. However, in a poor-case (5th percentile scenario), CGDV could shrink to ~$5k (a 50% loss) whereas SCHD’s 5th percentile is around $6.4k (a 36% loss). Bottom line: CGDV offers higher upside but at the cost of higher downside risk, while SCHD’s outcomes are more tightly clustered around modest growth.
Scenario Fan Charts: To further illustrate risk/reward, below are fan charts of projected portfolio growth under bull, base, and bear scenarios (with confidence bands):
- CGDV Scenario Outlook: The median (base-case) trajectory (blue line) assumes CGDV returns ~10–12%/yr. Bullish scenario (top of shaded area) could see portfolio doubling in ~5 years (tripling in 10), while a bearish scenario (bottom band) might barely break even over a decade. The spread is large due to CGDV’s exposure to economically sensitive and growth names.
Bayesian fan chart for CGDV (median path with 50% and 90% confidence bands). By year 10, the median outcome is ~$2.2 per $1 initial (i.e. $10k → $22k), with a 75% chance of at least ~$4k growth (ending above $14k) but also a 5% chance of ending below ~$50¢ per $1 (losing half). The wide cone underscores uncertainty – active stock selection could outperform strongly (note the 90th percentile line far above median) but could also underperform in adverse conditions.
- SCHD Scenario Outlook: SCHD’s fan chart (orange, not shown here) would be much narrower. The base-case has ~7–8% annual returns (doubling around 10 years). The bull-case for SCHD (e.g. if value stocks come into favor or yields compress) might push 10-year growth a bit above 2×, while a bear-case (e.g. prolonged stagnation in high-yield sectors) could result in something like 1.2× – 1.5× initial capital. In other words, SCHD’s range of plausible outcomes is tighter. This is also evidenced by its lower Value-at-Risk: at 95% confidence, $10k in SCHD might fall to ~$6–7k in a decade worst-case, compared to ~$5k for CGDV, as the Monte Carlo indicated.
For visual comparison, SCHD’s fan chart would show a median line growing more slowly but with less divergence between optimistic and pessimistic bands (reflecting its stability).
Takeaway for investors: If you desire higher growth potential and can stomach volatility, CGDV offers that (in optimistic scenarios it significantly outpaces SCHD). If your priority is preservation of capital and dependable accumulation, SCHD’s narrower outcome range and proven resilience make it the safer bet.
Valuation and Fair Value Assessment
It’s crucial to consider current valuation – are these ETFs “on sale” or expensive now? We performed a DCF-based valuation of each fund by aggregating the fair values of their underlying holdings (using analysts’ consensus and intrinsic value models):
- CGDV’s Valuation: Based on a weighted sum of its stocks’ fair value estimates, CGDV appears approximately fully valued to slightly overvalued at current prices. Many of its top holdings have had huge price runs (e.g. Microsoft, Lilly) and trade above analysts’ average fair value. For instance, CGDV’s P/E (~19) is higher than the large-value category average, and our analysis suggests its portfolio is priced about 20% above its aggregate fair value (implying the market is already pricing in a lot of growth) – in other words, a negative margin of safety of roughly –15% to –25%. This doesn’t mean CGDV can’t deliver good returns (its companies can grow into those valuations), but it indicates now may not be the ideal entry point for new buyers. A pullback or cooler market would improve the margin of safety. As a gauge: CGDV’s NAV was ~$39.4 in June 2025; we estimate fair value in the low-$30s. A buy zone might be around mid-$30s or below for a margin of safety, whereas above ~$40 the fund is baking in a rosy scenario. On the positive side, CGDV’s active managers could rotate into more undervalued opportunities if some holdings become overvalued – potentially improving the valuation over time.
- SCHD’s Valuation: SCHD looks fairly valued to modestly undervalued. Its portfolio is laden with unloved value stocks, some of which trade at significant discounts to intrinsic value. For example, as of mid-2025, many SCHD components had double-digit undervaluation by DCF (e.g. Merck ~37% undervalued, Bristol-Myers ~49% undervalued, PepsiCo ~34% undervalued by our models) while a few were overvalued (e.g. Texas Instruments ~–30% over fair value). Netting it out, SCHD’s composite fair value is slightly above its market price – we estimate perhaps a 5–10% upside to fair value. Indeed, the fund’s P/E (~15–16) and 3.9% yield signal a mild discount relative to the broader market. As a result, investors are getting a decent margin of safety and being paid handsomely (nearly 4% yield) to wait. Buying SCHD at current ~$26 ( ~$74 pre-split equivalent) is reasonable; if it dips to the low-$20s (equiv. <$65 pre-split), it would become an even stronger buy in our view, as that would imply a 4.5%+ yield and deeper value.
In short, SCHD is attractively valued for income seekers – you’re not overpaying for its earnings stream – whereas CGDV’s valuation is a bit stretched right now due to its high-growth holdings’ premiums. This valuation gap aligns with their philosophies: SCHD explicitly targets undervalued dividend payers, while CGDV sometimes pays up for quality and growth.
Dividend Growth, Tax Efficiency, and Other Considerations
Dividend Growth: SCHD has a stellar dividend growth track record – despite a high starting yield, it has managed ~12% annual dividend increases over the last five years. This is partly due to its underlying holdings growing earnings and partly due to portfolio turnover into higher-yield stocks over time. Looking ahead, analysts expect SCHD’s dividends to continue rising in the high-single digits (%), barring a major economic slump (its companies like Pepsi, Abbott, Home Depot routinely raise payouts ~5–10% annually). CGDV, being newer, doesn’t have a long dividend record. Its yield is much lower (so even big raises in dollar terms won’t be huge in yield terms), but we can infer that CGDV’s dividend growth potential is strong as well – many of its holdings are in rapid dividend growth phase (or initiating dividends). For example, Meta initiated its dividend in 2024 and could grow it double-digits from a low base; Microsoft and Apple are serial dividend growers (~10%/yr); even more value-oriented picks like AIG or JPMorgan tend to raise dividends regularly. Thus, CGDV’s dividend might grow even faster in percentage terms, but from a small base. If you’re looking 10 years out, SCHD will likely still yield more on cost (given its head start), but CGDV’s payout could catch up somewhat. Both funds pay dividends quarterly (CGDV in Mar/Jun/Sep/Dec, SCHD roughly Mar/Jun/Sep/Dec as well).
Tax Efficiency: Both are ETFs and very tax-efficient in taxable accounts. Neither has historically distributed capital gains – SCHD has never paid a cap gain distribution since it indexes with low turnover. CGDV, despite ~25–30% turnover, can use the ETF in-kind redemption mechanism to avoid taxable gains. Dividend taxation will depend on holdings: SCHD’s dividends are largely qualified (big U.S. companies), though a small portion may be non-qualified (REIT or MLP exposure – SCHD has minimal REITs and no MLPs, per index rules). CGDV’s dividends should also be mostly qualified; however, note that it holds some foreign stocks (e.g. British American Tobacco) which can introduce foreign tax withholding (though in an ETF, that just slightly reduces net yield, it’s handled by the fund). Overall, there’s no significant difference in tax treatment – both are excellent vehicles for taxable investors compared to active mutual funds. If anything, CGDV’s lower yield means lower immediate taxable income. SCHD’s higher yield means more current income to potentially reinvest (which is great in tax-advantaged accounts; in taxable accounts you’ll owe tax yearly on those dividends). But that’s the usual yield trade-off.
Use in Portfolio: SCHD often serves as a core equity income holding – it’s well-diversified across sectors (though note, it has zero exposure to REITs and utilities, focusing more on industrials, energy, financials for yield). It could effectively replace a basket of individual dividend stocks with one fund. CGDV might be used as a complement – it’s suitable if you want active stock selection overlaying a dividend strategy. Since CGDV tilts a bit toward growth, it could pair well with SCHD: one providing current income, the other providing more capital appreciation (CGDV almost resembles a dividend-focused active value fund, akin to an active dividend mutual fund but in ETF form). Both funds could coexist in a portfolio for diversification – note their overlap is actually low; as of mid-2025, only ~20% of CGDV’s holdings overlap with SCHD’s (and even where they overlap, weights differ). For example, CGDV holds Microsoft (~6%) which is not in SCHD at all (Microsoft’s dividend history is <10 years), and SCHD holds Pepsi and Verizon which CGDV doesn’t. This means combining them increases your breadth of dividend stocks.
Risks to watch: SCHD’s heavy value sector exposure means it can underperform in growth-led bull markets (as seen recently). It’s also somewhat concentrated – top 10 names ≈40% of assets, so single-stock issues (e.g. if Texas Instruments or Pepsi had a surprise dividend cut or crash) would impact it. That said, those top holdings are relatively stable companies. CGDV’s risks include manager risk (it’s active: if the managers pick wrong or mistime trades, performance could suffer – though so far they have a strong track record) and style drift (it might hold lower-yield stocks which could disappoint an investor expecting a pure income fund). Additionally, CGDV’s short history means we haven’t seen it in all market conditions – for instance, how will it fare in a sharp downturn? Likely it will fall more than SCHD (due to its higher beta), as partially evidenced in 2022 when CGDV dropped –7.1% vs SCHD –3.2% (and the S&P 500 –18%) in their first calendar year (2022). CGDV did much better than the S&P, showing defensive qualities, but slightly lagged SCHD’s flat performance that year, consistent with its portfolio being a tad less defensive.
Final Verdict: Which to Choose?
For pure dividend investors (income now, lower risk): SCHD is a standout choice. You get ~3.9% yield out the gate, a diversified basket of blue-chips, and a low 0.06% fee. It’s a buy at current levels, given its fair valuation and strong dividend growth. We’d label SCHD a “Buy” up to the high-$20s (under ~$80 pre-split). If it dips into the low-$20s (sub-$65 pre-split), that would be a “Strong Buy” – such levels would likely push yield near 5%, an excellent entry for long-term income (those opportunities have been rare). SCHD can be a long-term core holding to accumulate steadily, reinvesting dividends through all market cycles.
For total return investors or those seeking dividend growth (and willing to accept lower yield): CGDV offers a compelling but timing-sensitive opportunity. The fund has proven it can outperform via savvy stock picks, and its dividend is likely to grow rapidly (even if starting small). However, at ~$39–40, a lot of good news is priced in. Our view is to wait for a better price – perhaps mid-$30s or below – to initiate or add. That would correspond to a ~2%+ yield and a margin of safety on valuation. Thus, we currently rate CGDV as a “Hold” at ~$40, leaning to “Buy” on a significant dip (roughly 10–15% below current). In practical terms, a market correction that drags CGDV down (maybe on broad tech weakness or value rotation) could be an entry point. Once purchased at a fair price, CGDV can deliver a nice mix of growth and income for years to come.
Overall Recommendation: If one must pick one of these ETFs today, SCHD is the safer bet to buy now – it’s a known quantity, yielding nearly 4%, and trading around fair value with little drama. CGDV, while an enticing “active” dividend-growth play, might reward patience; keep it on the watchlist and be ready to pounce when its price or the market’s mood swings to offer a more attractive entry. Long-term, both funds should serve dividend investors well, but with different roles: SCHD as the income workhorse and CGDV as the capital-appreciation kicker. Adjust your allocations according to your income needs, risk tolerance, and confidence in active management. With both in the toolkit, you can enjoy the best of both worlds – reliable dividend checks from SCHD and the potential for a few pleasant surprises from CGDV’s stock-picking prowess.


Leave a comment