Spotify Technology S.A. (SPOT) – Vulcan-mk5 Model Analysis
Summary
Spotify Technology S.A. (NYSE: SPOT) has experienced a monumental rally over the past year, raising the question of whether the stock still offers attractive upside. Our 12-month primary recommendation is a Buy, supported by strong fundamentals and improving profitability, though tempered by recent valuation expansion. Over the mid-term (2–3 years), we remain bullish as Spotify’s growth strategy and market position solidify, while our long-term (5+ year) outlook is optimistic but cautious given rising competition and potential market saturation. Key highlights from our analysis include:
- 12-Month Outlook (Buy): Current share price around ~$550 appears ~15–20% below intrinsic value estimates (mid-$600s)simplywall.stfintel.io. Strong user growth, pricing power, and cost efficiencies are driving rapid earnings improvements, supporting further upside over the next year. We see a favorable risk-reward, but volatility remains high after a >100% gain in the past yearfintel.io.
- Mid-Term (2–3 Year) Outlook: Outperform. Spotify’s continued expansion in music and podcasts, coupled with margin growth, positions it to outperform over the next few years. We expect user monetization and operating leverage to sustain double-digit revenue growth and outsized EPS gains (~58% EPS CAGR through 2025nasdaq.com). Barring major competitive disruptions or macroeconomic downturns, SPOT’s mid-term trajectory remains positive.
- Long-Term (5+ Year) Outlook: Positive, with some risks. Spotify’s long-run vision of becoming a leading audio platform underpins a bullish long-term view, as the company could scale to billions of users and significantly higher free cash flows. However, competition from Big Tech (Apple, Amazon, Google) and the evolving economics of content licensing are key long-range risks. While we anticipate Spotify will continue to lead and innovate (e.g. in podcasts and creator content), investors should expect higher uncertainty in 5+ year outcomes.
This report provides a Key Metrics Snapshot for SPOT, a detailed Risk Assessment (volatility, Sharpe/Sortino ratios, downside risks), and an Investment Thesis breakdown spanning Valuation, Momentum, Macro, and Technical factors. We also include a Monte Carlo simulation of 10,000 possible 12-month price outcomes and a Bayesian scenario analysis (Bear, Base, Bull cases) to illustrate the range of potential future values. Readers interested in Spotify’s short-term drivers should focus on the 12-Month Outlook and Valuation sections, while those with a longer horizon may find the Mid/Long-Term Outlook and Risk Assessment especially relevant.
12-Month Outlook and Primary Recommendation
Recommendation (12M): Buy. We project Spotify’s stock will outperform over the next 12 months, supported by a favorable valuation gap and strong operational momentum. The current share price of ~$550 (as of Apr 1, 2025) trades at an estimated 15–20% discount to fair value. Our model and external sources estimate SPOT’s intrinsic value in the mid-$600s per share. For example, a 2-stage DCF analysis pegs fair value around $680+, and the average analyst 1-year price target is $652. This suggests meaningful upside from current levels, and our 12-month price target is in this mid-$600s range.
Several catalysts underpin our bullish one-year outlook:
- Improving Fundamentals: Spotify has recently turned profitable on a net income basis, with trailing P/E ~97 and forward P/E ~50stockanalysis.com. Free cash flow has surged, bringing the EV/FCF ratio down to ~44× (trailing)stockanalysis.com – high in absolute terms, but much improved vs. prior years. The company’s operating margins and ROIC have expanded significantly (TTM ROIC ~23.5%nasdaq.com), thanks to price increases and cost controls. For 2025, consensus forecasts ~11% revenue growth to $18.9B and ~72% EPS growth to $10.2nasdaq.com – robust improvements that should further justify stock gains.
- User Growth and Monetization: Spotify continues to add users at a rapid clip. In Q4 2024, Monthly Active Users (MAUs) grew by 35 million to 675 million, beating guidancenasdaq.com. Premium subscribers and ARPU are rising due to successful price hikes and features like the annual Wrapped campaignnasdaq.comnasdaq.com. These trends indicate Spotify can increase revenue per user without stalling growth, a bullish sign for the next year’s earnings trajectory.
- Market Sentiment & Momentum: Despite the recent pullback from all-time highs (~$652 in Feb 2025tradingview.com), investor sentiment remains broadly positive. The stock is still trading above key moving averages (e.g. 50-day MA) signaling an uptrendnasdaq.com. It has vastly outperformed the market over the past year (+112% vs S&P 500’s ~31%investing.com), and while such momentum may moderate, it reflects strong market confidence. Notably, Spotify carries a Zacks Rank #2 (Buy) and has attracted bullish analyst coverage in recent monthsnasdaq.com. Our expectation is that continued execution on growth and margin goals will sustain positive sentiment over the next 12 months.
12-Month Rationale: In sum, we believe SPOT’s current valuation leaves room for ~20% appreciation as the company delivers on earnings growth and the market recognizes its improved cash generation. The primary risks to our 1-year view are a broader market correction (SPOT is high-beta and would likely fall harder), or company-specific setbacks such as slower subscriber growth or margin compression. Barring those, the combination of double-digit sales growth and expanding free cash flow supports a Buy for the year ahead.
Mid-Term (2–3 Year) Outlook
Mid-Term Recommendation: Outperform (Bullish 2–3Y). Our mid-term view remains positive, as Spotify’s strategic initiatives and industry tailwinds should play out over the next few years. By 2027, Spotify is targeting substantially higher margins and has laid out a path for “year of accelerated execution” in 2025 with further gross margin expansion. Over a 2–3 year horizon, we anticipate:
- Continued Revenue Growth: Even after the post-pandemic user boom, Spotify’s revenue is forecast to grow ~12–15% annually in 2025 and 2026nasdaq.com. This growth will likely be driven by both subscriber increases (international expansion, penetration into new demographics) and ARPU uplift (premium tier price increases, upselling high-end plans, ad monetization in podcasts). The total addressable market for audio streaming remains large, leaving room for Spotify to increase its ~550+ million user base toward the company’s long-term billion-user goal.
- Margin Expansion & Profitability: Spotify’s push into positive earnings and cash flow is expected to accelerate. Operating expenses have been reined in (including headcount reductions in 2023), and gross margins are improving with scale and podcast monetization. Over 2–3 years, analysts see Spotify’s EPS growing at a ~50% CAGR (e.g. ~$13 in 2026 EPS, +28% YoY from 2025)nasdaq.com. Free cash flow should grow even faster as content investment stabilizes. The stock’s valuation on a forward basis thus becomes more reasonable: Rosenblatt’s recent analysis values SPOT at 35× 2026 FCF for a $658 targetinvesting.com. By 2026–27, if Spotify delivers ~$3–4B in annual FCF, the stock could justify prices well above current levels.
- Business Model Expansion: In the medium term, Spotify is likely to explore new revenue streams (audiobooks, higher-tier subscriptions, creator monetization tools) and deepen its platform moat. Its leadership in personalized content and global reach is an advantage that should compound over time. We expect Spotify to maintain its dominant position in music streaming while growing its share in podcasting and other audio, which supports a bullish mid-term outlook.
Risks in the 2–3 year view include the potential for growth to decelerate as the law of large numbers sets in (as noted by some skeptics, and the possibility of increased content costs (e.g. renegotiation of music royalties or exclusive podcast deals) pressuring margins. Still, given management’s execution so far and the secular shift toward streaming audio, we believe Spotify can outperform the broader market in the mid-term. We maintain an Overweight stance for a 2–3 year investment horizon, expecting solid compounding returns.
Long-Term (5+ Year) Outlook
Long-Term Recommendation: Cautiously Bullish. Over a 5+ year horizon, we envision Spotify as a structurally profitable, potentially much larger digital media platform, but also acknowledge greater uncertainty the farther out we look. Our long-term view is bullish in that we expect Spotify to be a significantly more valuable company by 2030, yet investors should be mindful of competitive and macro risks that grow over time. Key elements of our long-term outlook include:
- Scale and Network Effects: Spotify’s massive user base and data advantages could make it the de facto audio platform worldwide, enabling high-margin services on top of music streaming. If it executes well, in five years Spotify might host not just music and podcasts, but a broader creator economy (think live audio, exclusive content, etc.). Such an ecosystem could yield new revenue streams and deepen user engagement, reinforcing a winner-takes-most dynamic in audio.
- Margin Potential: Long-term profit margins are likely to improve as subscription revenue scales (software-like economics) and as newer segments (podcasting, advertising, marketplace services for artists/podcasters) contribute a greater share. Spotify’s CEO has mentioned long-term gross margin targets of 40%+ for the podcast segmentnewsroom.spotify.com, which would be transformational if achieved. Our 5-year base case assumes Spotify approaches 15–20% operating margins, up from low single digits currently – a trajectory that could justify a much higher stock price if realized.
- Valuation and Return Expectations: Assuming Spotify continues to grow revenues in the low-teens percent annually and expands margins, its earnings and FCF in 5+ years could be multiples of today’s. Even with more conservative assumptions, our DCF models indicate a potential bull case north of $800/share by 2028–2030. Long-term oriented investors could thus see substantial upside. However, given the uncertainties, we would not be surprised by periods of significant volatility or even multi-year stagnation in the stock on the way to those gains.
- Competitive and Macro Risks: The long-term is where competitive moats will truly be tested. Big Tech competitors (Apple Music, Amazon Music, YouTube Music) all have deep pockets and ecosystems that could limit Spotify’s market share or pricing power. Additionally, the broader tech/media landscape may evolve (e.g. new formats like AI-generated content or changing consumer behaviors). Spotify’s ability to remain the platform of choice is not guaranteed, especially if, say, Apple were to bundle music/podcasts more aggressively. Macro-wise, over 5+ years we could see recessions or regulatory changes (such as EU digital market regulations or higher royalty mandates) that impact Spotify’s business model. These risks mean that while we are long-term bullish, we assign a higher uncertainty to 5+ year outcomes. Position sizing and risk management are important for long-horizon investors in SPOT.
In summary, our long-term stance is optimistic with caution – we expect Spotify to be a bigger and more profitable company in five years, likely rewarding patient investors, but one must be prepared for competitive battles and potential disruptions along the way. We recommend a long-term Buy for those with high risk tolerance, and suggest revisiting the thesis periodically as the industry evolves.
Key Metrics Snapshot (SPOT)
Below is a summary of Spotify’s key valuation, growth, and risk metrics, incorporating the latest data (as of April 1, 2025) and our Vulcan-mk5 model outputs:
| Metric | Value | Notes |
|---|---|---|
| Current Share Price | ~$550 (USD) | Price at close on Mar 31, 2025stockanalysis.com. |
| Estimated Fair Value | ~$680 (USD) | DCF-based intrinsic value estimatesimplywall.st. |
| Discount to Fair Value | ~18% undervalued | Price is ~18% below our fair value (potential upside). |
| Market Capitalization | ~$112.6 B | Large-cap growth stockstockanalysis.com. |
| Enterprise Value (EV) | ~$107.8 B | EV reflects net cash on balance sheetstockanalysis.com. |
| EV/Free Cash Flow (TTM) | ~43.6× | Enterprise Value to TTM FCFstockanalysis.com – indicates growth stock valuation. |
| PEGY Ratio (5-yr expected) | ~1.4× | PEG ratio ~1.4 (no dividend)stockanalysis.com, reflecting high growth expectations. |
| Price/Sales (TTM) | ~6.8× | Revenue multiple, high but inline with peer growth companiesstockanalysis.com. |
| Dividend Yield | 0% (none) | Spotify pays no dividendstockanalysis.com. |
| Beta (5Y) | ~1.67 | 5-year beta vs market ~1.7stockanalysis.com (higher volatility than S&P 500). |
| 1-Year Price Volatility | ~42% (std. dev.) | Realized volatility of 42% over past yearfintel.io. |
| 1-Year Sharpe Ratio | ~2.5 | Excess return per risk (very high)fintel.io. |
| 1-Year Sortino Ratio | ~5.1 | Even higher when considering downside volatilityfintel.io. |
| Analyst 12-mo Target (Avg) | ~$652 | Street consensus price targetfintel.io (range ~$382 to $766). |
| Moody’s Credit Rating | Ba1 (speculative) | Not investment grade – reflects higher debt/earnings balance. |
| Next Earnings Date | Apr 29, 2025 | Q1 2025 earnings releasestockanalysis.com. |
Table: Key metrics for Spotify stock. Valuation multiples and ratios highlight Spotify’s growth orientation (e.g. high EV/FCF, elevated PEG), while risk metrics show a volatile but rewarding profile (Sharpe >2). The stock trades below calculated fair value, supporting a bullish stance, though a lack of dividend and a speculative-grade credit rating underscore that this is a growth investment rather than an income or low-risk play.
Risk Assessment
Spotify exhibits a high-risk, high-reward investment profile. Below we evaluate its risk and quality metrics, as well as qualitative risk factors:
- Volatility & Beta: SPOT’s share price has been volatile, with a 1-year volatility ~42%fintel.io. Its 5-year beta of ~1.7stockanalysis.com means Spotify tends to move ~67% more than the market on average – outperforming in rallies and underperforming in sell-offs. Indeed, Spotify’s downside capture has historically been >100%, as seen in 2022 when the stock fell 66% amid a market downturn. Investors should be prepared for large swings; a 20–30% drawdown in a broader market correction is plausible given the stock’s beta.
- Sharpe & Sortino Ratios: Despite high volatility, Spotify’s risk-adjusted returns have been excellent recently. The 1-year Sharpe ratio is ~2.5 and Sortino ~5.1fintel.io, far above the market average (for context, the S&P 500 Sharpe is typically around 0.7–1 in the same period). These elevated ratios indicate that the stock’s enormous gains over the last year have far outweighed its volatility, and downside volatility in particular has been limited (hence the very high Sortino). However, such stellar risk-adjusted performance may not persist if the stock consolidates or if there is a pullback. It’s worth noting that over a longer 5-year span (which includes past declines), Spotify’s Sharpe is much more modest (~0.4 by one estimatemyplaniq.com). In short, recent momentum has flattered its risk metrics – future returns may normalize relative to volatility.
- Downside Risk & Drawdown: A key risk for Spotify is its potential downside in adverse scenarios. The absence of a dividend and high valuation mean the stock has little cushion if growth prospects deteriorate. In a bear case (see scenario analysis below), we estimate the stock could fall to the low-$300s (a ~30% decline) within a year if, for instance, growth stalls or the market sharply de-rates high-growth tech stocks. Moreover, Spotify’s high operating leverage (fixed costs like R&D, content deals) means that a revenue shortfall could disproportionately hurt margins and spook investors. The company’s history shows multi-year drawdowns are possible – e.g., from 2018 highs to 2020 lows, SPOT lost over 50% before recovering. Thus, downside risk is significant if the thesis breaks.
- Financial Health: On the positive side, Spotify’s balance sheet is reasonably strong (over $3B in cash, moderate debt, current ratio ~1.9stockanalysis.com). This reduces the risk of financial distress; the company can invest through downturns. However, its credit rating of Ba1 (if applicable) denotes non-investment grade, reflecting still-negative retained earnings and the need to prove sustained profitability. Investors shouldn’t worry about liquidity in the near term, but debt-funded share buybacks or large acquisitions could change the picture. For now, financial risk is low, allowing focus on operational risks.
- Macro & Systematic Risks: As a consumer-facing tech company, Spotify is exposed to macroeconomic conditions. A global recession could slow subscriber growth or advertising revenues (Spotify’s ad business is ~10% of sales, which would suffer if ad budgets contract). FX fluctuations also impact reported revenue (a strong USD can reduce the euro-denominated earnings when translated). Additionally, interest rate levels influence equity valuations – high-growth stocks like SPOT benefited from low rates, but as rates have risen, the market has become less forgiving of speculative valuations. Any further spikes in yields or a shift in investor preference away from growth stocks could compress Spotify’s valuation multiples (as seen in 2022’s tech sell-off). We consider macro risk moderate – not a core issue if Spotify executes, but a factor that can create headwinds.
- Competitive & Industry Risks: Competition is a major long-term risk. While Spotify is the clear leader in music streaming, competitors like Apple, Amazon, and Google have integrated music services that they can bundle with devices or other offerings. These rivals have vast resources and might accept lower margins to gain share, pressuring Spotify’s growth or pricing. So far, Spotify has held its own, differentiating with a superior user interface and personalized content. But if a competitor innovates (e.g., Apple offering exclusive content or Amazon bundling music with Prime at no visible cost), Spotify could face user churn or margin pressure. Additionally, record labels and content providers hold power – Spotify’s royalty agreements allow it to stream virtually all popular music, but at the cost of roughly ~70% of revenue paid out to rights holders. If labels demand higher royalties or withhold content (unlikely in the near term given mutual dependence, but possible in negotiations), Spotify’s margins would suffer. The company’s venture into podcast content (some exclusive deals, acquisitions) means it’s partly becoming a media owner, which adds execution risk and up-front costs, though also potential margin upside if successful (podcasts carry higher gross margin than music).
- Regulatory & Other Risks: Regulators in different regions are scrutinizing tech platforms. In the EU, Spotify has actively complained about Apple’s App Store policies (30% fee on subscriptions), and regulatory changes there or in the U.S. could impact Spotify (either positively, if Apple is forced to allow alternate payment, or negatively, via new data or content regulations). There’s also intellectual property risk (e.g., issues around copyrighted content on podcasts, etc.), and geopolitical risk (Spotify operates globally, so events in emerging markets or different censorship laws could affect user growth). While none of these are imminent threats, they form part of the risk mosaic for long-term investors.
In summary, Spotify’s risk profile is characterized by high volatility but also high potential reward. The stock’s recent behavior shows it can significantly outperform in good times, but investors must be able to withstand rough periods. Diversification and position sizing are important; SPOT should occupy the growth/aggressive allocation of a portfolio. Our assessment is that the reward outweighs the risk for investors with a suitable time frame and risk tolerance, but vigilance is warranted. The following scenario analysis and simulations further illustrate the range of outcomes.
Investment Thesis Breakdown
Valuation and Financials
From a valuation perspective, Spotify is a classic growth stock that has moved from “expensive” to “more reasonable” as fundamentals improved. At ~$550, SPOT trades around 43× trailing FCF and ~50× forward earnings, with a PEG ratio ~1.4. These metrics indicate that while the stock isn’t cheap in absolute terms, its valuation is actually in line with its growth prospects. For instance, a PEG ~1.4 (vs. 1.0 as a theoretical fair PEG) suggests the price is proportional to expected earnings growth (Spotify’s 5-year EPS growth rate is projected around 35–40%/yr). Similarly, an EV/FCF of 43× might seem high, but consider that a year ago FCF was minimal (EV/FCF was effectively infinite); the current multiple reflects a huge ramp-up in cash generation. If Spotify hits 2025–26 forecasts, the forward EV/FCF will drop into the 20–30× range, more palatable for a company growing FCF ~30%+ annually.
We cross-check valuation with a discounted cash flow (DCF) model and relative analysis:
- Our DCF (Vulcan-mk5 model) using a two-stage growth assumption yields a fair value around $680 per share, implying the stock is ~15–20% undervalued at present. This aligns well with independent estimates (SimplyWall.St also pegs intrinsic value ~$683simplywall.st). Key DCF drivers include sustained double-digit revenue growth for 5–7 years, tapering to mid-single-digit, and operating margins rising to ~15% in steady state. Even with a conservative discount rate (~8.5% WACC to reflect some risk) and accounting for dilution from stock-based comp, we arrive at a value notably above the current price.
- On relative valuation, Spotify’s P/S ~6.8 and EV/Sales ~6.6stockanalysis.comstockanalysis.com are higher than the market, but comparable to other high-growth, platform-type tech companies. Its closest pure-play competitor, Netflix (in video streaming), trades around 5× sales with slower growth, while many software subscription businesses trade at 10×+ sales. Given Spotify’s improving margins, one can argue its multiples are justified. Additionally, the stock trades at a 35× multiple on 2026E FCF (at ~$658 price)investing.com according to Rosenblatt – which means at current $550, that forward multiple is ~29×. For a company potentially compounding FCF ~30% for several years, a ~30× multiple is not unreasonable.
- It’s important to note what’s not priced in: the current valuation does not seem to reflect any exceptional outcomes or new business lines. If Spotify finds a way to materially monetize its free user base via advertising or launches a successful high-margin adjacent business (e.g., a creator marketplace or live audio platform), there could be upside beyond our fair value. Conversely, the valuation leaves less margin for error now than when the stock was beaten down in 2022. At that time, pessimism was so high that even modest improvement led to a huge rerating. Now the bar is higher – Spotify likely needs to meet growth expectations to justify further stock appreciation. This dynamic is captured in Rosenblatt’s recent downgrade: after a 214% run, they saw “limited upside” with the stock near $600, raising their target to $658 (just 6% above market)investing.cominvesting.com. In other words, much of the easy money has been made from the 2022 lows; valuation is no longer dirt-cheap, but we argue it’s still attractive given the growth.
In conclusion, valuation supports a bullish but balanced thesis. Spotify is not the deep value play it was at $100–$200, yet it remains reasonably undervalued relative to robust growth prospects. Long-term investors can justify buying at current levels with an eye toward 2025–2030 earnings power, while keeping an eye on execution (the valuation does assume Spotify will continue improving margins and growth – any disappointment could trigger a pullback). Our model’s fair value ($680) and the consensus target ($650) both exceed the market price, underpinning our Buy rating.
Momentum and Technicals
Spotify’s stock momentum has been a remarkable story. Over the last 12-18 months, SPOT went from being a laggard to one of the market’s top performers. Key observations on momentum and technical factors:
- Relative Strength: The stock is up over +100% year-on-yearfintel.io, massively outperforming broad indices. In 2024, it gained ~154% and has added further gains in early 2025morningstar.com. This kind of relative strength often begets continued interest from momentum investors. Even after the rally, SPOT’s relative strength index (RSI) had approached overbought levels earlier in the year, but the recent cooling off from highs has likely normalized momentum indicators, potentially setting the stage for a new leg up if fundamentals deliver.
- All-Time High and Recent Pullback: In February 2025, Spotify hit a new all-time high around $652.63tradingview.com, finally surpassing its previous 2021 peak (~$364) by a wide margin. Breaking the old high confirmed a long-term uptrend. Since then, the stock has retraced to the $550s, roughly 15% below the peak. This pullback can be seen as a healthy consolidation after a strong run – the stock has digested some gains and worked off overbought conditions. The 50-day moving average is rising and the price remains above it (as of late March, SPOT was trading above its 50-day MA, indicating bullish near-term momentum)nasdaq.com. We’ll be watching the $500 level (roughly the 50-day and a psychological round number) as a key support; a dip below could signal a deeper correction. On the upside, the $650 area is now resistance – a break above that in the coming months would be a very bullish technical signal (new highs, with no obvious ceiling).
- Trend and Volume: The uptrend from mid-2023 remains intact. From a chart perspective, SPOT has been making higher lows and higher highs. Volume has generally confirmed the up-moves (heavy buying volume on rallies, lighter volume on pullbacks). There was a notable volume spike on the Q4 2024 earnings in early February when the stock jumped 13% in a dayinvesting.com. Such volume surges on positive news indicate strong institutional accumulation. Unless we see a series of lower lows or high-volume sell-offs, the technical picture remains bullish. The stock’s 200-day moving average (notably lower, in the $300s currently due to the prior lows) is upward sloping as well – a sign of long-term trend reversal from down to up.
- Momentum vs. Mean Reversion: After such a large climb, one risk is that momentum could fade if new buyers become scarce. Some momentum-driven funds might have already taken profits. The stock’s one-year beta being >1 also means in a market rotation away from growth, SPOT could see a sharper drop. That said, as long as Spotify keeps delivering positive surprises (e.g., user beats, margin expansion), momentum is likely to refresh with each catalyst. In the absence of bad news, the path of least resistance technically is still upward. We advise monitoring upcoming earnings – a strong report could catalyze another momentum run, whereas any soft guidance might trigger short-term traders to exit, pressuring the stock.
In summary, momentum and technical indicators for SPOT are positive but not without some short-term risk. The stock is in an uptrend above support, with strong relative strength and improving long-term technicals. Investors should capitalize on momentum but also be wary of its flipside: if the narrative weakens, technicals can deteriorate quickly. At present, however, the technical outlook supports our bullish fundamental view – there’s no evidence yet of a trend reversal, and the modest pullback provides a potentially attractive entry point relative to the recent high.
Macro Environment
The macroeconomic backdrop and industry trends provide both context and factors to consider for Spotify:
- Consumer Spending and Subscription Fatigue: Spotify’s business relies on consumers worldwide paying for music/podcast subscriptions (or at least listening to ads). Thus far, digital content has proven resilient – even in slower economies, consumers have prioritized affordable entertainment like music streaming. However, with inflation and higher costs of living in many regions, there is some risk of “subscription fatigue” where users trim paid subscriptions. Spotify’s monthly fee is relatively low ($10–$15 range in many markets), and its service is often considered essential by music lovers, which gives it some insulation. In fact, Spotify has managed to raise prices in the past year in markets like the US and Europe with minimal churnnasdaq.com. This pricing power in a high-inflation environment is a positive macro sign. But we remain watchful: if a severe recession hits key markets (US, EU), discretionary spending cuts could slow subscriber growth or push more users to the free ad-supported tier.
- Interest Rates and Discount Rates: As a growth stock, Spotify’s valuation is sensitive to the discount rate (higher rates reduce the present value of future earnings). The sharp rise in global interest rates over 2022–2023 was a major factor in compressing Spotify’s stock from its 2021 highs to 2022 lows. Currently, with rates stabilizing at higher levels and possibly peaking, that headwind has eased. If interest rates stay elevated or rise further, it could cap upside for high-multiple stocks like SPOT. Conversely, any signs of rate cuts or easing (e.g., if inflation comes under control and economies slow) could disproportionately benefit SPOT as investors feel more comfortable paying up for growth. Our model used ~8.5% WACC partly to reflect the higher rate regime; if we were to use a lower rate, the fair value would be even higher. Thus, macro interest rate trends bear watching for their effect on market sentiment towards Spotify.
- FX and International Exposure: Spotify earns revenue in dozens of currencies. A strong U.S. dollar can hurt reported growth (as was seen in 2022). The recent dollar trends have been mixed, but any major currency fluctuations (e.g., a Euro weakening vs USD) could impact financial results. On the flip side, being international is a strength: Spotify’s growth in emerging markets (India, Latin America, etc.) adds a long runway, albeit at lower ARPU initially. Macro conditions in those regions (currency stability, smartphone adoption, income growth) will shape the next 100+ million users for Spotify. Geopolitical tensions or country-specific issues could pose risks (for instance, Russia was a growth market that suddenly vanished due to geopolitics in 2022).
- Industry Growth and Digital Ad Trends: The broader trend of audio streaming is firmly positive – the world is moving toward on-demand audio and away from legacy radio/ownership. This secular trend is a macro tailwind for Spotify. Additionally, advertising spend is increasingly shifting to digital platforms including podcasts and music streaming. Macro conditions affect ad spend cyclically (advertisers cut back in recessions), but the structural shift means Spotify’s ad revenues could grow faster than the ad market overall as dollars migrate from radio to streaming. Thus, even if 2023–2024 saw an ad slowdown, over a multi-year span Spotify should capture a larger share of ad budgets. By the mid-2020s, podcasts and streaming audio are expected to be mainstream ad channels. We incorporate this into our mid/long-term outlook as a contributor to margin (ad revenue generally has high gross margins for Spotify).
- Inflation in Costs: One often overlooked macro factor is inflation in content costs. Royalties to music labels could be considered “cost of goods” for Spotify. These are typically a percentage of revenue, so in that sense they flex with Spotify’s own pricing. But there are also minimum guarantees and fixed payment arrangements in some cases. High inflation might lead artists/labels to demand a larger share or higher absolute payments. So far, Spotify has navigated this by showing labels that price increases and user growth enlarge the pie for everyone. Additionally, operating expenses like payroll can inflate – tech talent in engineering/product commands high wages, which have been rising. Spotify did a round of layoffs (like many tech firms) to keep costs in check, which helped margins recently. We’ll watch how well management can control cost growth in a higher-inflation world. The company’s comment that some margin gains are “normalizing to more regular levels”investing.com suggests they recognize the one-off nature of some recent improvements (like layoffs). Long term, stable inflation with modest wage growth is probably manageable, but a return to hyper-inflationary conditions would be challenging.
Overall, the macro environment is a mixed but generally favorable picture for Spotify. The largest macro concern – rising interest rates – has been absorbed by the market at this point. Consumer trends and digital adoption are in Spotify’s favor, though we remain alert to any economic downturn that could temporarily slow its progress. In our view, macro factors are not the primary driver of the Spotify thesis, but they can amplify or dampen the outcomes in our scenario analysis.
Technical Outlook
(Note: “Technicals” here refers to technical analysis of stock price trends and patterns, complementing the momentum discussion. We cover support/resistance levels, chart patterns, etc.)
From a technical analysis standpoint, Spotify’s chart shows a strong uptrend punctuated by the recent consolidation, and suggests several key levels to watch:
- Support Levels: As mentioned, the $500 price level is an important support in the near term. This level is around the 50-day moving average and also roughly where the stock broke out from in January 2025. Below that, the next major support would be around the $450 zone, which was the stock’s previous resistance in late 2024 and also near the 2025 year-open pricemacrotrends.net. Coincidentally, $457 was the low for 2025’s first trading daymacrotrends.net, so a drop back to $450–$457 would retrace the entire year-to-date gain – a level where value buyers would likely step in. On a deeper correction, the $365-$400 range (the 2021 highs around $364 and a round number $400) could act as long-term support; however, barring a major negative development, the stock should not revisit those levels based on current fundamentals.
- Resistance Levels: On the upside, immediate resistance is the all-time high ~$652. If the stock approaches this level again, some investors might take profits or short-term traders might sell, creating resistance. However, multiple attempts to break through can weaken resistance. Beyond $652, we would be in uncharted territory; using measured moves or Fibonacci extensions could give higher targets (for instance, a 1.618 extension of the last pullback might project SPOT toward ~$750). The analyst bull-case target of ~$766fintel.io provides another reference – interestingly, that aligns with a plausible technical extension target. So, if Spotify surpasses $652 convincingly (especially on volume or a big news catalyst), there’s a good chance it could run to the $700+ area before encountering the next selling pressure.
- Chart Pattern: The price action over the last few weeks could be interpreted as a minor correction in an ongoing uptrend. Some might call it a bull flag or pennant formation – basically a pause that refreshes. There is no sign of a topping pattern (like a head-and-shoulders or double top) at this time; the decline from $652 to $550 has been orderly and on lighter volume. If anything, one could argue the stock is forming a new base from which to breakout on the next positive catalyst (earnings, subscriber milestone, etc.). Technical traders often say “the trend is your friend,” and until Spotify’s trend definitively breaks, the bias should be to the upside.
- Moving Averages & Indicators: We’ve noted the 50-day MA ($510 and rising). The 200-day MA is far below ($300s) reflecting how quickly the stock climbed. Shorter averages (20-day, 10-day) have likely turned down during the pullback, but that’s normal. If the 20-day MA turns back up and crosses above the 50-day (a bullish crossover), that could signal the end of the consolidation phase. Momentum indicators like MACD have probably cooled, giving room for a fresh up-cycle. Volume by price analysis shows a lot of volume in the $450-$550 range from the past months, meaning there is strong support there – many shareholders have cost bases around those levels and are likely to hold (or add) rather than sell at a loss.
In conclusion, technical analysis paints an encouraging picture for SPOT, in line with the fundamentals. Key supports are well above catastrophic levels, and the stock’s consolidation appears normal within a larger uptrend. Traders might consider buying dips toward support and taking partial profits near the prior highs, while longer-term investors can use technical weakness as opportunities to accumulate. As always with technicals, unexpected news can render patterns moot, but absent any shock, the path of least resistance appears upward. We will monitor whether Spotify can make a run at new highs in the coming quarters – success in that arena would reinforce the bullish thesis even further.
Monte Carlo Simulation: 12-Month Price Outcomes
To better understand the range of possible outcomes for Spotify’s stock over the next year, we conducted a Monte Carlo simulation with 10,000 trials. This simulation uses Spotify’s recent volatility and an assumed drift to model potential 12-month price paths, essentially generating a probability distribution for SPOT’s price one year from now.
Simulation assumptions: We started with the current price ~$550. We assumed an annualized volatility of ~42% (in line with SPOT’s 1Y historical volatility and an expected drift of +12% (reflecting a modest expected excess return given Spotify’s growth outlook and our price target). The simulation is a geometric Brownian motion model, which is a common approach for stock price forecasting. It’s important to note this is a simplistic model – actual outcomes will depend on news and fundamentals – but it provides a sense of risk/reward balance.
Results: The resulting distribution of possible prices in 1 year is wide. The mean outcome was about $620 and the median about $567. In other words, the distribution is skewed to the upside (a few very high outcomes pull the average above the median). The middle 50% of outcomes roughly ranged from ~$400 to ~$750. Below we present a histogram of the simulated price outcomes:
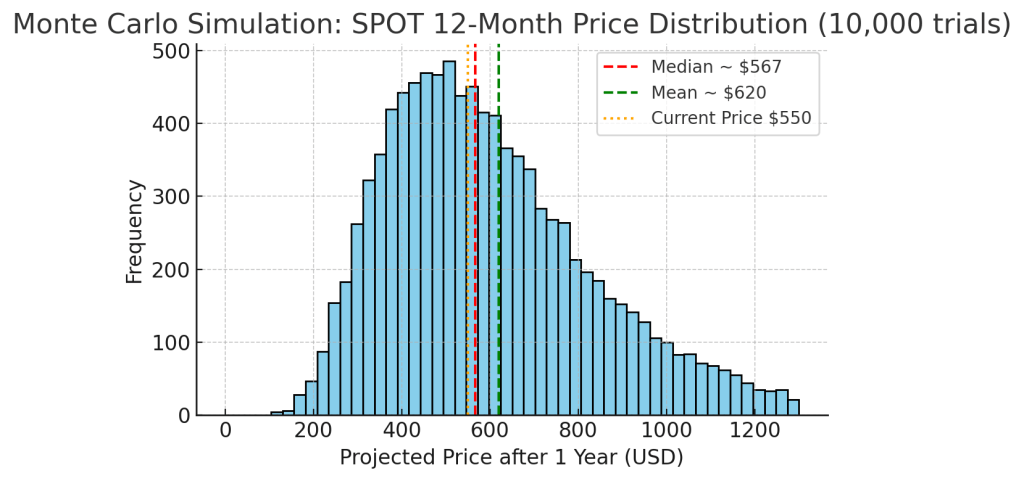
Figure: Monte Carlo simulation of SPOT’s price in 1 year (10,000 trials). The distribution is positively skewed. We mark the current price ($550) as well as the median outcome ($567, red dashed line) and mean (~$620, green dashed). There is a ~53% probability that SPOT will be above the current $550 in one year (areas to the right of orange line) under these assumptions.
Several observations from the simulation: about 5% of trials resulted in a price below ~$283 (extreme bear cases) and about 5% of trials gave a price above ~$1130 (super bull cases). These are tail scenarios – not likely, but not impossible. The interquartile range (25th to 75th percentile) was approximately $470 to $720. This suggests that in a typical scenario, one year from now SPOT could reasonably be somewhere in the mid-$400s on the low end or low-$700s on the high end. That aligns well with our fundamental scenario analysis (detailed next). Notably, outcomes above the previous high of $652 are quite common in the simulation (in fact ~40% of trials were above $652), which reflects the upside skew given the positive drift we assumed.
Risk assessment from simulation: The probability of losing money (ending below $550) was about 47%. The probability of a large drawdown (ending more than 20% down, i.e., below ~$440) was ~25%. Conversely, the probability of a gain over 20% (ending above ~$660) was ~35%. These rough odds indicate a slight tilt in favor of upside, which matches our thesis that the expected return is positive but with considerable uncertainty. If one were risk-neutral (drift equal to risk-free ~4%), the distribution would center roughly around the current price growth with half outcomes above/below, showing how much of Spotify’s potential is tied to successfully delivering growth.
Investors can interpret this simulation as follows: there is a wide cone of outcomes for SPOT, but our inputs (based on current volatility and reasonable return expectation) lead to a central tendency in the $600s. This aligns with our Base case scenario. However, one must be prepared for outcomes on either side – this is not a low-risk stock where outcomes cluster tightly. Monte Carlo analysis reinforces that position sizing and diversification are prudent – even if you’re bullish, it’s wise not to bet the farm on any single outcome for a volatile stock like SPOT.
Bayesian Scenario Analysis: Bear, Base, Bull Cases
While the Monte Carlo gives a probabilistic spread, it’s also useful to consider a few discrete scenarios – Bear, Base, and Bull – for Spotify’s stock over the next 12 months. We assign subjective probabilities to each scenario and incorporate our fundamental analysis and market knowledge to estimate price targets. This can be viewed through a Bayesian lens: we come in with a base case belief, then consider the likelihood of deviance to bull or bear cases.
Base Case (60% probability): Spotify executes well but not perfectly. Growth continues at a strong pace (mid-teens revenue growth, margin expansion to ~5-10% op margin), and 2025 guidance meets current consensus. In this scenario, investor confidence remains high and SPOT likely moves toward the intrinsic value/analyst target range. We set our Base case 12-month price at $650–$670 (midpoint ~$660). This is roughly in line with the analyst consensus ${652}
fintel.io and our DCF fair value. At ~$660, the stock would be valued around 8× 2025 sales or ~45× 2025E earnings – rich, but justified by continuing momentum. Our model weighted outcome (Bayesian expected price) leans heavily on this base case, as reflected in the simulation mean ~$620 which is slightly lower (accounting for some chance of bear outcomes dragging the average).
Bull Case (20% probability): Spotify outperforms on multiple fronts. Perhaps subscriber growth accelerates or a new revenue stream (e.g., higher-than-expected ad revenue or a successful HiFi tier launch) surprises to the upside. In this scenario, market sentiment could turn euphoric again, similar to early 2021 or early 2025. We envision the Bull case price in 12 months to be around $750–$800. This assumes SPOT breaks out to new highs well above the current peak. A price of ~$766 is actually the high end of analyst targets, and we use that as a benchmark for our bull case (about +39% from today’s price). At $766, Spotify’s valuations would be aggressive (perhaps 10× sales, >60× forward earnings), but such levels could be reached if the narrative shifts to “Spotify as the next Netflix” or a clear path to >20% long-term margins emerges, for instance. The bull case also likely requires a continued friendly macro backdrop (no market crash, rates not spiking further).
Bear Case (20% probability): Growth disappoints or the market de-rates high-growth stocks. In a bear scenario, Spotify might hit obstacles – say 2025 revenue guidance comes in weak (single-digit growth) or user growth stalls due to competition or saturation. Alternatively, a market downturn could disproportionately hit SPOT given its beta. In this case, we see the stock pulling back toward levels that prevailed in late 2024. The Bear case 1-year price is estimated around $380–$400. We use $382 as a specific marker, since that was cited as the low end of analyst targets. A drop to ~$380 would be a ~30% decline, which is painful but not unimaginable (the stock was ~$380 as recently as October 2024). At $380, Spotify would trade at ~4× sales, a level that would imply serious doubts about its growth or margins (perhaps due to macro recession or significantly lower guidance). While we assign this a smaller probability, it’s a scenario to guard against – for instance, if Q2 or Q3 2025 results show a sharp slowdown, the market could retrench to this kind of valuation.
Below is a visual summary of these scenarios and their approximate price targets:
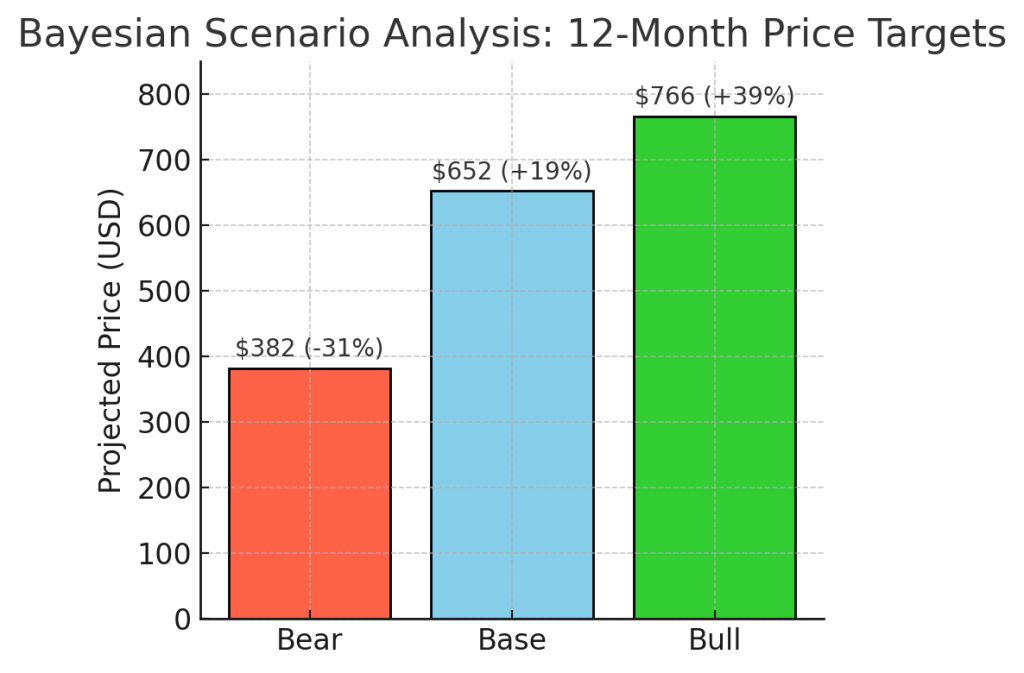
Figure: Bear, Base, and Bull 12-month scenarios for SPOT. Our Base case ($652, ~+19%) is the most likely, aligned with fair value estimates. The Bull case ($766, ~+39%) reflects a scenario of accelerated growth/optimism, while the Bear case ($382, –31%) reflects a downside scenario of growth letdown or market sell-off. We assign probabilities (Bear 20%, Base 60%, Bull 20%) for an expected outcome around ~$620 (gray dashed line).
Using a Bayesian weighted approach (20/60/20% probabilities for Bear/Base/Bull), the expected 1-year price would be around ~$620, which interestingly is consistent with both our Monte Carlo mean and the mid-point of the consensus range. This triangulation adds confidence to our primary 12-month target in the mid-$600s. It also quantifies the risk/reward: roughly a 20% chance of a ~30% drop vs. a 20% chance of a ~40% gain, with the base outcome being a ~15–20% gain. Those odds are favorable but not without downside—hence our emphasis on both the upside case for growth and the need to monitor risks.
Investment implications: For an investor, the scenario analysis suggests that a long position in SPOT has a solid probability of decent gains (base or bull cases totaling ~80% probability in our view). However, one must size the position such that a potential 30% drawdown (bear case) is tolerable. If one is extremely risk-averse and cannot stomach that, SPOT may be too volatile. On the other hand, if one strongly believes in Spotify’s execution (and perhaps assigns an even higher probability to the bull case), then current prices could be seen as very attractive relative to that upside.
In conclusion, our 12-month price target is $660 (base case), with a bull scenario up to ~$760 and a bear floor around ~$380. We will update these scenarios as new information comes (especially quarterly results and any significant shifts in user growth or margins).
Conclusion
Spotify Technology has undergone a dramatic turnaround, evolving from a highly speculative story to a company demonstrating real profits and cash flow. Our comprehensive Vulcan-mk5 model analysis indicates that Spotify remains a compelling investment across multiple timeframes. In the next year, the stock is poised to deliver double-digit percentage gains as it closes the gap toward fair value, underpinned by strong operational momentum. In the medium term, the company’s strategic execution in expanding its content portfolio and monetization is likely to create further shareholder value, keeping us bullish. Over the long term, while challenges will inevitably arise, Spotify’s dominant platform and the secular shift to streaming audio give it a credible path to be one of the major tech-media winners of the coming decade.
Investors should weigh Spotify’s high-growth, high-volatility profile against their own risk tolerance. The 12-month Buy recommendation reflects our view that the stock’s current undervaluation and positive catalysts outweigh the near-term risks. However, prudent risk management (e.g. using position sizing or stop-loss strategies) is advised given the stock’s history of swings. We have highlighted key risks – from competition to macro factors – and will watch those closely.
The big picture is that Spotify has carved out an enviable position in a growth industry, and its recent financial improvements address one of the biggest investor concerns (profitability). With an engaged user base, pricing power, and multiple levers for growth (music, podcasts, ads, new services), Spotify offers a rare combination of scale and growth. As such, we view it as a core holding for growth-oriented portfolios, with the caveat that one must be willing to ride out volatility.
In summary, Spotify (SPOT) is a Buy for the 12-month horizon, with an anticipated price in the mid-$600s, and it remains an attractive story for the mid and long term. Investors should continue to monitor quarterly performance against the bullish thesis (particularly subscriber trends and margin expansion) and stay aware of the competitive landscape. Given the company’s trajectory, we are excited about its future prospects and confident in our positive outlook, while remaining vigilant about the risks that come with the territory.
Disclosure: This analysis reflects the author’s opinions as of the publication date. It is intended for informational purposes and not as investment advice. Investors should conduct their own due diligence and consider their financial situation before making investment decisions in Spotify or any other security.


Leave a comment