Introduction and Overview
This analysis takes a fictional typical high-income investor considering replacing the bond portion of their portfolio with the Simplify Managed Futures Strategy ETF (CTA). The goal is to reduce overall portfolio risk, but performance and tax efficiency are key concerns. In 2022, both stocks and bonds fell sharply (the 60/40 portfolio’s worst year since 2008), while managed futures strategies delivered strong gains (A Hedge You Get Paid to Own | Simplify) (A Hedge You Get Paid to Own | Simplify). This analysis will compare CTA to traditional bond ETFs – such as short-term Treasury funds (e.g. BIL, SHY), intermediate Treasuries (IEF), and total bond market funds (AGG or BND) – across several dimensions: tax treatment, strategy and portfolio role, historical/crisis performance, and the 2025 outlook. Finally, we provide a recommendation on whether CTA is a viable or superior bond substitute for a long-term, taxable investor seeking diversification without undue tax drag.
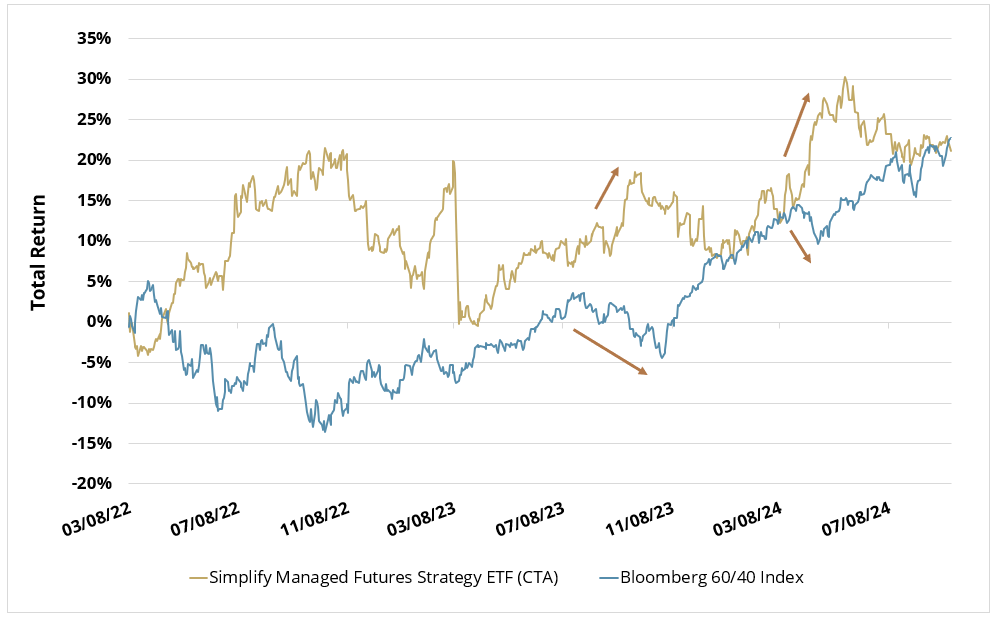
(A Hedge You Get Paid to Own | Simplify) Chart: Total return of Simplify CTA (managed futures ETF, gold line) vs a 60/40 stock/bond index (blue line) from Mar 2022–Sep 2024. CTA produced positive returns during periods when the traditional 60/40 portfolio suffered losses (e.g. 2022), highlighting its diversifying, “crisis alpha” potential. Conversely, in stable or bullish markets, CTA kept pace with (and sometimes outperformed) the 60/40 portfolio (A Hedge You Get Paid to Own | Simplify) (A Hedge You Get Paid to Own | Simplify).
Tax Treatment Comparison: CTA vs. Bond ETFs
Account Tax Context: In a taxable brokerage account, both managed futures and bond ETFs can incur significant annual tax “drag” for a top-bracket investor. Below we compare how CTA and traditional bond funds are taxed, focusing on distribution characteristics, applicable tax rates, and implications for a Florida-based high earner:
- Income Type – Interest vs. Futures Gains: Bond ETFs primarily distribute interest income from coupons (for Treasury funds, this interest is federal-taxable but state tax-exempt). In contrast, CTA’s returns come from futures trading gains and interest on collateral (mostly short-term T-Bills) (CTA-Fact-Sheet-4Q24) (CTA-Fact-Sheet-4Q24). CTA is structured as a 1940-Act ETF with no K-1 (uses a Cayman subsidiary to trade futures) (CTA-Fact-Sheet-4Q24), so its gains are passed through via annual fund distributions.
- Ordinary Income Taxation: Distributions from both CTA and bond ETFs are generally taxed at ordinary income rates (up to 37% federally for top bracket) rather than the lower long-term capital gains rate, since neither produces “qualified” dividends (Submission Proof – D:\Users\Empire-MB-2\OneDrive – empirefilings.com\Production\e142823\e142823.gfp). Bond fund payouts are 100% interest (non-qualified). CTA’s year-end distributions typically represent accumulated futures profits and T-Bill interest – these are taxed as ordinary income in the hands of the investor (despite futures normally qualifying for 60/40 capital gains treatment, the ETF structure means gains are not passed through as Section 1256 contracts to the investor) (Submission Proof – D:\Users\Empire-MB-2\OneDrive – empirefilings.com\Production\e142823\e142823.gfp) (Exploring Bond Tax Efficiency: Futures or Bond ETFs? –). In other words, the tax advantage of futures (60% long-term capital gains) is largely lost in CTA’s ETF format, and instead shareholders are taxed similarly to receiving short-term gains or interest.
- Qualified Dividend Status: Neither CTA nor bond ETFs pay qualified dividends. Bond interest is fully taxable as ordinary income, and CTA’s distributions (being derived from derivatives and interest) do not qualify for the 15–20% dividend tax rate. Thus, both are tax-inefficient relative to equity ETFs that pay qualified dividends or can defer gains.
- Annual Tax Drag: Both investments can create a significant yearly tax burden for a top-bracket investor. For example, Simplify CTA had an indicated distribution rate of about 10.6% of NAV in 2024 (CTA Simplify Managed Futures Strategy ETF | Simplify) (CTA Simplify Managed Futures Strategy ETF | Simplify) (reflecting strong gains and T-Bill income). A high earner would owe roughly 37% federal tax on that distribution – an annual drag of ~3.9% of NAV lost to taxes (not counting the 3.8% NIIT). By comparison, a Treasury bond fund yielding ~4–5% would incur ~37% tax on the interest, an annual drag of ~1.5–1.85% (yield * tax rate). In both cases, a substantial portion of the gross return is eaten by taxes each year, but CTA’s higher returns (when realized annually) mean potentially larger absolute tax bills. Importantly, bond ETFs allow some tax deferral of price appreciation – NAV changes aren’t taxed until you sell shares – whereas CTA’s strategy realizes P/L each year (mark-to-market of futures) and distributes it (Exploring Bond Tax Efficiency: Futures or Bond ETFs? –). Bond index ETFs rarely distribute capital gains (they can use in-kind redemptions), so investors only pay tax on the interest each year and on any capital gain upon sale (long-term if held >1 year). With CTA, virtually all returns each year are taxed currently (no deferral benefit).
- State Tax: In states with income tax, U.S. Treasury interest is exempt at the state level, giving Treasury-focused bond funds an edge. Futures gains, however, are fully taxable by states. In Florida this is moot (no state income tax on either) (), but in a high-tax state, Treasury bond ETFs can avoid 5–10% in state taxes on interest, whereas CTA’s distributed gains would be subject to state tax. (Florida’s lack of state tax eliminates this particular advantage of Treasuries for the investor in question.)
- K-1 vs 1099: CTA does not issue a K-1 (unlike some commodity pools); it provides a 1099-DIV like a stock or bond ETF (CTA-Fact-Sheet-4Q24). This simplifies tax filing (no partnership K-1s arriving late). Bond ETFs also issue 1099s. So from a filing standpoint both are straightforward. The key difference is simply the character of income on the 1099 (ordinary income in both cases, with possibly some portion of CTA’s distribution classified as capital gains – though in practice CTA’s 2022–2024 distributions have been mostly ordinary income). The fund’s prospectus confirms that “distributions generally will be taxable as ordinary income or long-term capital gains” (Submission Proof – D:\Users\Empire-MB-2\OneDrive – empirefilings.com\Production\e142823\e142823.gfp). In 2023, for instance, CTA’s after-tax returns were significantly lower than pre-tax due to taxation of its distributions (Submission Proof – D:\Users\Empire-MB-2\OneDrive – empirefilings.com\Production\e142823\e142823.gfp).
To summarize, CTA is about as tax-inefficient as a bond fund for a high-bracket investor – and possibly more so in years of strong performance – since both produce non-qualified taxable income annually. A 2024 study found that the presumed tax advantage of futures (60/40 split) can be offset by frequent taxable events and tax on the cash collateral, meaning a bond ETF often ends up more tax-efficient than a futures-based strategy under realistic assumptions (Exploring Bond Tax Efficiency: Futures or Bond ETFs? –). In short, neither CTA nor traditional bonds are ideal in taxable accounts from a tax perspective. Whenever possible, a high-income investor would typically prefer to hold such assets in tax-deferred accounts or use tax-exempt bonds (munis) for income. But given the scenario constraints (taxable account holdings), we must accept the tax drag and compare CTA vs bonds on other factors like strategy and performance. The table below summarizes the tax treatment differences:
| Tax Factor | CTA (Managed Futures ETF) | Traditional Bond ETF (Treasury or Total Bond) |
|---|---|---|
| Income/Distribution Type | Futures P/L + T-Bill interest. Systematic trading gains on futures (via a Cayman sub) and interest from collateral (e.g. 3–6mo Treasury bills). | Bond interest. Coupon interest from bonds (Treasuries, MBS, corporates, etc. in the index). |
| Taxation of Distributions | Ordinary Income. Taxed at regular income rates (37% top federal), as short-term gains or other income (Submission Proof – D:\Users\Empire-MB-2\OneDrive – empirefilings.com\Production\e142823\e142823.gfp). A portion may sometimes be designated long-term capital gains, but majority of CTA’s payout is effectively taxed at ordinary rates. | Ordinary Income. Interest payments are taxable at up to 37% federal. (Treasury interest is exempt from state tax, but still fully taxable federally.) (Submission Proof – D:\Users\Empire-MB-2\OneDrive – empirefilings.com\Production\e142823\e142823.gfp) |
| Qualified Dividend? | No. Not qualified – distributions are from derivatives and interest (non-qualified). | No. Bond interest does not qualify for dividend tax rates. |
| Annual Tax Drag | High (depends on performance). E.g. ~10% NAV distribution taxed at 37% → ~3.7% NAV lost to tax. Little ability to defer gains year-to-year (futures marked to market). | High (depends on yield). E.g. 4% yield taxed at 37% → 1.5% NAV drag. Price appreciation can be deferred until sale (ETF rarely distributes cap gains), reducing interim tax drag (Exploring Bond Tax Efficiency: Futures or Bond ETFs? –). |
| Deferral of Gains | None/Minimal. Fund realizes gains annually by design and must distribute to avoid fund-level tax. Investors cannot defer these yearly gains (other than by tax-loss harvesting if value drops). | Partial. Only interest is taxed yearly; any price gains accrue untaxed until you sell shares. Long-term Treasury ETFs often distribute $0 in capital gains, allowing deferral of price return. |
| State Tax | Fully taxable by states (if applicable) on both interest and trading gains. (FL has no state tax (), so no issue for this investor.) | Treasury interest state-tax free. In states with income tax, interest from Treasuries is exempt, lowering effective tax. (Corporate bond interest is taxable by states.) In FL, no state tax, so neutral. |
| Tax Reporting | Form 1099 (no K-1). Simplify CTA avoids K-1s (CTA-Fact-Sheet-4Q24); all income reported on 1099-DIV (ordinary income and any cap gain distribution). | Form 1099. Interest reported as ordinary dividends on 1099 (and any small cap gain distributions, which are rare). No K-1 for typical bond index ETFs. |
Bottom Line (Tax Perspective): For a top-bracket investor, both CTA and bond ETFs will generate annual taxable income taxed at the highest rate. Neither is “tax efficient” in the way equity index ETFs are. The CTA ETF does not escape the tax drag despite the futures strategy – in fact, CTA realized gains each year can make it tax-inefficient (one Reddit analysis bluntly noted that funds like DBMF, KMLM, CTA “are extremely tax inefficient” in taxable accounts due to the 100% allocation to taxable T-Bill collateral and lack of deferral) (Managed Futures ETF Info : r/LETFs – Reddit). In a taxable account, one should expect to lose roughly 37-40% of the yield/return from either CTA or bonds to taxes each year (ignoring any timing differences). Thus, the decision to use CTA as a bond substitute must rest on risk, return, and diversification characteristics, not on tax advantages. Any allocation to CTA for risk mitigation should ideally be weighed in after-tax terms (e.g. comparing after-tax returns of CTA vs bonds). Next, we examine how CTA’s strategy works and how its risk/return profile compares to bonds.
Strategy Deep Dive: How Does Simplify’s CTA Work?
Managed Futures 101: “Managed futures” (CTA strategies) are quantitatively driven investment programs that go long or short futures contracts across various asset classes based on systematic signals (often trend-following). The goal is to produce absolute returns with low correlation to traditional assets, and particularly to provide positive returns in risk-off or crisis periods as a form of insurance or hedge (CTA Simplify Managed Futures Strategy ETF | Simplify). Simplify’s CTA ETF is designed exactly with this purpose: to be a diversifier that can profit during equity market drawdowns while still delivering positive returns over the long run (CTA Simplify Managed Futures Strategy ETF | Simplify). Unlike a static allocation (like bonds), a managed futures fund dynamically adjusts positions in response to market trends and other indicators.
Underlying Approach: Simplify’s CTA is sub-advised by Altis Partners, a Commodity Trading Advisor with 20+ years experience (CTA Simplify Managed Futures Strategy ETF | Simplify). The fund systematically trades futures in a diversified set of markets – focusing on commodities and interest rates in North America (U.S. and Canadian futures markets) (CTA-Fact-Sheet-4Q24). Notably, the strategy intentionally excludes equity index futures (CTA-Fact-Sheet-4Q24) to maintain low correlation to equities; this is important because many CTA funds do trade stock indices, but Simplify’s CTA chooses not to, ensuring it’s truly an “alternative” when stocks fall. Instead, CTA’s universe includes: energy and metal commodities, agricultural commodities, livestock, and financial futures on bonds/rates (e.g. Treasury bond futures). It may also include currency futures or cross rates if they fall under “financial” futures, though the fact sheet emphasizes commodities and rates.
Four Systematic Models: What sets CTA apart is that it isn’t a single trend-following model – it combines four distinct models to drive its positions (CTA-Fact-Sheet-4Q24): (1) Price Trend – a classic trend-following algorithm that goes long rising markets and short falling markets; (2) Mean Reversion – a contrarian model that looks for overbought/oversold conditions and bets on prices snapping back to normal (complementing trend by taking advantage of range-bound behavior); (3) Carry – a model that seeks to capture futures “carry” or roll yield (for example, going long markets with backwardation or short those with contango, aiming to earn the embedded yield/discount); and (4) Risk-Off – a specialized strategy that activates during market stress, aiming to profit in tail-risk scenarios or rapid flights-to-safety. The inclusion of non-trend components (mean reversion and carry) is notable – it diversifies the strategy internally. Many managed futures funds rely purely on momentum, which can suffer in choppy markets; CTA’s additional models may help navigate trendless periods or quick reversals. According to Simplify, this multi-model approach is intended to generate absolute returns in varied environments, not just trending markets (CTA-Fact-Sheet-4Q24). It’s effectively four sub-strategies in one ETF (CTA-Fact-Sheet-4Q24).
Portfolio Construction and Instruments: CTA’s portfolio is constructed by allocating to futures contracts across those models and asset classes. Because it trades futures, the fund holds most of its $ as collateral in short-term Treasuries (T-Bills) and posts margin for the futures positions. For example, as of end 2024, CTA’s top holdings were ~80% in U.S. Treasury Bills of various maturities (used as collateral/margin), and the rest in futures positions (e.g. live cattle and feeder cattle contracts were among the largest individual futures positions at that time) (CTA-Fact-Sheet-4Q24) (CTA-Fact-Sheet-4Q24). The fund can go long or short each futures market depending on the model signals. The overall gross notional exposure can exceed 100% of NAV – in other words, CTA uses leverage inherent in futures. However, the risk is managed by the models and position sizing. Typically, managed futures funds target volatility in the high single digits or low teens. CTA’s since-inception volatility has been in that range (for instance, it had a ~10% drawdown in early 2023 when trends reversed (Submission Proof – D:\Users\Empire-MB-2\OneDrive – empirefilings.com\Production\e142823\e142823.gfp) (Submission Proof – D:\Users\Empire-MB-2\OneDrive – empirefilings.com\Production\e142823\e142823.gfp), indicating it’s not low-volatility like a bond fund, but moderate volatility comparable to maybe a 50/50 stock/bond mix).
Use of Trend-Following (Convexity): Trend-following strategies like CTA introduce convexity to a portfolio. They tend to incur small losses or modest gains in quiet markets, but during big moves (up or down) they can capture outsized gains by positioning along the trend. Simplify’s research notes that trend following offers “negative correlation when you need it,” unlike options-based hedges that bleed premium (A Hedge You Get Paid to Own | Simplify). Essentially, CTA can be thought of as a hedge that pays for itself: instead of costing an insurance premium (like put options do), it aims to produce positive carry (thanks to the collateral yield and any carry trades) and then deliver a windfall in a crisis if strong trends emerge. In today’s environment of higher cash yields, this is an important point – the T-bill collateral yield (~5% in 2024/25) provides a baseline return that can cover fund expenses (0.76% expense ratio) and then some, meaning the fund “gets paid to wait” for opportunities (A Hedge You Get Paid to Own | Simplify) (A Hedge You Get Paid to Own | Simplify). Simplify explicitly markets CTA as “A Hedge You Get Paid to Own” because its collateral yield has been so high, effectively offsetting the cost of the downside protection role.
Leverage and Risk Management: The fund’s exposure to various futures is adjusted so that no single market or sector dominates risk. Altis likely uses an allocation akin to risk-parity across sectors or model signals – e.g. allocations to commodities vs rates are balanced in terms of volatility contribution. The presence of four models means sometimes they may take offsetting positions (e.g. trend might be long a market while mean reversion is betting against a short-term move – these could partially hedge each other). This blending can smooth out the return profile. CTA does not target a fixed leverage level publicly, but we can infer from comparisons to CTA indices that its volatility is in line with industry norm (~10% annualized vol). It is not an extremely levered, high-octane strategy; it’s designed as an all-weather diversifier.
Comparing to Bonds: Traditional bond ETFs have a very different “strategy”: they passively hold a portfolio of bonds (e.g. AGG holds thousands of bonds across Treasuries, corporates, MBS to match the Aggregate index). Bonds derive return from yield (interest payments) and price change due to interest rate moves. They generally have a stable/slower-moving risk profile – e.g. an intermediate Treasury fund might fluctuate a few percent in a month at most, whereas CTA could potentially swing more if trends abruptly reverse. Bonds tend to do well in deflationary or growth scare scenarios (when yields fall, bond prices rise) but do poorly in rising-rate or inflation scenarios (as we saw in 2022). Managed futures, on the other hand, can adapt to either scenario: they could be long bonds when rates are falling (acting similar to a bond fund) or short bonds when rates are rising (profiting from bond price declines, as many CTAs did in 2022). They can also take positions in commodities to exploit inflationary spikes (another area where bonds suffer). Thus, the core appeal of CTA’s strategy is flexibility – it doesn’t rely on a single macro regime to perform well. However, the flip side is that CTA’s performance is model-driven and may lag in benign environments, whereas bonds at least pay a steady coupon. An investor swapping bonds for CTA is effectively trading a known income stream and typical bond behavior for a more complex return pattern that should improve diversification.
In summary, Simplify’s CTA ETF implements a diversified managed futures program (multi-model, multi-asset) aimed at delivering “crisis alpha” (positive returns in equity bear markets) and uncorrelated growth. It carries higher expense (0.76% fee) and complexity than a bond index fund (which might cost 0.03% for BND), but offers the potential for protective gains in scenarios where bonds might fail. Next, we will examine whether that potential has been realized historically – i.e. how have managed futures (and CTA specifically) performed in past crises compared to bonds.
Historical and Crisis Performance: Managed Futures vs. Bonds
One of the strongest arguments for managed futures in a portfolio is their track record of performing well during major equity drawdowns, often offsetting stock losses. We compare the performance of CTA (and similar managed futures indices) versus bonds in key stress periods: the 2008 Global Financial Crisis, the March 2020 COVID crash, and the 2022 inflationary bear market. We also note long-term return differences. The table below highlights two critical years (2008 and 2022) and the performance of stocks, managed futures, and bonds:
| Period | S&P 500 (Stocks) | Managed Futures (CTA Index) | T-Bills (BIL – 1–3mo) | 10-Year Treasuries (IEF) | Total Bond (AGG) |
|---|---|---|---|---|---|
| 2008 (Financial Crisis) | -38% (Managed Futures Resources by Autumn Gold) (severe equity bear) | +13% (Managed Futures Resources by Autumn Gold) (CTA strategies profit) | +1.9% (BIL,IEF Total Return Stock Chart (Dividends Reinvested)) (almost flat) | +17.9% (BIL,IEF Total Return Stock Chart (Dividends Reinvested)) (Treasury rally) | +5.2% (Bloomberg US Aggregate Bonds Annual Returns) |
| 2022 (Stocks & Bonds Down) | -19% (Managed Futures Resources by Autumn Gold) (inflation bear) | +20% (Managed Futures Resources by Autumn Gold) (managed futures surge) | +1.4% ([ |
BIL,IEF Total Return Stock Chart (Dividends Reinvested) | Total Real Returns ](https://totalrealreturns.com/n/BIL,IEF#:~:text=Year%20%20BIL%20IEF%202025,16)) (rising short rates) | -15.1% ([
BIL,IEF Total Return Stock Chart (Dividends Reinvested) | Total Real Returns ](https://totalrealreturns.com/n/BIL,IEF#:~:text=Year%20%20BIL%20IEF%202025,16)) (sharp bond loss) | -13.0% (Bloomberg US Aggregate Bonds Annual Returns) |
Sources: S&P 500 and SocGen CTA Index from 2008 & 2022 (Managed Futures Resources by Autumn Gold) (Managed Futures Resources by Autumn Gold); Bloomberg US Agg Bond Index (Bloomberg US Aggregate Bonds Annual Returns) (Bloomberg US Aggregate Bonds Annual Returns); BIL and IEF ETF returns ([
BIL,IEF Total Return Stock Chart (Dividends Reinvested) | Total Real Returns ](https://totalrealreturns.com/n/BIL,IEF#:~:text=Year%20%20BIL%20IEF%202025,16)).
2008 – Global Financial Crisis: This was a deflationary panic where stocks collapsed and government bonds soared. Managed futures (CTA strategies) had a banner year: the Barclay CTA Index gained +13.9% in 2008 (Barclay CTA Index Gains 13.90% in 2008; Trending Markets Boost Managed Futures), and trend-following CTAs in particular did even better (the Barclay Diversified Traders Index was +26.5% in 2008) (Barclay CTA Index Gains 13.90% in 2008; Trending Markets Boost Managed Futures). The SG CTA Index (large CTAs) was similarly up ~13% (Managed Futures Resources by Autumn Gold). These funds profited by shorting equities and commodities (which were plunging in late 2008) and going long Treasuries or short interest rates as the Fed slashed rates (Barclay CTA Index Gains 13.90% in 2008; Trending Markets Boost Managed Futures). In essence, managed futures captured the same flight-to-quality rally that helped Treasuries, plus gains from other trends. Bonds: Treasuries performed excellently as well – long-term U.S. Treasuries returned on the order of +20–30% in 2008 (IEF, 7–10yr Treas, was +17.9% (BIL,IEF Total Return Stock Chart (Dividends Reinvested)); TLT, 20+ yr Treas, did even more). The broad bond market (AGG) returned +5.2% (Bloomberg US Aggregate Bonds Annual Returns), as Treasury gains were partly offset by losses in corporate bonds. So in 2008 both bonds and CTAs provided significant protection, with Treasuries slightly outgaining the average CTA. However, it’s worth noting: CTAs had positive returns every single quarter of the 2008 crisis, whereas some bond categories (like corporates) had interim losses. Many institutional investors noticed that CTAs provided reliable risk mitigation in 2008, spurring greater adoption post-crisis (Fixing the 40: Reassembling the 60/40 Portfolio | New Hyde Park Alternative Funds, LLC.) (Fixing the 40: Reassembling the 60/40 Portfolio | New Hyde Park Alternative Funds, LLC.).
Mar 2020 – COVID Crash: The pandemic crash was extremely rapid (S&P 500 fell 34% in just 5 weeks) and then snapped back after massive Fed intervention. Stocks ended 2020 actually up +16%, but during Q1 2020 they experienced a sudden drawdown (-20% in the quarter). Bonds: Treasuries did exactly what one hopes – as investors panic-sold risk assets and the Fed cut rates to zero, Treasury prices skyrocketed. IEF (10yr Treasuries) returned +10% in 2020 ([
BIL,IEF Total Return Stock Chart (Dividends Reinvested) | Total Real Returns ](https://totalrealreturns.com/n/BIL,IEF#:~:text=2022%20%20%2B1.40,16)) (most of that in Q1), and risk-free T-bills yielded ~0.4% ([
BIL,IEF Total Return Stock Chart (Dividends Reinvested) | Total Real Returns ](https://totalrealreturns.com/n/BIL,IEF#:~:text=2022%20%20%2B1.40,16)) (having started the year around 1.5% and then dropping to near 0% by March). Managed Futures: Trend-following CTAs had mixed results in this whipsaw. The SG CTA Index was up a modest +3.2% in 2020 (Managed Futures Resources by Autumn Gold) – positive, but not a huge windfall. Why? Many CTA models were not positioned bearishly enough at the start (the crash unfolded faster than typical trend signals adjust), and then the rapid V-shaped recovery in April/May meant any short positions had to reverse quickly, trimming profits. Some managed futures funds actually had small losses in Q1 2020, then gains later; others eked out gains during the selloff by shorting equity index futures and going long bonds, but gave some back in the volatile rebound. In short, bonds provided more immediate protection in the COVID crash (they were a direct hedge as the Fed pushed yields down), while CTAs provided only a cushion (flat to small gain). However, importantly, CTAs still preserved capital – they did not lose money during that equity crash, unlike many other diversifiers. By year-end 2020, an investor was better off with bonds for that particular episode (bond funds had strong returns plus income, vs CTA’s low single digit gain). This highlights that in sudden, policy-driven shocks (with rapid mean-reversion), trend-following can lag the responsiveness of bonds.
2022 – Inflation and Rising Rates: This year was a nightmare for the classic 60/40 portfolio because both stocks and bonds fell substantially. The S&P 500 ended –18% (with a max drawdown around –25%), and the Bloomberg Aggregate Bond Index was –13% (Bloomberg US Aggregate Bonds Annual Returns) (its worst year on record) as the Fed hiked rates at the fastest pace in decades. Bonds: Normally, bonds would rally in a growth scare, but 2022’s problem was inflation – yields rose across the curve (the 10-year Treasury yield jumped from ~1.5% to ~3.9%), crushing bond prices. Intermediate Treasuries (IEF) lost –15.1% ([
BIL,IEF Total Return Stock Chart (Dividends Reinvested) | Total Real Returns ](https://totalrealreturns.com/n/BIL,IEF#:~:text=2024%20%20%2B5.20,12)) and even short-term T-bills, while safe from price loss, only returned +1.4% ([
BIL,IEF Total Return Stock Chart (Dividends Reinvested) | Total Real Returns ](https://totalrealreturns.com/n/BIL,IEF#:~:text=2024%20%20%2B5.20,12)) as yields climbed from zero to ~4%. So bonds failed as a diversifier in 2022 – they added to portfolio losses instead of offsetting them. Managed Futures: This was the scenario where managed futures truly shined. Trend-following CTAs had one of their best years since 2008: the SG CTA index gained about +20.2% in 2022 (Managed Futures Resources by Autumn Gold). Funds that trend-followed global futures were able to short bonds (profiting from falling bond prices), go long commodities (many commodity futures surged in price through mid-2022, e.g. energy and grains spiked due to inflation and the Russia-Ukraine war), and even short equities during the downtrends. It was a nearly ideal environment for the strategy – multiple strong trends, uncorrelated to equities. Simplify’s CTA ETF (ticker CTA) itself launched in March 2022, so it didn’t capture Q1, but from inception through year-end 2022 it posted solid gains. By end of 2022, CTA’s NAV was up and it made a sizeable distribution of profits. In Q1 2022 (when stocks were down ~–5% and bonds –6%), CTA’s index proxy (SG Trend Index) was up roughly +10% (Fixing the 40: Reassembling the 60/40 Portfolio | New Hyde Park Alternative Funds, LLC.), demonstrating immediate crisis alpha. The key takeaway: In an inflationary or stagflationary crisis – when stocks and bonds both suffer – managed futures can be a superior safety net. 2022 proved the value of having something like CTA in the portfolio: it delivered positive returns and liquidity when both equities and fixed income were bleeding. Many investors who held funds like CTA or DBMF (another managed futures ETF) saw mid-teens to 20% gains that year, which helped offset losses elsewhere. This has led to the proposition of using managed futures to “fix” the 40 (bond) side of the portfolio in the new macro regime (Fixing the 40: Reassembling the 60/40 Portfolio | New Hyde Park Alternative Funds, LLC.) (Fixing the 40: Reassembling the 60/40 Portfolio | New Hyde Park Alternative Funds, LLC.).
Other Periods: Historically, managed futures have a low long-term correlation to stocks (often slightly positive in calm periods, negative in crisis) (Managed Futures Resources by Autumn Gold). During the dot-com bust (2000–2002), CTA strategies had positive returns each year (e.g. +8–13% in 2000 and 2002) while stocks were deeply negative (Managed Futures Resources by Autumn Gold). Bonds also performed well in that recession (falling interest rates). In the 2010s bull market, managed futures indexes had lackluster returns (flat to low single digits annualized) (Managed Futures Resources by Autumn Gold) because there were fewer sustained trends (plus very low yields on collateral), whereas bonds and equities did well. So there were extended periods where an aggregate bond fund outpaced managed futures in a falling-rate environment. Indeed, one analysis shows that from 2000–2021 (an era of mostly benign inflation and steady rate declines), a traditional 60/40 slightly outperformed a 60/0/40 (60% equity, 0% bonds, 40% managed futures) portfolio – but once 2022’s inflation hit, the managed futures–inclusive portfolio pulled ahead over the full period (Fixing the 40: Reassembling the 60/40 Portfolio | New Hyde Park Alternative Funds, LLC.) (Fixing the 40: Reassembling the 60/40 Portfolio | New Hyde Park Alternative Funds, LLC.). This suggests that over long horizons, replacing bonds with managed futures can yield similar or better outcomes, especially if an inflationary crisis occurs.
To illustrate, New Hyde Park Alternatives back-tested a “60/40 vs. 60/0/40 (replace bonds with managed futures)” from 2000–2023: the risk/return stats were very similar, with the managed futures version edging out the traditional portfolio after 2022’s outperformance (Fixing the 40: Reassembling the 60/40 Portfolio | New Hyde Park Alternative Funds, LLC.) (Fixing the 40: Reassembling the 60/40 Portfolio | New Hyde Park Alternative Funds, LLC.). Volatility was comparable and overall returns ended slightly higher for the CTA-infused portfolio. The conclusion was that managed futures are an excellent complement or even replacement for bonds in essentially any mid- to long-term scenario (Fixing the 40: Reassembling the 60/40 Portfolio | New Hyde Park Alternative Funds, LLC.) – they can play the diversifier role that bonds usually play, and do so even in environments where bonds falter.
However, it’s important to temper this with tax and practical considerations in a taxable account context: Those backtests are pre-tax and assume institutional access to CTA returns. In reality, an individual in taxable might not capture the full pre-tax return (due to annual taxation as discussed). Also, managed futures funds can have higher drawdowns than, say, a short-term Treasury fund. For example, Simplify CTA had about a –11% drawdown in early 2023 when many 2022 trends reversed (stocks and bonds rallied in tandem), resulting in a –3.5% calendar 2023 loss for CTA (Managed Futures Resources by Autumn Gold). A total bond fund in 2023 was roughly flat to +1%. So there will be years where bonds outperform or provide a smoother ride (particularly in “normal” market years). The pattern we see is: in extreme equity bear markets (2008, 2022), managed futures deliver strong positive returns, often outperforming bonds; in mild equity downturns or rapid corrections (2011, 2018, Q1 2020), managed futures might eke out small gains or be flat while bonds rally modestly; in equity bull or recovery phases, managed futures can lag a bit or still make gains but usually less than equities, and bonds just chug along with their yield.
For an investor concerned with “tail risk” and major drawdowns, the evidence is compelling that CTA provides protection when it’s needed most. Notably, in every 6-month period since 2000 where the S&P 500 fell >15%, the managed futures industry had positive returns (Fixing the 40: Reassembling the 60/40 Portfolio | New Hyde Park Alternative Funds, LLC.). Bonds cannot claim that – 2022 broke the pattern for bonds. Thus, adding CTA can make a portfolio more robust to the widest range of shocks.
Forward-Looking Analysis for 2025: What to Expect from CTA vs. Bonds
As of 2025, the macroeconomic context is markedly different from the 2010s. We have: higher interest rates, moderating but above-target inflation, and global uncertainties (geopolitical tensions, post-pandemic adjustments). The Federal Reserve in 2022–2023 raised the Fed Funds rate to around 5%. By 2025, they may be pausing or even considering cuts if inflation is tamed and growth slows, but there is considerable uncertainty. The yield curve in early 2025 has been inverted (short-term yields > long-term yields), reflecting expectations of future rate cuts. This backdrop will influence whether bonds or managed futures are the better risk mitigator going forward:
- Bond Outlook (2025): Yields are at the highest levels in ~15 years, so the starting carry on bonds is attractive (4–5% yield on intermediate Treasuries, >5% on short T-bills). If the economy enters a recession or inflation continues to decline, the Fed could cut rates – in that scenario, bonds would likely rally (prices up, yields down), delivering capital gains on top of yield. This is a favorable setup for bonds as a hedge against a growth downturn: they could potentially give positive returns and provide ballast if equities fall due to recession. On the other hand, if inflation re-accelerates or remains sticky around say 3%+, the Fed might hold rates high for longer (or even hike more), and long-term yields might rise due to term premium or fiscal concerns. In that adverse scenario, bonds could once again lose value even if equities also struggle (similar to 2022 albeit likely less severe if inflation is lower). So bonds have a two-sided risk: beneficial in a deflationary outcome, bad in an inflation surprise. The consensus entering 2025 is that inflation is on a downward path, but as 2022 taught us, surprises can happen. Meanwhile, just earning the ~5% yield is a decent low-volatility return if nothing dramatic happens – far better than the ~1% yields in 2020. So bonds are no longer “returnless risk”; they have meaningful income now.
- CTA/Managed Futures Outlook (2025): Managed futures strategies like CTA thrive on trends and volatility. Several macro trends could present opportunities: e.g. trends in interest rates (if the Fed pivots to cuts, CTAs might go long bonds; if inflation surprises, they’d stay short bonds), currency trends (differing central bank policies could drive USD or other currency moves), and commodity swings (energy markets reacting to geopolitical events, etc.). One notable point: with interest rates high, CTA’s collateral yield (~5%) is a strong tailwind. Even if the strategy’s futures trades only break even in 2025, that yield generates a few percent return (before fees). So “doing nothing” has a positive expected return now (unlike the near-zero yield era). For CTA to outperform bonds in 2025, we’d likely need either another equity downturn (where CTA can short equities or go long safe havens) or some non-equity trends that produce gains beyond the carry. For instance, if inflation flares up and central banks tighten further, CTAs might profit from short bond positions and long commodity positions, whereas bonds would be hurt – similar to 2022. If instead we get a recession and disinflation, CTAs might flip to long bond futures and maybe short commodities, capturing some of the bond rally (but interestingly, in such a scenario the bond ETF itself would also do well – CTA might match or slightly lag the pure bond exposure due to signal timing).
- Geopolitical and Tail Risks: 2025 is not without event risk – ongoing war in Ukraine, potential flare-ups in other regions, and perhaps financial stresses from high rates could all rock markets. Managed futures are generally good at reacting to such shocks if they create sustained price moves. For example, a supply shock causing oil to spike would hurt stocks and bonds (higher inflation), but CTA could profit from long oil and short equities. A sudden crisis causing a flight-to-quality would see bonds rally (CTA might initially be short bonds but would hopefully reverse to long quickly if a clear trend of falling yields emerges). The speed of the shock matters: rapid, mean-reverting shocks (like a quick correction and rebound) are tough for CTA to capitalize on fully, whereas extended crises are ideal. Bonds respond immediately to risk-off (yields fall), but if the cause is inflationary, that response may not hold.
- Expected Returns: Over the long run, one might expect an intermediate bond fund to return roughly its yield (~4–5% now) assuming no big change in rates (plus/minus any price change if yields drift). Managed futures have no set “yield” – their return comes from exploiting opportunities. Historically, managed futures indices have delivered around 5–8% annualized returns (with wide variation) (Managed Futures: What to Know About This Strategy for ETFs). In years like 2022, returns were well above that; in quiet years, near zero or slight negative. One can think of CTA as having a higher return potential than bonds (especially in divergent markets) but also a higher variance. In 2025, if markets are range-bound and choppy (no strong trends), CTA’s returns might be muted (perhaps just the T-Bill yield minus fees, ~+3% net). Bonds would deliver their 4–5% yield. If a strong trend or crisis emerges, CTA could significantly outperform – e.g. another inflation spike or some commodity boom could give double-digit CTA gains while bonds suffer. Conversely, if a sharp disinflationary recession hits and then rapid recovery (V-shape), bonds might rally then give back some, whereas CTA could struggle if trends flip-flop.
- Correlation and Diversification: Looking forward, one key question is the stock/bond correlation. Will bonds return to their role of reliably zigging when stocks zag? In 2023, as inflation fears eased, the stock–bond correlation actually moved back toward negative (bonds and stocks were somewhat inversely correlated in late 2023, which is good for diversification). If in 2025 we are in a more normal regime (inflation under control, Fed potentially easing in a recession), bonds might resume their negative correlation to equities, acting as a decent hedge (like in pre-2020 times) (Fixing the 40: Reassembling the 60/40 Portfolio | New Hyde Park Alternative Funds, LLC.) (Fixing the 40: Reassembling the 60/40 Portfolio | New Hyde Park Alternative Funds, LLC.). Managed futures, on the other hand, tend to be near zero correlation on average, but strongly negative in big equity down moves. So CTA is more of a “crisis lab” – very helpful in major declines, but uncorrelated (sometimes even slightly positive correlation) in benign periods. The investor should consider what kind of downturn they worry about: if it’s primarily an inflationary shock or secular regime shift, CTA is likely superior to bonds as a hedge; if it’s a standard recession/deflation bear market, high-quality bonds might do the job (and did so reliably for decades prior to 2020). Many analysts are divided on whether the post-2020 world will feature persistent inflationary pressures (due to deglobalization, fiscal spending, etc.) or will revert to low inflation. This uncertainty makes a case for diversifying one’s diversifiers – i.e. holding some of both bonds and managed futures to hedge different scenarios.
- Volatility and Drawdowns: In a single year like 2025, one must also consider the ride. Bonds (especially short-term) have low volatility. The worst-case 1-year loss for a short-term Treasury ETF historically is minimal (maybe a fraction of a percent), and for an intermediate Treasury fund might be on the order of –5% to –10% in a bad year (2022 was an outlier at –15%). Managed futures, in contrast, could potentially have a down year if there are no clear trends or if it gets whipsawed – a loss of 5–10% (as seen in some past years like 2011 or 2018 for CTA indices (Managed Futures Resources by Autumn Gold)) is possible. The investor should be psychologically prepared for the managed futures allocation to behave differently – it won’t just steadily pay a coupon; it might zigzag. That said, CTA’s worst drawdowns tend to be modest compared to equities (and often occur when equities are rising, so the overall portfolio impact is softened).
Considering 2025 specifically: if one expects continued market volatility and is unsure about the stock–bond correlation, adding CTA is a way to “hedge the hedge.” It provides protection in the scenario where bonds and stocks both fall (high inflation or policy mistake), which is arguably a non-negligible risk even if not base case. If one is more confident that inflation is done and a plain recession is the worry, bonds might suffice and will be more predictable on taxes and yield.
Recommendation: Is CTA a Superior Substitute for Bonds in 2025?
Pros of CTA vs Bonds:
- Diversification and Crisis Alpha: CTA offers broader diversification. It has the proven ability to generate positive returns in equity bear markets even when bonds fail, as evidenced in 2022 (Managed Futures Resources by Autumn Gold) (Bloomberg US Aggregate Bonds Annual Returns). It can profit from trends in commodities, currencies, and rates that bonds cannot. This makes it a potent hedge against stagflation or other atypical crises. Bonds, by contrast, mainly hedge deflationary or growth shocks and can be vulnerable to inflation/rate risk. For an investor worried about “the next crisis” but unsure of its nature, CTA covers more bases.
- Return Potential: Managed futures aim not just to preserve capital but to grow it in different market regimes. Over the long run, a well-run CTA strategy can deliver equity-like or bond-like returns (mid-single digits) with low correlation (Managed Futures: What to Know About This Strategy for ETFs). In periods of sustained trends, CTAs can outperform both stocks and bonds. For example, CTA’s +24% gain in 2024 (through Q4) (CTA-Fact-Sheet-4Q24) far exceeded bond returns that year. While past performance doesn’t guarantee future results, the strategy inherently has the flexibility to seek returns in places that a static bond allocation cannot.
- Inflation Hedge: By trading commodities and shorting bonds, CTA provides a degree of inflation hedging. If inflation surprises to the upside, a bond-heavy portfolio gets hurt, but CTA would likely capitalize on rising commodity prices and interest rates. In a way, CTA can be seen as “long volatility” or “long inflation risk” – it tends to do well when market volatility and inflation trends pick up.
- “Paid-to-Wait” Factor: As of 2025, CTA’s collateral yield (T-bills) is over 5%, which helps cover taxes and fees. The fund’s distribution yield was ~10% annualized in 2024 (CTA Simplify Managed Futures Strategy ETF | Simplify) (CTA Simplify Managed Futures Strategy ETF | Simplify), meaning it generated significant current income (mostly from trading gains and T-bill interest). This reduces the opportunity cost of holding CTA. In contrast, earlier last decade one critique of managed futures was the near-zero interest drag; now it’s earning positive carry. So an investor “gets paid” while holding this hedge – similar to earning bond interest, albeit taxed the same way.
- No K-1 and Liquidity: Simplify CTA is an exchange-traded fund with daily liquidity and no K-1 hassles (CTA-Fact-Sheet-4Q24). It’s easy to trade and integrate into a portfolio. Many alternative strategies are in private funds or require accredited status, but here the investor gets institutional strategy access in a convenient wrapper. (Bond ETFs are also very liquid and simple; so both are fine on this front.)
- Comparable Volatility to Bond Portfolio: A full replacement of bonds with CTA would increase standalone volatility (CTA’s vol ~10% vs. a bond fund ~3–5%). However, in a stock-heavy portfolio, the difference may not be dramatic in overall portfolio volatility because CTA’s correlation to stocks is near zero or negative in downturns. Some portfolio modeling suggests that replacing a portion of bonds with managed futures maintains similar portfolio risk over the long term (Fixing the 40: Reassembling the 60/40 Portfolio | New Hyde Park Alternative Funds, LLC.) (Fixing the 40: Reassembling the 60/40 Portfolio | New Hyde Park Alternative Funds, LLC.). Essentially, CTA can play a similar risk-reduction role, just via a different mechanism.
Cons of CTA vs Bonds:
- Tax Inefficiency in Taxable Account: As detailed, CTA does not avoid the tax drag. In fact, if CTA has strong performance, the investor will face hefty taxes each year on those gains (at ordinary rates) – effectively realizing taxable income that could have been deferred if using buy-and-hold assets. Bonds also have annual taxable interest, but at least it’s a known quantity. One could argue the expected after-tax return of CTA might be similar to or slightly above bonds, but with more variability. For a top-bracket taxable investor who doesn’t need the extra return, the tax cost of CTA’s short-term gains might be a drawback. (If the investor had the option, holding CTA in an IRA and bonds in taxable might be ideal, but assuming here it’s all taxable.)
- Uncertain Year-to-Year Performance: Bonds (especially Treasuries) provide relatively stable and predictable outcomes (you get yield, and price moves are tied to rate changes which are somewhat forecastable). Managed futures returns are unpredictable – they depend on market trends that may or may not occur. It’s possible that after a great 2022 and 2024, the strategy could hit a flat or losing period. For instance, if markets become very choppy (no clear trends, frequent reversals) – which can happen if central banks manage a soft landing – CTA might churn with little to show (except the T-bill interest). In that case, the investor might wonder why they didn’t just take the guaranteed 5% yield from short-term Treasuries. An allocation to CTA requires patience and trust in the strategy’s long-term payoff, whereas bonds pay their coupon regularly.
- Higher Complexity and Cost: CTA charges a 0.76% expense ratio (and higher trading costs embedded due to futures turnover). Bond ETFs are extremely cheap (0.03–0.05% for BND, essentially negligible cost). This fee difference is meaningful over long horizons and especially when compounded after tax (though CTA’s outperformance can justify the fee, it’s not guaranteed). There’s also more complexity in understanding what CTA is doing at any given time – it might be hard for an investor to know the fund’s exposures (though Simplify does publish holdings). With bonds, one knows exactly the duration and credit risk. Simplicity can be valuable for some investors.
- Potential Drawdowns: If an investor replaces all bonds with CTA, they need to tolerate periods where both stocks and CTA could decline together. While historically CTA and equities are uncorrelated, it’s not impossible to have a scenario where, say, stocks fall moderately and CTA also loses (for example, a rapid equity correction that doesn’t establish a trend, while bond yields don’t move enough to help CTA’s other positions). In such a scenario, bonds might have cushioned the fall whereas CTA might not have. The NHPAF study admitted that an entire bond book replacement with CTA is “drastic”, and suggested that even though it works over the long run, a partial replacement might be more palatable (Fixing the 40: Reassembling the 60/40 Portfolio | New Hyde Park Alternative Funds, LLC.). In practice, keeping some core bond exposure while adding CTA could provide a more balanced hedge – bonds for quick shocks/deflation, CTA for inflation and trend opportunities.
- No Inherent Income or Certainty: If the investor relies on portfolio income, bonds provide a steady stream of interest that is relatively certain. CTA’s distributions come from gains which may or may not occur. (Though in 2023–24 CTA has actually had quite high distributions, this isn’t assured every year.) So for income-focused investors, CTA is not a substitute; it’s more of a total-return play.
Final Recommendation: For a long-term, high-income investor in a taxable account, Simplify CTA can be a viable substitute or complement for part of the bond allocation, but it is not a straightforward one-for-one replacement in all respects. Given the analysis, here are our recommendations and key takeaways:
- Use CTA to Complement Bonds (Partial Replacement): Rather than entirely swapping out bonds for CTA, consider replacing a portion (e.g. half) of the traditional bond exposure with CTA. This provides a hybrid approach: bonds will cover the scenarios of falling rates and provide steady income, while CTA will cover the scenarios of rising rates, inflation spikes, or other non-traditional crises. This diversified approach hedges against both types of risk and smooths the ride. The result is a more robust “40” in the 60/40. As New Hyde Park’s research concluded, managed futures are an excellent replacement or complement to bonds in virtually any environment (Fixing the 40: Reassembling the 60/40 Portfolio | New Hyde Park Alternative Funds, LLC.), but one doesn’t necessarily need to go 100% one way or the other.
- Consider Time Horizon and After-Tax Perspective: If the investor’s time horizon is long and the goal is maximizing after-tax risk-adjusted growth, CTA’s higher return potential and diversification benefits likely outweigh its tax costs relative to bonds. Over a full market cycle, the after-tax returns could come out ahead, especially if an inflationary or crisis period occurs (CTA’s pre-tax outperformance in such times can more than compensate for tax drag). However, if the investor is very tax-sensitive and seeks minimal tracking error to a traditional approach, they should be aware that CTA will generate more volatile tax outcomes (e.g. large taxable gains in some years). Given Florida has no state tax, the difference between CTA and Treasuries from a tax angle is mainly the timing of taxes (annual vs deferrable) and the magnitude (CTA possibly higher distributions). In our view, those are acceptable given CTA’s benefits, but the investor must reinvest those after-tax gains to realize the compounding – not spend them – if they want to mimic the pre-tax performance.
- Align with Risk Appetite: Replacing low-volatility bonds with a higher-volatility alternative means the investor should be comfortable with more variability. If the investor’s primary goal for bonds was capital preservation and dampening portfolio swings, going all-in on CTA might introduce too much uncertainty in the short run. A partial allocation to CTA can improve diversification without completely sacrificing stability. For example, a mix might be 20% CTA, 20% bonds instead of 40% bonds. This way, even if CTA underperforms or has a drawdown, a chunk of the fixed income sleeve is still doing its steady job. On the other hand, an aggressive investor who is mostly concerned about tail risks and less about interim income might go a higher CTA weight.
- Monitor and Rebalance: If implementing CTA, treat it as a strategic allocation that will be rebalanced. CTA’s returns can be very different from bonds, so the allocation could drift. Rebalancing annually can also create opportunities for tax loss harvesting or taking profits. For instance, after 2022’s big gain, one could trim some CTA (in a tax-savvy way) to bolster bond holdings if bonds became very cheap, etc. The active management of the allocation can enhance after-tax results (though one must be mindful of realizing short-term gains – using long-term holding periods for ETF shares when possible is ideal).
- Tax Mitigation: While you cannot avoid the annual taxation fully, there are small optimizations: use any tax-loss harvesting opportunities if CTA experiences a drawdown (sell and replace with a similar fund like DBMF or KMLM to realize a loss and maintain exposure, respecting wash sale rules). Losses from one year can offset gains from another. Also, asset location is key – if this investor has any tax-deferred accounts in addition to taxable, prioritizing CTA in the IRA and bonds in taxable (or using municipal bonds in taxable) could be considered. Since the question is specifically about the taxable account, we assume no better location, but it’s worth mentioning as a holistic plan.
Conclusion: In 2025, with no state tax to worry about and a desire to reduce portfolio drawdowns, CTA appears to be a very compelling addition to the portfolio and, in many respects, a superior “insurance” asset compared to bonds. It addresses the key weakness exposed in 2022 – that bonds can fail when inflation strikes – and provides opportunistic return sources. However, it does come with its own drawbacks (taxable distributions and higher complexity). For this high-income investor, we recommend allocating a significant portion of the defensive assets to CTA, but not necessarily 100%. A reasonable approach might be to replace half of the bond exposure with CTA, and maintain the other half in short-to-intermediate Treasury ETFs. This blend would have yielded excellent results in recent history and should continue to provide a balance of steady income, interest rate sensitivity (from bonds), and crisis alpha (from CTA).
Ultimately, CTA can be viewed as a risk-reducing, diversification-enhancing tool that, when used thoughtfully, improves the resilience of a taxable portfolio. It is viable as a bond substitute for an investor who understands the trade-offs, and in certain regimes it will be clearly superior (e.g. high inflation periods), whereas in others bonds might hold their own. Given today’s macro uncertainties, incorporating both gives the investor a more all-weather portfolio prepared for whatever 2025 and beyond may bring. As one research piece succinctly put it: “investors seeking to build a portfolio that can weather all market cycles, including periods of inflation, should consider replacing a portion of their bond portfolio with managed futures” (Fixing the 40: Reassembling the 60/40 Portfolio | New Hyde Park Alternative Funds, LLC.) – we concur with that advice, with the caveat of managing it in a tax-conscious way.
Key Takeaway: Yes, CTA is a viable (and often superior) substitute for bonds for a high-tax-bracket investor concerned with risk mitigation, especially in the current environment. It provides diversification benefits that traditional bonds cannot, albeit with annual tax costs. The recommended course is to use CTA strategically alongside some bond exposure to capture the best of both worlds – achieving robust downside protection, lower correlation, and respectable after-tax returns for the long run.
Sources:
- Simplify CTA ETF – Fund description, strategy and tax structure (CTA Simplify Managed Futures Strategy ETF | Simplify) (CTA-Fact-Sheet-4Q24) (CTA-Fact-Sheet-4Q24)
- Simplify “A Hedge You Get Paid to Own” – Discussion of CTA use case and performance in 2022/2024 (A Hedge You Get Paid to Own | Simplify) (A Hedge You Get Paid to Own | Simplify)
- SocGen CTA Index and Bloomberg Bond Index data – historical performance in 2000–2023 (Managed Futures Resources by Autumn Gold) (Managed Futures Resources by Autumn Gold) (Bloomberg US Aggregate Bonds Annual Returns)
- BarclayHedge report – 2008 CTA gains vs. markets (Barclay CTA Index Gains 13.90% in 2008; Trending Markets Boost Managed Futures) (Barclay CTA Index Gains 13.90% in 2008; Trending Markets Boost Managed Futures)
- ETF returns (BIL, IEF, AGG) – 2008, 2020, 2022 outcomes (BIL,IEF Total Return Stock Chart (Dividends Reinvested)) ([BIL,IEF Total Return Stock Chart (Dividends Reinvested) | Total Real Returns ](https://totalrealreturns.com/n/BIL,IEF#:~:text=2024%20%20%2B5.20,16))
- NHPAF Research – Managed futures replacing bonds analysis and conclusion (Fixing the 40: Reassembling the 60/40 Portfolio | New Hyde Park Alternative Funds, LLC.) (Fixing the 40: Reassembling the 60/40 Portfolio | New Hyde Park Alternative Funds, LLC.)
- AlphaArchitect – Tax efficiency of futures vs. bond ETFs (Exploring Bond Tax Efficiency: Futures or Bond ETFs? –) (Exploring Bond Tax Efficiency: Futures or Bond ETFs? –)
- Simplify CTA Prospectus – Tax information (ordinary income distributions) (Submission Proof – D:\Users\Empire-MB-2\OneDrive – empirefilings.com\Production\e142823\e142823.gfp)
- Reddit LETFs discussion – tax inefficiency of CTA/managed futures ETFs in taxable accounts (Managed Futures ETF Info : r/LETFs – Reddit).


Leave a comment