Stocks at a Crossroads: Tariff Escalation, Sticky Inflation, and Recession Odds – Weekly Market Analysis
Introduction: A one-two punch of rising core inflation and escalating trade tariffs rattled the U.S. stock market this week. Investors are now asking: Is the market correction over, or just getting started? In this comprehensive weekly update, we break down what changed in the past week – from fresh PCE inflation data to new tariff policies – and update our probability models on whether the recent correction is giving way to a bear market or poised for a rebound. We’ll also examine recession odds, sector performance, and what the experts are saying, so that DIY investors can navigate these turbulent times with confidence.
What’s Changed This Week
- Inflation Surprise: The Fed’s preferred inflation gauge (PCE) showed core prices rising 0.4% in February, pushing core PCE inflation up to 2.8% year-over-year – slightly hotter than expected (US core PCE prices rise more than expected in February – Investing Abroad News | The Financial Express). This uptick from last month’s 2.7% suggests disinflation progress has stalled for now, keeping core inflation well above the Fed’s 2% target. (US consumer spending rises in February; core inflation firmer | Reuters) (US core PCE prices rise more than expected in February – Investing Abroad News | The Financial Express)
- Tariffs and Trade Tensions: President Trump announced a 25% tariff on imported cars and parts, effective next week, as part of a “wave of reciprocal tariffs” aimed at boosting U.S. industry (US consumer spending rises in February; core inflation firmer | Reuters) (US consumer spending rises in February; core inflation firmer | Reuters). The move escalated trade tensions with major partners and sparked fears of retaliatory duties, adding to market uncertainty and inflationary pressure in the short run (US consumer spending rises in February; core inflation firmer | Reuters).
- Market Sentiment Shift: Equity markets extended their volatility. The S&P 500 is now about 8% below its February high, and briefly crossed the -10% threshold into official correction territory (S&P 500 correction in six charts | Reuters). Defensive sectors like healthcare and consumer staples have outperformed (up year-to-date), while previous high-fliers in tech and consumer discretionary slid deeper into the red (Is this a market correction? | U.S. Bank). Bearish sentiment hit a 2-year high among individual investors, and the VIX “fear index” spiked to a 7-month high around 29 (S&P 500 correction in six charts | Reuters) (S&P 500 correction in six charts | Reuters).
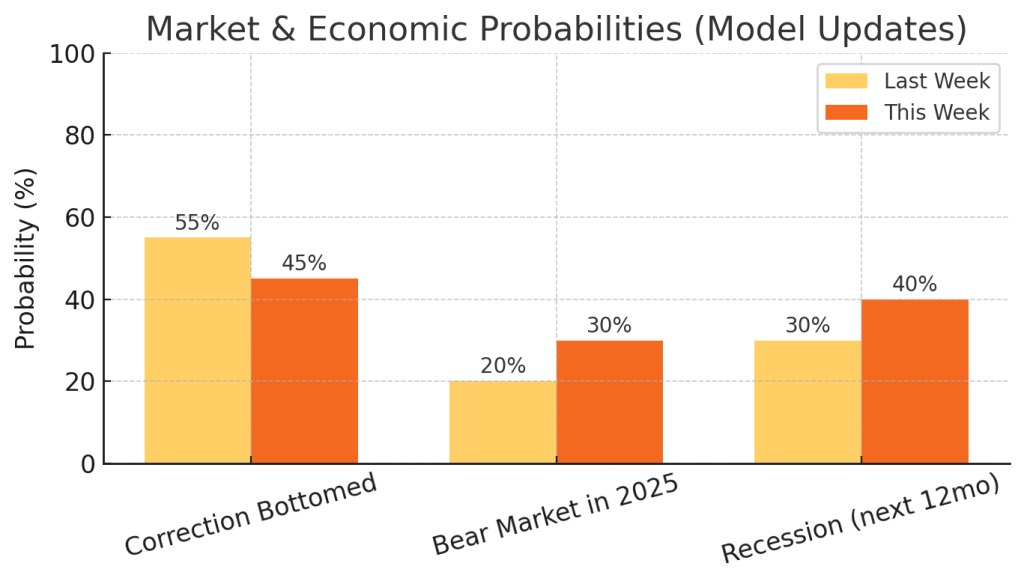
- Probability Model Updates: Based on new data and trends, our Monte Carlo & Bayesian models now assign a higher probability to bearish outcomes than a week ago. We now estimate a 30% chance of a bear market developing (up from ~20% last week) and roughly a 40% probability of a U.S. recession within 12 months (up from ~30%). Conversely, the odds that the market’s correction has already bottomed slipped to ~45% (down from ~55% last week). We visualize these shifts below in orange, compared to last week’s estimates in yellow (image):
- Chart: Our updated probability estimates show rising odds of a bear market and recession versus last week. Historical context: since 1929, fewer than 40% of corrections turn into full bear markets (S&P 500 correction in six charts | Reuters), but current headwinds tilt the risk higher than normal. (S&P 500 correction in six charts | Reuters) (J.P. Morgan economist sees 40% US recession chance and risks to ‘exorbitant privilege’ | Reuters)
Is the Market Correction Over or Continuing?
After four straight weeks of losses, the market attempted a shaky rebound in mid-March – only to falter again on fresh tariff news. As of Friday, the S&P 500 remains in a -8% drawdown from its peak, and the big question is whether the bottom is in. Historical data provides some hope: the average stock market correction (a drop of 10%+) since 1929 has been about -13.8% before recovery, far milder than the average -35% decline of bear markets (S&P 500 correction in six charts | Reuters). And out of 56 corrections in that span, only 22 (about 39%) have morphed into bear markets (S&P 500 correction in six charts | Reuters). These odds favor the correction ending short of a 20% decline – if underlying conditions stabilize.
However, today’s backdrop is far from average. Policy uncertainty is immense – the opposite of the so-called “Trump put” (the assumption that the administration would avoid policies that tank stocks) (S&P 500 correction in six charts | Reuters). Instead, the White House’s tariff actions have undercut investor confidence, removing a pillar of support and injecting volatility. This week’s tariff escalation fed fears that the correction could deepen: traders worry that escalating trade tensions will “fan inflationary pressures and potentially stall economic growth, raising the specter of a recession.” (S&P 500 correction in six charts | Reuters)
On the positive side, technical and sentiment indicators are approaching extremes that often precede a market bottom. The AAII sentiment survey’s bearish readings (highest in over two years) indicate potential capitulation among retail investors (S&P 500 correction in six charts | Reuters). Similarly, volatility spiking to multi-month highs means a lot of bad news may be priced in (S&P 500 correction in six charts | Reuters). If there are no new negative shocks (or if the tariff news proves “sell the rumor, buy the news”), the market could stabilize. Moreover, corporate fundamentals entering 2025 were relatively strong – many U.S. companies are cash-rich and consumers are in a good spot financially, providing a cushion (Is this a market correction? | U.S. Bank). This foundation could help limit the depth of the correction, assuming no major deterioration in coming weeks.
Our take: The probability the correction has already bottomed is around 45% in our latest model (slightly below even odds). To confidently call an end to the correction, we’d want to see evidence of cooling rhetoric on trade or a string of lighter inflation data to ease Fed concerns. Absent that, there’s still a significant 55% chance that this correction continues (with a portion of that risk being it deepens into a bear market). In practical terms, DIY investors should stay vigilant: further downside of 5-10% is plausible if earnings or economic data start to reflect the tariff impact. At the same time, long-term investors can remember that most corrections do not become bears, and sharp sell-offs can create opportunities – especially in quality stocks beaten down by panic. The coming 1-2 weeks (with more economic reports and any tariff retaliation news) will be critical in determining which path the market takes.
Bear Market Risk and Recession Odds
The drumbeat of recession warnings grew louder this week. J.P. Morgan’s chief economist raised his estimated odds of a U.S. recession in 2025 to 40% (from 30%), specifically citing concerns that Trump’s import duties will slow the economy (J.P. Morgan economist sees 40% US recession chance and risks to ‘exorbitant privilege’ | Reuters). He cautioned that if the full slate of threatened tariffs launches in April, recession risk could rise above 50% (J.P. Morgan economist sees 40% US recession chance and risks to ‘exorbitant privilege’ | Reuters) – essentially a coin flip. This aligns with our models, which now peg ~40% odds of recession in the next 12 months, up from ~30% prior to the tariff escalation. For context, the U.S. yield curve (10-year minus 3-month Treasury yield) has been inverted recently, but less so than in 2023. The New York Fed’s yield-curve model (as of February) put the 1-year-ahead recession probability around 27% (). Our higher 40% estimate reflects additional factors like policy uncertainty and falling business/consumer confidence that the yield curve alone might underestimate.
It’s important to note what kind of recession might be on the horizon if one occurs. Many economists foresee any 2025 recession as mild, given the lack of obvious imbalances – a far cry from 2008 or even 2020. However, the risks have risen. Business surveys and consumer sentiment are weakening: tariff fears have already led some companies to slash guidance (e.g. Delta Air Lines halved its profit outlook, citing economic uncertainty (S&P 500 correction in six charts | Reuters) (S&P 500 correction in six charts | Reuters)). If trade conflicts persist into the summer, we could see hiring slowdowns or postponed capital spending that tip the economy into a short contraction by late 2025.
As for the bear market probability: we’ve raised it to about 30%. A bear market would mean the S&P 500 falling 20% or more from its peak (which was ~Feb 19, 2025). Currently we’re ~8% off the high; dropping into a full bear would require roughly another >12% decline. Historically, bear markets often coincide with recessions – but not always. We could imagine a scenario where aggressive tariffs and a few policy missteps cause a sharp risk-off move in markets even if an official recession is narrowly avoided. For now, the base case of most Wall Street strategists is not a deep bear: for instance, Goldman Sachs and Morgan Stanley recently trimmed their 2025 GDP forecasts (to ~1.5–1.7% growth) but did not base-case a recession (J.P. Morgan economist sees 40% US recession chance and risks to ‘exorbitant privilege’ | Reuters). They imply a slowdown, not a collapse. Similarly, our base case remains that a prolonged bear market can be avoided, especially if the Fed pivots to support growth. But the downside tail risk – a policy mistake or external shock – has unquestionably grown. DIY investors should stress-test their portfolios for a scenario where the S&P might fall, say, 15-20% in total, even if that’s not our central prediction.
Inflation and the Fed’s Next Move
The Personal Consumption Expenditures (PCE) price index release on Friday offered a mixed picture. Headline PCE inflation came in at 0.3% month-over-month (2.5% year-over-year) for February – holding steady at the prior month’s pace and roughly in line with expectations (US consumer spending rises in February; core inflation firmer | Reuters) (US core PCE prices rise more than expected in February – Investing Abroad News | The Financial Express). However, the core PCE (which strips out food and energy) rose a brisk 0.4% m/m, nudging the core year-over-year rate up to 2.8% (US core PCE prices rise more than expected in February – Investing Abroad News | The Financial Express). The chart below shows how inflation has trended downward over the past two years but remains above target, with core inflation (orange line) proving stickier than headline (yellow line) as of early 2025 (image):
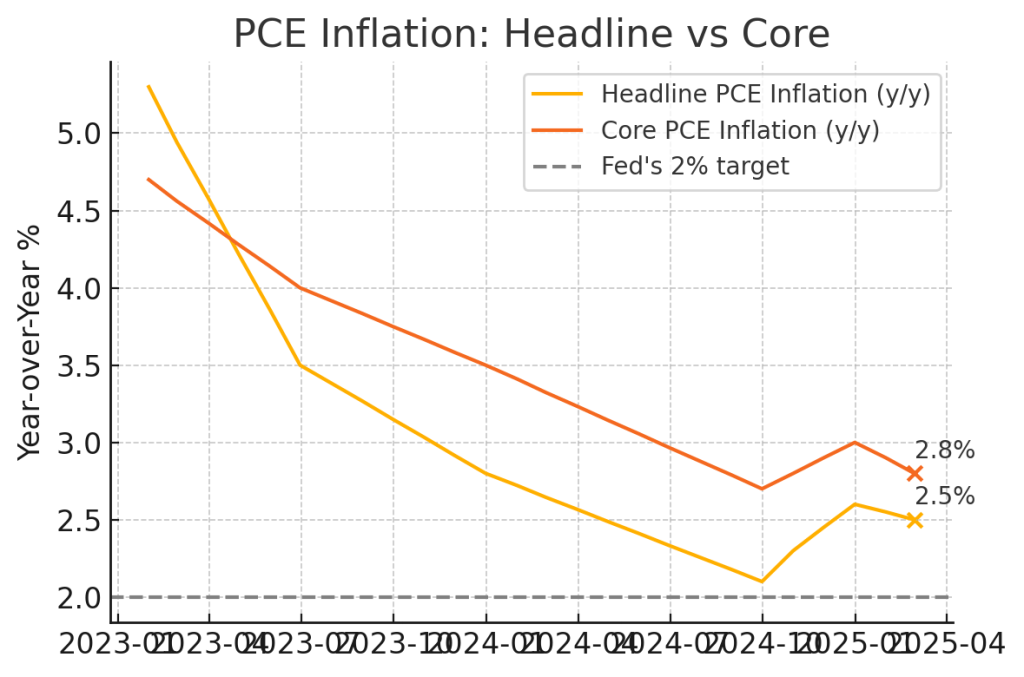
Chart: Headline PCE inflation has fallen from ~5% in early 2023 to ~2.5% now, while core PCE is running about 2.8%. Both measures are still above the Fed’s 2% goal (gray dotted line), with core inflation notably plateauing in recent months. (US core PCE prices rise more than expected in February – Investing Abroad News | The Financial Express)
This sticky core inflation complicates the outlook for the Federal Reserve. Just last week, Fed Chair Jerome Powell acknowledged that inflation had started to tick up partly due to new tariffs, warning that there “may be a delay in further progress” on bringing inflation to heel (US consumer spending rises in February; core inflation firmer | Reuters). The Fed kept its policy rate unchanged at their last meeting (still in the 4.25–4.50% range) and had been hinting at possible rate cuts later in the year. In fact, financial markets were pricing in a rate easing cycle to resume by June (US consumer spending rises in February; core inflation firmer | Reuters). But the combination of firmer inflation data and tariff-driven price pressures could give the Fed some pause.
At this point, the consensus is that the Fed will proceed cautiously. Core PCE at 2.8% is not alarmingly high (it’s a far cry from the 5%+ rates seen in 2022), but it’s also not yet at the Fed’s 2% comfort zone. If upcoming data (like next month’s inflation or jobs reports) show inflation re-accelerating, the Fed might delay rate cuts or even consider another hike. On the other hand, if the growth outlook deteriorates rapidly (e.g., clear signs of a recession emerging), the Fed could prioritize stimulus despite inflation being above target. It’s a delicate balance – essentially a tug-of-war between inflation and growth concerns.
For now, many analysts believe the Fed will tolerate inflation in the mid-2% range in order to avoid choking the economy. As one market strategist noted after the PCE release, “2.5% to 3% PCE might be good enough for now” – meaning the Fed could view that level as acceptable if it helps ensure financial stability (VIEW US PCE price inflation ticks higher in October, as expected | Reuters). Indeed, some at the Fed might even be relieved that inflation expectations haven’t become unanchored despite the tariff news. Consumers’ longer-term inflation expectations, while higher short-term, remain reasonably anchored (though this is something to monitor closely). Bottom line: the PCE report reinforces a “wait-and-see” stance for the Fed. They won’t slam the brakes with more hikes yet, but they’ll want to see a convincing downtrend in core inflation before cutting rates aggressively. For investors, this likely means policy uncertainty will persist – Fed decisions will be very data-dependent in coming months.
Trade Policy & Geopolitical Updates
Trade policy leapt to the forefront of market drivers this week. In addition to the high-profile auto tariffs, the Trump administration signaled plans for more measures aimed at trading partners that run large surpluses with the U.S. (US consumer spending rises in February; core inflation firmer | Reuters). The framing from the White House is that these “reciprocal tariffs” are meant to pressure other countries to lower their barriers. However, economists largely argue that such duties will raise costs for U.S. businesses and consumers, at least in the short run (US consumer spending rises in February; core inflation firmer | Reuters). We’re essentially witnessing a re-escalation of the trade war playbook from a few years ago, and the market is reacting accordingly.
Global context: These U.S. tariffs are straining relations with allies and rivals alike. For instance, officials in Europe and the UK are in talks to avert or respond to U.S. car tariffs – the UK even floated subsidies for Tesla and others as a bargaining chip (SNAPSHOT Futures extend losses after February inflation data | Reuters) (SNAPSHOT Futures extend losses after February inflation data | Reuters). China, too, is on alert; while no new China-specific tariffs were announced this week, it’s clear Beijing could be next in line. The uncertainty around supply chains is starting to unsettle multinational companies. Manufacturing surveys show increased caution, and global trade volumes could suffer if this continues.
From a geopolitical standpoint, another development is President Trump’s stance on the Ukraine-Russia conflict. The administration temporarily paused some U.S. financial support for Ukraine (Is this a market correction? | U.S. Bank), a move that has introduced geopolitical uncertainty. European allies worry about the signal this sends, and investors are weighing what it might mean for global stability. So far, there’s no immediate market-moving event from that decision, but it adds to the “wall of worry.” If tensions in Eastern Europe were to flare up again due to reduced U.S. support, that could, for example, impact energy markets (though oil prices have been relatively stable lately).
It’s also worth noting that safe-haven assets reacted to the week’s trade and geopolitical news. The Japanese yen – a traditional refuge in times of uncertainty – has climbed about 6% this year (S&P 500 correction in six charts | Reuters). Gold prices hit a record high this week, up over 13% year-to-date (S&P 500 correction in six charts | Reuters). These moves underscore that globally, investors are hedging against worst-case scenarios. In contrast, the U.S. dollar index softened a bit, reflecting expectations that U.S. growth may take a hit and the Fed might not hike further (VIEW US PCE price inflation ticks higher in October, as expected | Reuters).
Key takeaway on trade/geopolitics: The new tariff regime is a big wild card for markets. In the best case, these measures are a negotiating tactic that gets resolved with minimal economic damage (for example, if trading partners come to the table and strike deals). In the worst case, we enter a tit-for-tat cycle of tariffs that act as a stagflationary force – higher prices and slower growth. Investors should watch for any signs of negotiation or compromise in the coming weeks. Also, keep an eye on any retaliatory moves (e.g., Europe imposing tariffs on U.S. goods in response). Thus far, the tariff announcements were telegraphed in advance (businesses rushed imports in Q1 to get ahead of them, widening the trade deficit (US consumer spending rises in February; core inflation firmer | Reuters)), so part of the impact is already absorbed. But now that they are actually hitting, corporate earnings calls next month will likely be filled with talk of tariff impacts. Geopolitically, any further reduction in U.S. support on foreign fronts (Ukraine or elsewhere) could introduce new risks, but it could also mean the U.S. administration is focusing inward on the trade/economic front.
Sector Performance and Investor Positioning
One striking feature of this correction is how unevenly it has hit different sectors of the market. Unlike the broad sell-offs of early 2020 or 2008, this time investors have been rotating rather than indiscriminately dumping everything. Defensive, rate-sensitive sectors have actually held up or even gained, while high-growth sectors have borne the brunt of the decline (Is this a market correction? | U.S. Bank). The chart below shows year-to-date performance of the S&P 500’s sectors in 2025, illustrating this gap (image):
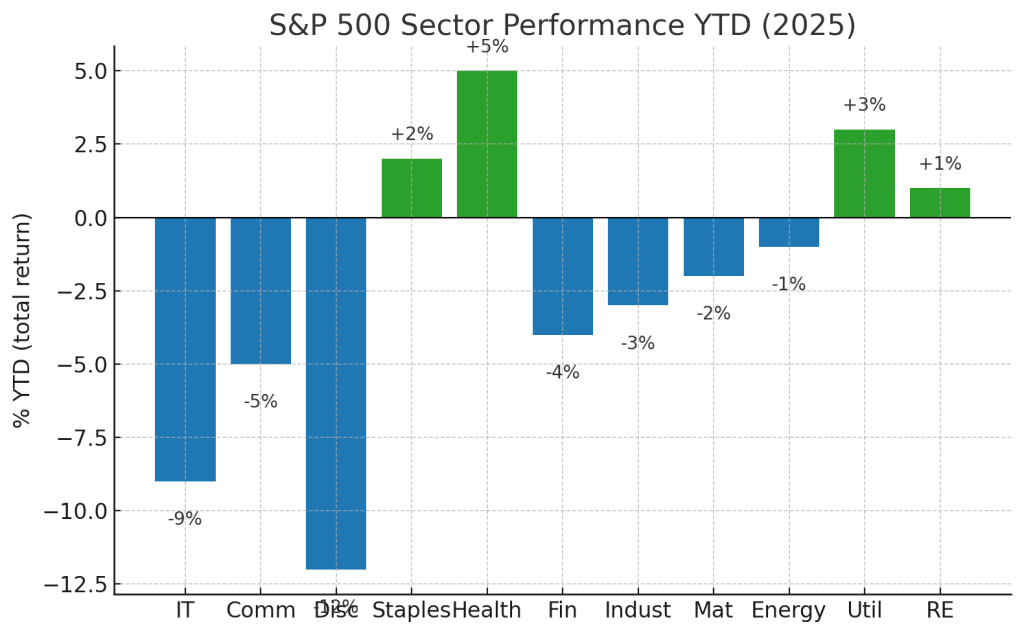
Chart: S&P 500 sector total returns YTD. “Green” bars (up on the year) include Health Care (+5%) and Consumer Staples (+2%), traditional defensive sectors. “Blue” bars show losses led by Consumer Discretionary (-12% YTD) and Information Technology (-9% YTD), as well as Communication Services (-5%). Other sectors like Financials (-4%), Industrials (-3%), Materials (-2%), and Energy (-1%) are modestly down. Utilities (+3%) and Real Estate (+1%) have eked out gains, benefiting from investors’ search for stability and lower interest rate expectations. (Is this a market correction? | U.S. Bank)
This divergence aligns with the narrative of investors flocking to safety amid uncertainty. Big Tech and consumer discretionary stocks – which had delivered outsized gains in 2023 and 2024 – are now underperforming as investors take risk off the table. In fact, the “Magnificent Seven” mega-cap tech/growth stocks have collectively fallen about 17% since the market peak, significantly more than the broader index (S&P 500 correction in six charts | Reuters). Tesla alone is down ~33% from its recent high (S&P 500 correction in six charts | Reuters), dragging the consumer discretionary sector (given its heavy weight there). What this tells us is that market leadership is shifting: the winners of the last rally are no longer the safe bets in a more uncertain economic climate.
Meanwhile, defensive plays are shining. The S&P 500 Health Care sector is up roughly 4–5% this year (S&P 500 correction in six charts | Reuters), as stable earnings and dividends become attractive. Consumer Staples, which sell everyday essentials, are slightly positive as well (S&P 500 correction in six charts | Reuters). These sectors are less sensitive to economic cycles – people still need medications and groceries in a downturn – so they’re acting as a refuge. Utilities (another classic defensive sector) and real estate investment trusts have also caught a bid in recent weeks, aided by the dip in long-term interest rates (the 10-year Treasury yield has fallen about 50 basis points since mid-January amid haven buying (S&P 500 correction in six charts | Reuters)).
Financials and cyclicals: Banks and financial stocks are down a few percent year-to-date. They haven’t been hit as hard as tech, partly because valuations were lower to start with, but they’re not thriving either. An inverted or flat yield curve and recession worries are headwinds for banks’ profitability. Industrials and materials, which are economically sensitive and now exposed to trade barriers, have slipped into the red as well. For example, if tariffs drive up input costs for manufacturers, industrial sector margins could suffer – something investors seem to be pricing in (industrials -3% YTD in our chart). Energy stocks are roughly flat: oil prices haven’t moved dramatically, so energy equities are holding their prior gains, but any global slowdown could weaken demand for crude, capping upside for the sector.
Investor positioning metrics confirm this rotation. According to Deutsche Bank, institutional investors have cut equity exposure to slightly underweight – the lowest since last August – as they moved into cash/bonds or defensive stocks (S&P 500 correction in six charts | Reuters). Hedge funds, which were heavily long tech, reportedly trimmed those positions significantly (Goldman Sachs noted hedge fund bullishness on stocks is at a 5-year low now) (S&P 500 correction in six charts | Reuters). In flows data, we’ve seen increased allocations to sectors like utilities and healthcare in recent weeks, while tech-focused funds saw outflows. All of this suggests a more cautious stance: investors are playing defense, preparing for more turmoil. For DIY investors, this doesn’t necessarily mean you should chase defensive names that have already run up. But it does mean it’s wise to evaluate your portfolio’s exposure – ensure you’re comfortable with how it might perform if the economy does slow further. Diversification across sectors can help cushion against these rotations.
Expert Consensus and Differing Views
With so many cross-currents, it’s no surprise that expert opinions are divided. However, we can roughly categorize two camps: a cautious consensus and a resilient contrarian view.
Cautious Consensus: Many economists and strategists are warning that risks are tilted to the downside. We already cited J.P. Morgan’s 40% recession odds (J.P. Morgan economist sees 40% US recession chance and risks to ‘exorbitant privilege’ | Reuters); similarly, a recent Reuters poll found 95% of economists across the U.S., Canada, and Mexico believe recession risks have increased due to Trump’s tariffs (J.P. Morgan economist sees 40% US recession chance and risks to ‘exorbitant privilege’ | Reuters). The prevailing view is that the trade conflict is a policy mistake that could needlessly slow growth and keep inflation from falling. Even Fed officials, while not publicly second-guessing fiscal policy, have hinted at concern – as Powell did about tariffs raising prices (US consumer spending rises in February; core inflation firmer | Reuters). On Wall Street, firms like Morgan Stanley have advised clients to remain cautious on equities until there’s clarity on trade policy. There’s also a growing consensus that earnings growth will be weaker later this year, as companies face higher costs and potentially softer demand. This camp doesn’t necessarily predict a deep recession, but it sees a bumpy road ahead, with stocks possibly struggling to make new highs until these issues are resolved.
Some of the voices here include Bruce Kasman (JPM economist), who as we noted sees elevated recession risk, and strategists like those at Goldman Sachs, who trimmed equity exposure and GDP forecasts on the tariff news (J.P. Morgan economist sees 40% US recession chance and risks to ‘exorbitant privilege’ | Reuters). Another perspective came from David Kelly of JPMorgan Asset Management (in a CNBC interview) saying “volatility is an opportunity to selectively buy, but only with a long-term lens and hedges in place” – basically acknowledging short-term risks. The cautious camp is not outright bearish on America’s long run prospects; it’s more about acknowledging that the easy gains are behind us and capital preservation is key in the near term.
Resilient Contrarians: On the other side, there’s a smaller but notable group of optimists who argue the economy and markets can weather this storm. They point out that household balance sheets are strong, unemployment is still low, and corporate cash levels are high (Is this a market correction? | U.S. Bank). For example, Eric Freedman, CIO of U.S. Bank Asset Management, noted that we’re “starting from a position of strength,” so the economy might absorb these changes better than feared (Is this a market correction? | U.S. Bank). Some bulls also argue that the Fed’s likely response to any serious slowdown (i.e. rate cuts or other easing) will put a floor under the market. In their view, any further dip in stocks would be met with a dovish Fed pivot – in fact, the bond market’s rally suggests investors expect exactly that.
There’s also a narrative that inflation is no longer the big bad enemy it was last year. As David Russell at TradeStation commented, inflation is “fading as an issue” and investors are shifting focus to growth (VIEW US PCE price inflation ticks higher in October, as expected | Reuters). If he’s right, then once markets digest the tariff shock, attention could turn to the positives, like potential tax cuts (the administration has hinted at wanting more tax relief, though nothing concrete yet) or infrastructure spending. Contrarians also highlight that global growth isn’t collapsing – Europe and other developed markets have seen their stocks rise this year, with the MSCI EAFE index up about 10% YTD outperforming U.S. stocks (Is this a market correction? | U.S. Bank). That relative strength abroad could mean the U.S. is temporarily lagging due to policy uncertainty, and it might catch up if clarity returns.
Even among this camp, no one is blindly bullish – it’s more about selective optimism. For instance, some see opportunities in beaten-down tech or small-cap stocks, arguing that valuations have improved after the pullback. Others suggest that if a recession hits, it could be so mild that markets might look through it quickly. Remember, stock markets often bottom before a recession is officially over. If investors anticipate a 2025 recession that’s shallow, they might start buying later this year in expectation of recovery.
In summary: The consensus tilts cautious right now, but there are credible voices on both sides. As a DIY investor, it pays to consider both scenarios – prepare for the worst, but don’t abandon hope for the best. That could mean maintaining a balanced portfolio: keep some defensive positions or cash in case things deteriorate further, but also keep a watchlist of quality stocks you’d like to own if they drop to attractive prices. That way you’re ready to act if the contrarian camp proves right and the market stabilizes, but also protected if the consensus of caution proves justified.
Conclusion & Key Takeaways
This week encapsulated the push-pull the market is facing. On one hand, data and developments stoked new worries – core inflation firmed up, the trade war is back in the headlines, and recession odds are rising. On the other hand, the economy still has areas of strength and the stock market’s decline, while uncomfortable, has been relatively orderly and focused in riskier assets. We’re essentially at a crossroads: the next few weeks and months will determine if this is a temporary correction that sets the stage for the next rally or the start of a more prolonged downturn.
Our updated outlook: We lean cautiously optimistic that a major bear market can be avoided, but we expect continued volatility. Our probability models (now showing 30% bear chance, 40% recession chance) reflect a meaningful risk that cannot be ignored. Much will depend on policy – both the Fed and the White House. If inflation data in the coming months show moderation (or if the Fed is willing to look past slightly-above-target inflation) and if trade negotiations show any progress, we could see confidence return quickly. In that scenario, the correction could bottom out and markets may resume a more positive trend later in the spring, led perhaps by those same defensive stocks initially (and eventually a rotation back into oversold growth names).
However, if tariff volleys continue or expand, pushing costs higher and confidence lower, the market’s downward slide could resume. The difference between a mild correction and a bear market might very well be whether trade tensions de-escalate by summer. Also, keep an eye on corporate earnings (the next earnings season kicks off soon). If we hear a chorus of companies warning about margins or cutting forecasts due to tariffs or slowing demand, it would reinforce the negative feedback loop and could justify further market declines.
For now, DIY investors should stay balanced and nimble. Ensure your portfolio is aligned with your risk tolerance. Use this period to reassess fundamentals of your holdings – high-quality companies with strong balance sheets are likely to fare better if things get rough. And remember, volatility also brings opportunity: some of the best long-term investments are made when fear is high (as evidenced by sentiment surveys today) and prices are lower. We’re not advocating catching falling knives blindly, but a watchful approach to buying quality on weakness can pay off when the clouds eventually part.
Finally, don’t go it alone – keep informed. The market landscape can change quickly, as this week proved. Stay tuned for our weekly updates where we’ll continue to update these probabilities and highlight key changes. By monitoring the data and expert insights with us each week, you can make more objective, confident decisions even in an uncertain environment.
Thank you for reading! If you found this analysis useful, consider subscribing to Vulcan-Stocks.com for weekly market insights delivered to your inbox. We’ll help you stay ahead of the curve with up-to-date probability modeling, chart analysis, and clear explanation of what it all means for your investments.
Subscribe now for free weekly updates and join a community of informed DIY investors navigating the markets together!


Leave a comment